Rotational excitation of simple polar molecules by H2 and electrons in diffuse clouds
Abstract
Context. Emission from strongly-polar molecules could be a probe of physical conditions in diffuse molecular gas.
Aims. We wish to provide basic information needed to interpret emission from molecules having higher dipole moments than CO, originating in diffuse clouds where the density is relatively low and the temperature and electron fraction are relatively high compared to dark clouds.
Methods. Parameter studies in LVG models are used to show how the low-lying rotational transitions of common polar molecules HCO+, HCN and CS vary with number density, column density and electron fraction; with molecular properties such as the charge state and permanent dipole moment; and with observational details such as the transition that is observed. Physically-based models are used to check the parameter studies and provide a basis for relating the few extant observations.
Results. Parameter studies of LVG radiative transfer models show that lines of polar molecules are uniformly brighter for ions, for lower J-values and for higher dipole moments. Excitation by electrons is more important for J=1-0 lines and contributes rather less to the brightness of CS J=2-1 lines. If abundances are like those seen in absorption, the HCO+ J=1-0 line will be the brightest line after CO, followed by HCN (1-0) and CS (2-1). Because of the very weak rotational excitation in diffuse clouds, emission brightnesses and molecular column densities retain a nearly-linear proportionality under fixed physical conditions, even when transitions are quite optically thick; this implies that changes in relative intensities among different species can be used to infer changes in their relative abundances.
Key Words.:
interstellar medium – molecules1 Introduction
The rotational excitation of CN in diffuse clouds was discussed as soon as CN was identified in the diffuse ISM by McKellar (1940). He calculated the “effective” or “rotational” temperature of interstellar space to be no more than 2.7 K and asked “if, indeed, the concept of such a temperature in a region with so low a density of both matter and radiation has any meaning.” The efficacy of CN as an early probe of the cosmic microwave background temperature was confirmed by its absence in several searches for mm-wave emission (Thaddeus, 1972; Crane et al., 1989; Black & van Dishoeck, 1991), but gaining insight into the structure of the absorbing gas requires more than upper limits on the excitation temperature of such a trace molecule. Moreover, actually detecting emission from various species among the many now known to exist in diffuse clouds may even permit imaging of the structure and chemistry of the host gas.
CO emission from diffuse clouds has long been known (see Knapp & Jura (1976) although several of the lines discussed there are telluric as noted in Liszt (2009)) and measurement of its excitation temperatures in absorption provides direct information on the ambient partial thermal pressure p/k n(H2) K (Smith et al., 1978; Liszt & Lucas, 1998). However, the mm-wave brightness of CO emission from diffuse gas is for the most part proportional only to the total CO column density N(CO) (Goldreich & Kwan, 1974; Liszt, 2007), somewhat leaving the determination of the physical properties of the medium to other means, which for the most part remain to be explored.
Emission from diffuse clouds is accessible in 18cm OH emission (Crutcher, 1979) and 9cm CH emission (Magnani et al., 1998, 2003), but the lines are weak, the spatial resolution is relatively poor and the emission arises from states that are difficult to model or interpret (Felenbok & Roueff, 1996; Liszt & Lucas, 1996, 2002) . Determination of the internal properties of diffuse gas would be well-served by wider detection of mm-wave emission of molecules more strongly polar than CO, whose emission brightness might depend more directly on the number density and electron fraction in addition to the molecular column density, and which could be observed with arcminute or better spatial resolution. Moreover, receivers have recently undergone drastic improvement in the 3mm band, so that the weakness of lines (see below) should not be such a barrier to future progress.
Emission from strongly polar molecules has been seen in limited fashion in diffuse gas, in HCO+ (Liszt & Lucas, 1994; Lucas & Liszt, 1996; Liszt, 1997; Kopp et al., 1996; Falgarone et al., 2006), CS (Drdla et al., 1989) and HCN (Liszt, 1997). Where the HCO+ column density and optical depth are known in absorption, the weak HCO+ emission from opaque lines requires a small excitation temperature given by the line brightness, so that the density can be discussed independent of the column density (Lucas & Liszt, 1996; Liszt & Lucas, 2000). More generally, the density of colliding partners and the column density of emitting molecules are not separable from observations of a single transition, but surveys of the relative abundances of the various molecules in absorption might allow some of this unfortunate degeneracy to be relieved. Observing the relative intensities of various species could a means of deriving the ambient physical conditions if the relative abundances of those species are sufficiently well constrained by other means, and vice versa.
The plan of this work is as follows. In Sect. 2 we lay out the basic elements of model calculations of rotational excitation by collisions with electrons and H2 in diffuse gas for species with different and varying permanent dipole moment and abundance. The first of these studies, described in Sect. 3, is a purely parametric study using LVG radiative transfer (Goldreich & Kwan, 1974) to limn the borders of the relevant parameter space. The second is a more physically-based study of excitation in models where the thermal and chemical balance and CO brightness are calculated in some detail and the results are relevant to interpretation of emission line observations of polar species when the only other or a priori information available on the host cloud is the strength of CO emission. The results of these studies are presented along with a summary of the extant observations in Sect. 4. The results of this work are summarized in Sect. 5.
2 Models of excitation of polar molecules in diffuse clouds
Molecule-bearing diffuse clouds are marked by elevated temperatures: = 70-80 K for H2 (Savage et al., 1977; Rachford et al., 2002) generally, while somewhat lower temperatures are found for regions with higher N(CO) = (Sonnentrucker et al., 2007; Sheffer et al., 2007). They are also marked by modest density n(H) and high electron fraction n(e)/n(H) , the latter corresponding to the free gas phase abundance of elemental carbon (Sofia et al., 2004) and a contribution from cosmic-ray ionization of hydrogen (Liszt, 2003). Excitation calculations also must take into account that the J=1-0 rotational transition of a species having a permanent dipole moment Debye (1D = esu) will have at column density per unit velocity dN/dV (km s-1)-1, as is observed for many species.
When the excitation is as weak as that which occurs in diffuse clouds for strongly-polar molecules, or said somewhat differently, so very sub-thermal (even in CO although it is much more strongly excited), emission line brightnesses are linearly proportional to column density even when the line optical depth is large. This occurs because, with so little collisional excitation, there is also little collisional de-excitation and most collisional excitations are followed by radiative de-excitation (Lyman- radiative transfer is an extreme example of the same phenomenon). Photons escape the medium even if they are scattered and re-absorbed many times (Goldreich & Kwan, 1974). For CO the brightness is also insensitive to the ambient density at fixed N(CO) (Goldreich & Kwan, 1974; Liszt, 2007) and the electron fraction is unimportant because of the small dipole moment (0.11D).
2.1 Excitation by electrons
Excitation of strongly polar molecules by electrons has a strongly dipole character (J) and the rates for such transitions are quite accurately represented in closed form for molecular ions (Dickinson & Flower, 1981; Bhattacharyya et al., 1981) and neutrals (Dickinson et al., 1977) having dipole moments D. The two formulations of the e-ion excitation rates are entirely equivalent although somewhat differently expressed (see also Neufeld & Dalgarno (1989)). More accurate rates for e-HCO+ and e-HCN collisions including transitions have recently been calculated by Faure et al. (2007a) and Faure et al. (2007b), respectively, and for CS by Varambhia et al. (2010) and a comparison between calculations using them and the older rates in closed form is given below for HCO+ in Fig. 3.
2.2 Excitation of strongly-polar molecules by neutral particles
Excitation rates for H2-HCO+ interactions were extensively recalculated by Flower (1999). Other species explictly discussed here are CS (Green & Chapman, 1978) and HCN (Green & Thaddeus, 1974; Monteiro & Stutzki, 1986). The dependence of these collisional rate constants on the dipole moment of the target molecule is ignored here because they should be relatively weak compared to the other dependencies such as the electron-excitation rates and the spontaneous emission rates.
2.3 Excitation of carbon monoxide
The excitation of CO in diffuse clouds was recently discussed by Liszt (2006) and Liszt (2007). Note that the very large H-CO excitation rates calculated by Balakrishnan et al. (2002) and extensively discussed by Liszt (2006) were subsequently repudiated (Shepler et al., 2007). Because of its low dipole moment CO is largely unaffected by the electron fraction and this is illustrated in some of the parameter studies shown below where the molecular dipole moment is artificially varied to take advantage of the existence of analytic formulae for the electron excitation rates. For strongly sub-thermal excitation, the excitation temperature of the J=1-0 transition of CO is proportional to the ambient partial thermal pressure of H2, p/k = n(H2), not to either or n(H2) individually.
2.4 Permanent dipole moments
The permanent dipole moments used here are: CO, 0.112D; HCO+, 3.889 D; CS, 1.96 D; and HCN, 2.98 D. In our earlier work we used a value = 4.07 D for HCO+, which gave smaller HCO+ column densities by a factor (4.07/3.889)2 = 1.10 for a given integrated optical depth.
2.5 Radiative transfer
Strongly polar molecules typically become optically thick in their low-lying transitions for column densities around dN/dV (km s-1)-1, which is typical of actual observed abundances. Therefore it is necessary to treat the radiative transfer in some fashion. Sect. 3 presents a series of parameter studies in the usual LVG approximation (Goldreich & Kwan, 1974) which amounts to solving the full, coupled, excitation rate equations in the escape probability approximation, taking q = as the photon escape probability for a transition whose optical depth is and setting the line source function Sν = q Bν() + (1-q) Bν(). In these expressions is the transition excitation temperature and Bν is the Planck function. As noted by Goldreich & Kwan (1974), using the escape probability formulation transforms the rate equations so that they resemble the optically thin limit but with all the radiative rates (basically, the Einstein A-values) multiplied by q.
Section 4 presents a more detailed calculation for small uniform density gas spheres in which the radiative transfer is calculated numerically in the microturbulent approximation.
2.6 Observed relative abundances
The abundances of HCO+, HCN and CS observed in absorption at mm-wavelengths are summarized in Fig. A.1 of Appendix A. The calculations here were done with X(CS) = X(HCN) = X(HCO+) = .
2.7 Molecules not considered here
The discussion here is limited to a few of the simplest species that are detected in diffuse gas. Failed searches for emission from CN (D) were noted in the Introduction but its intensity is severely diluted by hyperfine structure; HCN, whose abundance with respect to CN is fixed in diffuse gas (Liszt & Lucas, 2001), has a twice-larger dipole moment and is brighter in emission, leaving little reason to continue the old quest for CN. C2H is ubiquitous in diffuse gas (Lucas & Liszt, 2000; Gerin et al., 2011), although its emission brightness will be diluted by hyperfine structure. The dipole moment of C2H is 0.78 D.
3 Parameter studies
3.1 The HCO+ J=1-0 transition
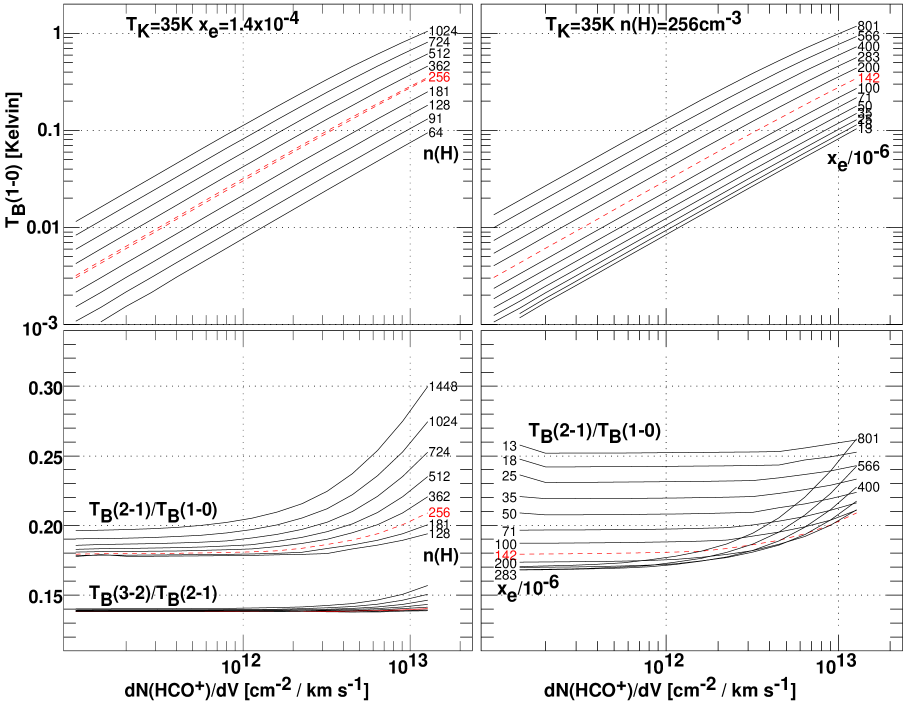
Figure 1 shows a composite of results for a calculation of HCO+ excitation, where the horizonal axis is the column density per unit velocity. As context, note that the HCO+ J=1-0 line has optical depth for dN/dV (km s-1)-1 and many other molecules like HCN (Liszt & Lucas, 2001) and CS (Lucas & Liszt, 2002) increase in abundance relative to HCO+ for N(HCO+) . The largest values we have seen in absorption for individual kinematic components is N(HCO+) (Lucas & Liszt, 1996) and typical line profile FWHM are 1-1.5 km s-1. A typical fractional abundance for HCO+ is X(HCO+) = n(HCO+)/N(H2) = (Liszt et al., 2010).
At the top in Fig. 1 the brightness of the J=1-0 line is plotted for a wide range of hydrogen number density at fixed xe = ne/n and at right for varying xe at n(H) = 256 . Note that n(H) = 2 n(H2) in the LVG calculations of Fig. 1-3 and the use of n(H) rather than n(H2) is for the sake of consistency with the more detailed calculations (see Sect. 4) in which n(H) is stipulated and the H-H2 equilibrium is actually calculated. Clearly the line brightnesses are linearly proportional to the column density for both optically thick and thin emission as for sub-thermally excited CO (see Fig. 6 of Liszt (2007)), but they are also sensitive to the density of H2 and electrons. At left, the calculation for n(H) has actually been repeated for = 35 and 15 K to illustrate the weak temperature dependence of electron excitation of the J=1-0 transition. This simple calculation accounts for the weak observed HCO+ lines seen near absorption line background targets (Lucas & Liszt, 1996) with typical values of the electron fraction at modest n(H) . Note that near the horizontal mid-point of each panel, so that at the rightmost edge. Some deviation from linearity is seen at the highest densities and electron fractions where the excitation is stronger and more molecules are supported in higher levels of the rotation ladder.
At top right in Fig. 1 it is seen that electron excitation accounts for some 75% of the line brightness under these nominal conditions. Electron fractions much higher than 10-4 are hard to maintain in denser gas given the free carbon abundance and the electron fraction in physically-based models actually declines noticeably for n(H) , although carbon remains almost fully-ionized (see Sect. 4).
In the lower panels we show the brightness of the higher lying lines (the J=2-1 line is often inaccessible near z = 0 owing to atmospheric absorption). At moderate column density they are somewhat more dependent on the electron fraction than the number density (see at right) while the opposite is true at high density. At present, detecting emission from any but the J=1-0 line of HCO+ seems unlikely for diffuse clouds.
3.2 CS J=2-1
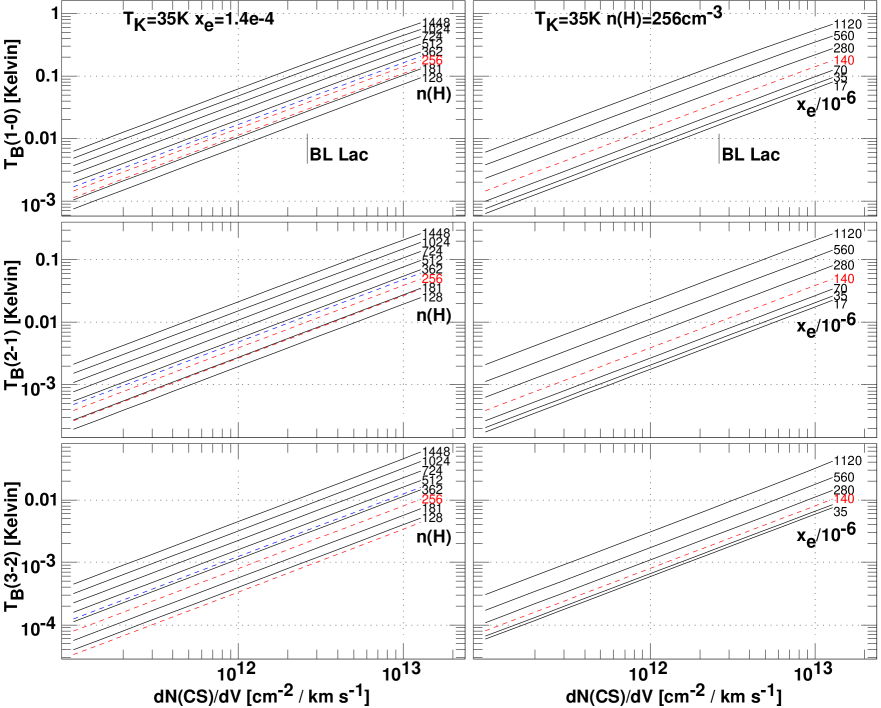
Figure 2 shows the brightnesses of the lowest three lines of CS, calculated using the closed form of the electron-neutral molecule excitation rates (also see Drdla et al. (1989)). As for HCO+ the CS lines decline strongly in brightness with each successive increase in J and although the HCO+ and CS J=1-0 lines will be about equally bright at the same column density, the predicted CS J=2-1 lines are about a factor 6 weaker. About equal column densities are typical for N(HCO+) (see Fig. A.1). Weakness of the CS emission is due to a variety of factors, CS being neutral and less strongly polar (1.96 vs. 3.89 D), but mostly the difference arises from comparison of J=2-1 and J=1-0 transitions. Less of the line brightness is due to electrons in the CS J=2-1 transition than for HCO+ J=1-0, perhaps half (top right), and very little at all for the CS J=3-2 line given the difficulty of moving population into higher J-levels with only J transitions. As shown in Fig. 2, the brightnesses of the higher-lying CS transitions are more sensitive to temperature because more of the excitation is due to H2 and the rotation levels lie higher in energy so that purely thermodynamic considerations become more important.
3.3 The importance of being polar
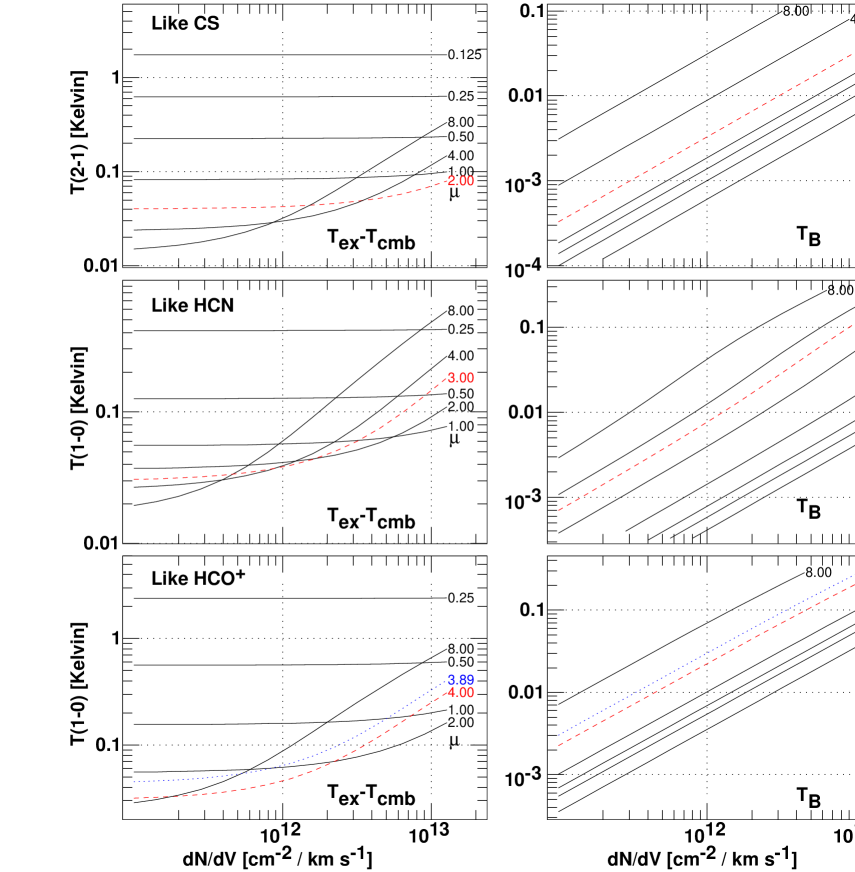
To illustrate the influences at work in these excitation studies owing to the structure of the individual species, we performed another sort of parameter study which takes advantage of the availability of closed forms for the electron excitation rates. The excitation and line brightness are calculated for various transitions and molecules, but the permanent dipole moment is treated as a variable whereever it appears explicitly. In particular we consider the J=2-1 line of CS and the 1-0 transitions of HCN and HCO+.
Figure 3 shows the excitation temperatures (at left) and line brightness (at right) as the permanent dipole moment varies from 0.1 to 8 D, for the default values employed in Fig. 1-2 (nH = 256 , ne/nH = , = 35 K), for hypothetical species whose energy level spacings etc. are the same as for HCO+, HCN and CS. Highlighted are the series of models at those values closest (actually very very close) to the true dipole moments. For HCO+, results are also shown for the correct permanent dipole moment and the more accurate recent excitation rates of Faure et al. (2007a). The HCO+ lines are somewhat brighter and more highly excited when the more detailed electron excitation scheme is employed; larger differences would appear for the higher-lying lines.
The behaviour seen in Fig. 3 is curious in some regards. Excitation temperatures decline monotonically with for optically thin lines and then increase when both the dipole moment and optical depth grow large but none of this behavior is apparent in the line brightness: in all cases the lines are simply brighter for higher dipole moments. It is generally noted that electron excitation provides about the same degree of excitation for all species independent of because the excitation rates and spontaneous emission rates both vary as . However the current cases are not pure, more so for CS J=2-1, and electron excitation generally dominates only when the dipole moments are large even for the species which actually are more strongly polar. The decreasing excitation temperatures at small occur because the excitation is dominated by neutrals so that increasing mostly serves to cause higher but uncompensated spontaneous decay rates. Eventually, increasing the dipole moment raises the line optical depths to the point that radiative pumping props up the excitation temperatures.
.
4 Existing observations of HCO+, HCN and CS emission
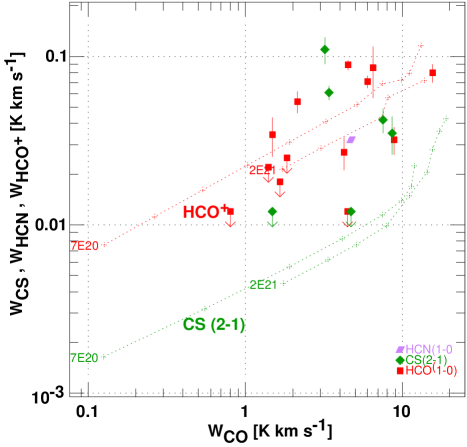
To compare observations and datasets on something like a common scale, we searched the literature for observations of polar species with accompanying 12CO measurements and these are shown in Fig. 4. In the following we denote the integrated brightness of the J=1-0 line by WCO, while those CS and HCN are W(CS) and W(HCN).
4.1 HCO+
Shown in Fig. 4 are observations of HCO+ and 12CO J=1-0 from the HCO+ absorption line survey of Lucas & Liszt (1996) (for CO also see Liszt & Lucas (1998)) and emission line observations of the clouds occulting Oph by Kopp et al. (1996) and Liszt (1997). Falgarone et al. (2006) only reported 13CO measurements to accompany their observations of HCO+ in Polaris. The general run of HCO+ brightnesses in the range W(HCO+) = 0.01 - 0.1 K km s-1 is very much in line with the model results in Fig 1 for n(H) and N(HCO+) as typically observed. HCO+ appears in diffuse gas at a level W(HCO+) WCO/100.
4.2 HCN
HCN emission was probably detected at the position of peak HCO+ emission South of Oph (Liszt, 1997) at about 1/3 the strength of HCO+; this datapoint appears in Fig. 4 at WCO = 6 K km s-1. It is in line with expectations for approximately equal column densities of HCO+ and HCN as observed in absorption, see Fig. A.1.
4.3 CS
Observations of CS J=2-1 were made by Liszt (1997) at positions around the sightline to Oph. Where HCO+ emission was strongest 30′ South of the star, with W(HCO+) = 0.09 K km s-1and W(CO) = 6 K km s-1, CS was undetected at a () level 5 times weaker. CS was also undetected toward the star, in line with expectations for the calculated excitation conditions in Figs. 1 and 2 with N(CS) N(HCO+) as observed in absorption. More recently (to be published), we failed to detect CS emission at several other locations in the Southern portions of the Oph cloud, including in directions showing 15 K CO lines.
However, much stronger CS emission was reported by Drdla et al. (1989) along several sightlines toward bright stars used as targets for optical absorption line studies. It is possible that the strong CS emission arises from material located behind the target stars, as is often the case for CO emission in such surveys (Liszt, 2009) but the accompanying HCO+ lines would be very bright indeed, and anomalously bright with respect to CO, if they were several times stronger than the observed CS. The N(CS)/N(HCO+) ratio may vary over a wider range than was apparent toward the set of background sources we surveyed in absorption, where N(CS)/N(HCO+) according to Fig. A.1.
4.4 Physical models
In practice, emission lines of CO may well be all that is available to infer cloud properties when HCO+ or other polar species are sought and that is the common meaure we applied to compare observations in Fig. 4. To bridge the gap between observation and the LVG parameter studies described in Sect. 3, we extended our earlier models of H2 and CO formation (Liszt, 2007) to calculate the emergent line brightness of HCO+ and CS as well as CO. The models self-consistently determine the thermal equilibrium (Wolfire et al., 1995) and equilibrium abundances of H2 and CO as a function of radius in small spherical gas clots of given number and column density n(H) and N(H), under the assumption111This general methodology is known as “faith-based chemistry” that CO forms from the ordinary thermal recombination of a fixed relative abundance of HCO+, X(HCO+) . The emergent line brightness is calculated for a microturbulent medium of fixed linewidth. For instance, Fig. 6 of Liszt (2007) shows how WCO N(CO) for 0.1 K km s-1 WCO 10 K km s-1, N(CO) (as observed) even though at N(CO) .
Shown in Fig. 4 are two series of models for HCO+ and for CS. Each curve is for a fixed central column density N(H) = 0.7 or 2 and the internal number density of hydrogen increases to the right in marked steps of 20.5 beginning with n(H) = 128 at the left-most point. The relative abundances of CS and HCO+ were taken equal, . The HCO+ and CS brightnesses are slightly lower at higher N(H) and fixed WCO because models with higher N(H) form CO more readily and have slightly lower electron fractions. Models with higher N(H) have brighter CS and HCO+ lines at the same number density (i.e. at their respective left-hand sides) but only because they have commensurately higher CS and HCO+ column densities.
The models reproduce the general run of observations of HCO+ but the calculated W(HCO+)/WCO ratios are basically fixed by the HCO+ recombination chemistry and the empirically-determined HCO+ abundance and are very difficult to fine-tune. The W(HCO+)/WCO brightness ratio actually decreases slightly when X(HCO+) increases because the CO abundance increases even faster. This is opposite to the linear, proportional variation of W(CS) with X(CS) that occurs because changing X(CS) does not affect WCO.
The physically-based calculation confirms the insight from the LVG parameter studies that J=2-1 lines of CS will be much dimmer than J=1-0 HCO+ when X(CS) = X(HCO+) but the two model curves for CS are almost coincident with each other in this parametrization (as is also nearly the case for HCO+). This means that the only way of effecting a strong change in the CS/HCO+ brightness ratio (at fixed WCO) will be to vary X(CS). Although CS and HCO+ were not measured along the same directions in Fig. 4 with strong CS emission, the existence of comparably bright HCO+ and CS lines at similar values of WCO strongly implies that X(CS) X(HCO+).
5 Summary
In Sect. 3 (see Figs. 1-3) we discussed a series of parameter studies based on LVG radiative transfer calculations for actual molecules (HCO+, HCN, CS) and a series of synthetic analogues with varying permanent dipole moments. In diffuse molecular gas at weak excitation, lines of polar molecules are uniformly brighter for ions, for lower J-values and for higher dipole moments. Excitation by electrons is more important for ions and for J=1-0 lines and contributes rather less to the brightness of J=2-1 lines. The fact that HCO+ is observed in its J=1-0 line and at about the same column density as HCN or CS should make it several times brighter in emission than HCN J=1-0 or CS J=2-1. Low levels of HCO+ J=1-0 emission ( K) should be ubiqitous in diffuse gas if (as observed) HCO+ is itself ubiquitous at column densities around N(HCO+) = . Of course abundances play a role in whether a species is detectable and the relative abundances of HCO+ and CS or HCN differ (the CS/HCN ratio varies less, see Fig. A.1) and may vary by amounts which are also comparable to the differences in brightness induced by the other factors discussed here.
Perhaps the most important point to take away from the simulations is the linear proportionality between intensity and column density that applies to all species and low-lying transitions when the excitation is as weak as it is in diffuse gas. This is true almost without regard for optical depth over the range of column densities that are typical of observed diffuse clouds222This also applies to CO, although the discussion here is really concerned with more strongly polar species. . This proportionality means that model line brightnesses calculated under given physical conditions can simply be scaled over a very wide range of molecular column density in many cases (a notable exception is when the brightnesses of HCO+ and CO are compared, see Sect. 4). But it also implies that when different species are observed along the same lines of sight (more precisely, under the same physical conditions), their relative brightnesses are set by their relative abundances. Variations in their relative brightnesses from position to position result from variations in their relative abundances, because variations in physical conditions do not shift the pattern of relative brightnesses appreciably (compare Fig. 1 and 2). Observing, say, CS J=2-1 and HCO+ J=1-0 lines of comparable brightness along the same line of sight really implies that N(CS)/N(HCO+) , a situation that has never been observed in our absorption line work.
We gathered and compared existing observations of mm-wave emission from polar species in Sect. 4. To put the different datasets on a command basis we plotted their brightneess against WCO, the integrated brightness of the J=1-0 CO line. HCO+ emission at a level 1-2% of WCO is typical. In line with the results of the parameter studies, CS emission is not seen in the gas around Oph, even when HCO+ emission is relatively strong and somewhat weaker HCN emission is probably detected at a level some three times weaker then HCO+. However, CS emission is detected in the directions of several early-type stars used for optical absorption line studies, with brightnesses that are quite comparable to those of HCO+ at similar WCO in other directions. This implies somewhat larger variations in the CS/HCO+ abundance ratio than were seen in absorption, and larger values of X(CS).
To bridge the gap between these observations and the simulations and parameter studies we calculated the brightnesses of HCO+ and CS lines in diffuse cloud models that previously were used to calculate the brightness of CO. In these models CO forms from the recombination of a fixed relative abundance X(HCO+) = . This chemical relationship couples the emergent brightnesses of the two species and largely fixes the ratio of their line brightnesses that otherwise is difficult to adjust. The models reproduce the observed HCO+/CO brightness temperature ratio (1-2%).
Plotting the observed brightness of polar molecules against WCO creates degeneracies in the parametric dependences of the brightness on other physical variables, such that curves of W(CS) vs. WCO nearly coincide even for cloud models that differ appreciably in their hydrogen number and column densities (Fig. 4). That is, for a fixed set of relative abundances, the relative brightnesses are fixed over a wide range of physical parameter space. In that case, the relative brightnesses are determined chiefly by the various X(CS), X(HCN), etc, an insight we also gained from the preceding LVG-based parameter studies.
Acknowledgements.
The National Radio Astronomy Observatory is operated by Associated Universites, Inc. under a cooperative agreement with the US National Science Foundation. I thank Alexandre Faure and Jonathan Tennyson for providing the full set of electron excitation rates for HCO+ prior to publication and am happy to acknowledge valuable discussions with Michel Guelin and Jerome Pety. This work was supported in part by the grant ANR-09-BLAN-0231-01 from the Agence Nationale de la Recherche (France), the SCHISM project see http://schism.ens.fr/ .References
- Balakrishnan et al. (2002) Balakrishnan, N., Yan, M., & Dalgarno, A. 2002, ApJ, 568, 443 (BYD)
- Bhattacharyya et al. (1981) Bhattacharyya, S. S., Bhattacharyya, B., & Narayan, M. V. 1981, ApJ, 247, 936
- Black & van Dishoeck (1991) Black, J. H. & van Dishoeck, E. F. 1991, ApJ, 369, L9
- Crane et al. (1989) Crane, P., Hegyi, D. J., Kutner, M. L., & Mandolesi, N. 1989, ApJ, 346, 136
- Crutcher (1979) Crutcher, R. M. 1979, ApJ, 231, L151
- Dickinson & Flower (1981) Dickinson, A. S. & Flower, D. R. 1981, Mon. Not. R. Astron. Soc., 196, 297
- Dickinson et al. (1977) Dickinson, A. S., Phillips, T. G., Goldsmith, P. F., Percival, I. C., & Richards, D. 1977, A&A, 54, 645
- Drdla et al. (1989) Drdla, K., Knapp, G. R., & van Dishoeck, E. F. 1989, ApJ, 345, 815
- Falgarone et al. (2006) Falgarone, E., Pineau Des Forêts, G., Hily-Blant, P., & Schilke, P. 2006, A&A, 452, 511
- Faure et al. (2007a) Faure, A., Tennyson, J., Varambhia, H. N., Kokoouline, V., Greene, C. H., & Stoecklin, T. 2007a, in Molecules in Space and Laboratory
- Faure et al. (2007b) Faure, A., Varambhia, H. N., Stoecklin, T., & Tennyson, J. 2007b, Mon. Not. R. Astron. Soc., 382, 840
- Felenbok & Roueff (1996) Felenbok, P. & Roueff, E. 1996, ApJ, 465, L57+
- Flower (1999) Flower, D. R. 1999, Mon. Not. R. Astron. Soc., 305, 651
- Gerin et al. (2011) Gerin, M., Kaźmierczak, M., Jastrzebska, M., Falgarone, E., Hily-Blant, P., Godard, B., & de Luca, M. 2011, A&A, 525, A116+
- Goldreich & Kwan (1974) Goldreich, P. & Kwan, J. 1974, ApJ, 189, 441
- Green & Chapman (1978) Green, S. & Chapman, S. 1978, Astrophys. J., Suppl. Ser., 37, 169
- Green & Thaddeus (1974) Green, S. & Thaddeus, P. 1974, ApJ, 191, 653
- Knapp & Jura (1976) Knapp, G. R. & Jura, M. 1976, ApJ, 209, 782
- Kopp et al. (1996) Kopp, M., Gerin, M., Roueff, E., & Le Bourlot, J. 1996, A&A, 305, 558
- Liszt (1997) Liszt, H. S. 1997, A&A, 322, 962
- Liszt (2003) —. 2003, A&A, 398, 621
- Liszt (2006) —. 2006, A&A, 458, 507
- Liszt (2007) —. 2007, A&A, 476, 291
- Liszt (2009) —. 2009, A&A, in press
- Liszt & Lucas (1994) Liszt, H. S. & Lucas, R. 1994, ApJ, 431, L131
- Liszt & Lucas (1996) —. 1996, A&A, 314, 917
- Liszt & Lucas (1998) —. 1998, A&A, 339, 561
- Liszt & Lucas (2000) —. 2000, A&A, 355, 333
- Liszt & Lucas (2001) —. 2001, A&A, 370, 576
- Liszt & Lucas (2002) —. 2002, A&A, 999, 888
- Liszt et al. (2010) Liszt, H. S., Pety, J., & Lucas, R. 2010, A&A, 518, A45+
- Lucas & Liszt (1996) Lucas, R. & Liszt, H. S. 1996, A&A, 307, 237
- Lucas & Liszt (2000) —. 2000, A&A, 358, 1069
- Lucas & Liszt (2002) —. 2002, A&A, 384, 1054
- Magnani et al. (2003) Magnani, L., Chastain, R. J., Kim, H. C., Hartmann, D., Truong, A. T., & Thaddeus, P. 2003, ApJ, 586, 1111
- Magnani et al. (1998) Magnani, L., Onello, J. S., Adams, N. G., Hartmann, D., & Thaddeus, P. 1998, ApJ, 504, 290
- McKellar (1940) McKellar, A. 1940, Publ. Astron. Soc. Pac., 52, 187
- Monteiro & Stutzki (1986) Monteiro, T. S. & Stutzki, J. 1986, Mon. Not. R. Astron. Soc., 221, 33P
- Neufeld & Dalgarno (1989) Neufeld, D. A. & Dalgarno, A. 1989, Phys. Rev. A, 40, 633
- Rachford et al. (2002) Rachford, B. L., Snow, T. P., Tumlinson, J., Shull, J. M., Blair, W. P., Ferlet, R., Friedman, S. D., Gry, C., Jenkins, E. B., Morton, D. C., Savage, B. D., Sonnentrucker, P., Vidal-Madjar, A., Welty, D. E., & York, D. G. 2002, ApJ, 577, 221
- Savage et al. (1977) Savage, B. D., Drake, J. F., Budich, W., & Bohlin, R. C. 1977, ApJ, 216, 291
- Sheffer et al. (2007) Sheffer, Y., Rogers, M., Federman, S. R., Lambert, D. L., & Gredel, R. 2007, ApJ, 667, 1002
- Shepler et al. (2007) Shepler, B. C., Yang, B. H., Dhilip Kumar, T. J., Stancil, P. C., Bowman, J. M., Balakrishnan, N., Zhang, P., Bodo, E., & Dalgarno, A. 2007, A&A, 475, L15
- Smith et al. (1978) Smith, A. M., Stecher, T. P., & Krishna Swamy, K. S. 1978, ApJ, 220, 138
- Sofia et al. (2004) Sofia, U. J., Lauroesch, J. T., Meyer, D. M., & Cartledge, S. I. B. 2004, ApJ, 605, 272
- Sonnentrucker et al. (2007) Sonnentrucker, P., Welty, D. E., Thorburn, J. A., & York, D. G. 2007, Astrophys. J., Suppl. Ser., 168, 58
- Thaddeus (1972) Thaddeus, P. 1972, Ann. Rev. Astrophys. Astron., 10, 305
- Varambhia et al. (2010) Varambhia, H. N., Faure, A., Graupner, K., Field, T. A., & Tennyson, J. 2010, Mon. Not. R. Astron. Soc., 403, 1409
- Wolfire et al. (1995) Wolfire, M. G., Hollenbach, D., McKee, C. F., Tielens, A. G. G. M., & Bakes, E. L. O. 1995, ApJ, 443, 152
Appendix A Relative abudances of HCO+, HCN and CS
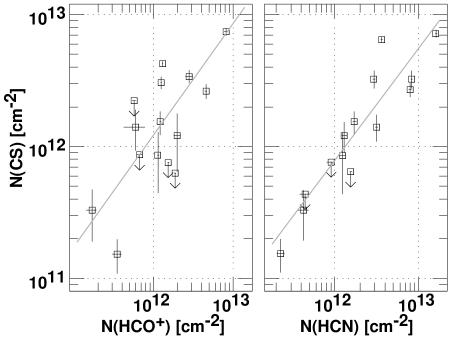
Shown in Fig. A.1 are the column densities of HCO+, HCN and CS as observed in absorption toward extragalactic mm-wave continuum sources in the work of Lucas & Liszt (1996) for HCO+, Liszt & Lucas (2001) for HCN and Lucas & Liszt (2002) for CS.