Measurement of the inclusive electron cross-section from the decays of heavy flavour hadrons in pp collisions at = 7 TeV at ATLAS
Abstract
We present the measurement of the inclusive electron spectrum in proton-proton collisions at a centre-of-mass energy of 7 TeV, using 1.3 pb-1 of data collected by the ATLAS experiment at the Large Hadron Collider. Signal electrons in the transverse momentum range GeV and within , excluding , are extracted from the dominant hadron and conversion backgrounds. After subtraction of the small // contribution, the cross-section as a function of is found to be in good agreement with theoretical predictions for heavy flavour production from Fixed Order NLO calculations with Next-to-Leading-Log high- resummation.
I INTRODUCTION
The inclusive production of electrons at low transverse momentum () is dominated by decays of charm and beauty hadrons and may be used to constrain theoretical predictions for heavy-flavour production. In this analysis prl the spectra of inclusive electrons is measured using an integrated luminosity of pb-1 of ATLAS data, within a kinematic acceptance of GeV and pseudorapidity111ATLAS uses a right-handed coordinate system with its origin at the centre of the detector and the z-axis coinciding with the axis of the beam pipe. The pseudorapidity is defined in terms of the polar angle as . range , excluding .
The ATLAS detector DetectorPaper consists of three main components: an Inner Detector (ID) tracking system, surrounded by electromagnetic (EM) and hadronic calorimeters and an outer muon spectrometer. The ID provides precise track reconstruction within , employing silicon pixel and microstrip detectors and an outer Transition Radiation Tracker (TRT). Within , EM calorimetry is provided by the barrel and end-cap lead/Liquid-Argon (LAr) EM sampling calorimeters. The reconstruction of electron candidates is seeded by a preliminary set of clusters in the EM calorimeter using a sliding window algorithm, with those clusters having a match to a suitable ID track being reconstructed Note . In the transition region between the barrel and end-cap calorimeters at the electron identification and energy resolution is degraded by the large amount of material in front of the first active layers of the calorimeters, prompting the exclusion of this region from the analysis.
The candidate events were selected using the hardware-based first-level (L1) calorimeter trigger, which identifies EM clusters within above a given energy threshold. The data were recorded under four different trigger conditions, with a progressively higher minimum cluster transverse energy () requirement applied as the instantaneous luminosity of the LHC increased. The bulk (76%) of the integrated luminosity used in the analysis was obtained with the L1 calorimeter trigger configured with an energy threshold of approximately 15 GeV, with the remaining 14%, 9% and 1% recorded with 11, 6 and 3 GeV thresholds, respectively.
Simulated data samples have been generated in order to estimate backgrounds and correct for the trigger and reconstruction efficiencies and the resolution of the detector. PYTHIA 6.421 with the MRST LO* mrst2007lomod PDF set was used to simulate samples of electrons from heavy-flavour and // decays, and to simulate all sources of background electrons. All signal and background samples were generated at TeV using the ATLAS MC09 tune mc09Tune , and passed through the simulation of the ATLAS detector.
II ELECTRON SIGNAL EXTRACTION
Events from collisions are selected by requiring a collision vertex with more than two associated tracks. From these events, reconstructed electron candidates are required to pass a minimum cluster cut between 7 and 18 GeV depending on the trigger condition, to lie within the pseudorapidity coverage of the TRT, , and to be outside the transition region between the barrel and end-cap calorimeters.
Preselected candidates must be associated to tracks containing a minimum number of hits in the ID and are required to pass a minimum requirement on the fraction of the raw energy deposited in the first layer of the EM calorimeter. Candidate electrons are then selected from those passing the preselection by imposing further identification criteria Note designed to suppress electron-like (fake) signatures from hadrons.
The cluster transverse energy spectrum for the selected electron candidates in the data and simulation is shown in Fig. 1. The candidates in the simulation are sub-divided according to their dominant origins, which for GeV are non-isolated signal electrons from semi-leptonic decays of charm and beauty hadrons (10%), a background of secondary electrons dominated by electrons from photon conversions (20%) and the dominant background of misidentified hadronic fakes. The fraction of isolated signal electrons from // production is also shown.
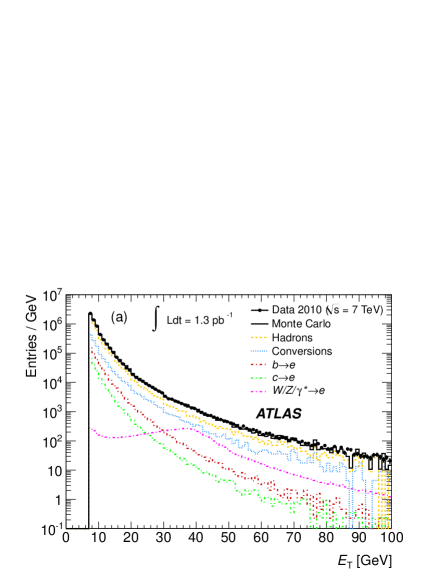 |
In order to extract the signal electrons from the selected candidates, a binned maximum likelihood method is used, based on the distributions of the fraction of high-threshold (transition radiation) TRT hits out of all TRT hits measured on the track, , the number of hits in the inner-most (B-layer) pixel detectors, and the ratio of the measured energy of the EM cluster to the track momentum, . From simulation, a three-dimensional probability density function (pdf) in these variables is constructed for the signal and conversion components. For the hadronic background, the shapes of the three template distributions are described by additional free parameters and are fitted to the data. The likelihood fit is performed in bins of (on which the discriminating distributions depend) and in bins of in the range 7-26 GeV.
The systematic uncertainty on the number of extracted signal electrons arising from the differences between the data and simulation in the discriminating variables for the signal and conversion components is estimated to be less than 4%, evaluated by repeating the signal extraction with the signal and conversion templates adjusted within their systematic uncertainties. The impact of the finite statistics of the simulated samples ( 2.5%) and any possible bias in the method (7.3%) were studied using pseudo-experiment techniques. The uncertainty associated with the electron energy scale (3.5%) has been assessed by varying the electron candidate cluster energy by 1% for and by 3% for , these systematic effects having been evaluated from events. Overall a statistical (systematic) uncertainty on the extracted signal component of approximately 3 (9) % is obtained.
III DIFFERENTIAL CROSS-SECTION MEASUREMENT
The measured differential cross-section for electrons originating from heavy flavour production within the fiducial acceptance is defined by
| (1) |
where is the number of extracted signal electrons with reconstructed in bin of width , is the integrated luminosity, is the trigger efficiency and the combined reconstruction and identification efficiency. is the bin migration correction factor, defined as the ratio of the number of electrons in bin of true and the number in the same bin of reconstructed . is the small and well understood accepted cross-section from // production firstWZ which must be subtracted from the total signal.
The efficiencies of the 3 and 6 GeV threshold L1 triggers are measured using events selected by an alternative, very inclusive minimum bias trigger, and the 11 and 15 GeV triggers using events recorded by the 6 GeV trigger, which is fully efficient in the region for which the higher threshold triggers are used. A systematic uncertainty is estimated by comparing the measured trigger efficiencies to those expected in the simulation for electrons from heavy-flavour decays.
The overall efficiency and migration correction factor, , is determined from PYTHIA-simulated samples of heavy-flavour decays to electrons. The statistical uncertainty is between 0.4 and 3.5% and a systematic uncertainty of 5-10% is estimated by recalculating from simulated samples produced with a 5% increase in the amount of material in the ID. Additionally, the efficiency of the electron identification cuts in the simulation is compared with a measurement made on data using a tag-and-probe (T&P) technique. The probe candidates, which must pass only the preselection cuts, are taken from a sample of events enriched in heavy quark pair production where both heavy hadrons decay semi-leptonically. The signal purity remains low after the T&P selection, necessitating a method similar to that described in Section 2 to extract the signal component of the probe candidates before and after applying the identification criteria. By comparing the measured identification efficiency of the extracted probe electrons to that expected in simulation as a function of , an uncertainty of 5% is obtained on the identification efficiency, with a further 7% systematic uncertainty coming from the T&P method itself.
The differential cross-section for electrons from heavy-flavour production obtained from Eqn. (1) is shown in Fig. 2.
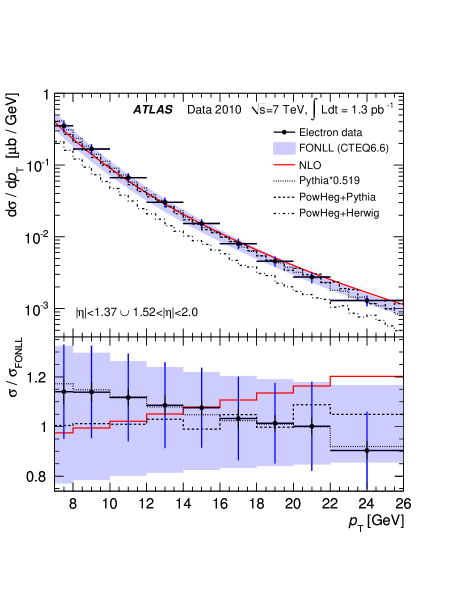
A comparison is made to the prediction of the FONLL theoretical framework, in which the heavy quark production cross-section is calculated in pQCD by matching the Fixed Order NLO terms with NLL high-pT resummation. The uncertainties associated with this prediction originate from several different sources. The dominant contribution comes from the renormalisation and factorisation scales (up to 35% at low ). The uncertainty on the heavy quark masses contributes up to 9% at low , and the PDF-related uncertainty (taken from the CTEQ6.6 error set) is below 8% over the whole range. Uncertainties arising from the value of and on the non-perturbative fragmentation function are small. The measured results are seen to be fully compatible with the overall 20-40% FONLL uncertainty band.
The results are also compared to the NLO predictions of the POWHEG Powheg1 ; Powheg3 program, interfaced to either PYTHIA or HERWIG herwig for the parton shower simulation, and to the sum of LO and parton shower predictions of PYTHIA. Whereas POWHEG+PYTHIA agrees well with the FONLL predictions, POWHEG+HERWIG predicts a significantly lower total cross-section. PYTHIA (LO) describes the -dependence well but predicts approximately a factor two higher total cross-section. The NLO expectation obtained from the FONLL program by removing NLL resummation from the pQCD calculation shows a clear deviation from the data, underlining the importance of the NLL corrections.
IV CONCLUSIONS
The differential cross-section of electrons arising from heavy-flavour production has been measured in the electron transverse momentum range 7 26 GeV and pseudorapidity region (excluding ) and is found to be in good agreement with the theoretical predictions for heavy-flavour production from the FONLL computation. Good agreement is also seen with the predictions of POWHEG+PYTHIA, although POWHEG+HERWIG predicts a significantly lower total cross-section. PYTHIA describes the -dependence well, but overestimates the total cross-section by approximately a factor of two.
V Acknowledgments
We thank M. Cacciari for supplying the predictions from FONLL and for many useful discussions.
References
- (1) ATLAS Collaboration, arXiv:1109:0525 [hep-ex], submitted to Phys. Lett. B (2011)
- (2) ATLAS Collaboration, JINST, 3, S08003 (2008)
- (3) ATLAS Collaboration, arXiv:1110:3174 [hep-ex], submitted to Eur. Phys. J. C (2011)
- (4) A. Sherstnev and R.S. Thorne, Eur. Phys. J., C55, 553-575 (2008)
- (5) ATLAS Collaboration, ATL-PHYS-PUB-2010-002 http://cdsweb.cern.ch/record/1247375 (2010)
- (6) ATLAS Collaboration, JHEP, 12, 060 (2010)
- (7) S. Frixione, P. Nason, C. Oleari, JHEP, 11, 070 (2007)
- (8) S. Alioli, P. Nason, C. Oleari and E. Re, JHEP, 6, 043 (2010)
- (9) G. Corcella, I.G. Knowles, G. Marchesini, S. Moretti, K. Odagiri, P. Richardson, M.H. Seymour and B.R. Webber, JHEP, 01, 010 (2001)