Recurrent dust formation by WR 48a on a 30-year timescale††thanks: Based on observations collected at the European Southern Observatory, La Silla, Chile, the South African Astronomical Observatory, Sutherland, South Africa, and the Anglo Australian Telescope, Siding Spring, Australia.
Abstract
We present infrared photometry of the WC8 Wolf-Rayet system WR 48a observed with telescopes at ESO, the SAAO and the AAT between 1982 and 2011 which show a slow decline in dust emission from the previously reported outburst in 1978–79 until about 1997, when significant dust emission was still evident. This was followed by a slow rise, accelerating to reach and overtake the first (1978) photometry, demonstrating that the outburst observed in 1978–79 was not an isolated event, but that they recur at intervals of 32+ years. This suggests that WR 48a is a long-period dust maker and colliding-wind binary (CWB). The locus of WR 48a in the (), colour-magnitude diagram implies that the rate of dust formation fell between 1979 and about 1997 and then increased steadily until 2011. Superimposed on the long-term variation are secondary (‘mini’) eruptions in (at least) 1990, 1994, 1997, 1999 and 2004, characteristic of relatively brief episodes of additional dust formation. Spectra show evidence for an Oe or Be companion to the WC8 star, supporting the suggestion that WR 48a is a binary system and indicating a system luminosity consistent with the association of WR 48a and the young star clusters Danks 1 and Danks 2. The range of dust formation suggests that these stars are in an elliptical orbit having . The size of the orbit implied by the minimum period, together with the WC wind velocity and likely mass-loss rate, implies that the post-shock WC wind is adiabatic throughout the orbit – at odds with the observed dust formation. A similar conflict is observed in the ‘pinwheel’ dust-maker WR 112.
keywords:
stars: Wolf-Rayet — stars: circumstellar matter — stars: binary — stars: individual: WR 48a — stars: individual: WR 1121 Introduction
Population I Wolf-Rayet (WR) stars are characterised by dense, fast stellar winds giving the stars their broad emission-line spectra and carrying heavy mass loss: they represent the last stable stage in the evolution of massive stars. One of the earliest results from infrared (IR) astronomy was the discovery of ‘excess’ radiation by heated circumstellar dust from a variety of stars known to be losing mass. Amongst these were three WC9 type WR stars, observed by Allen, Harvey & Swings (1972). Subsequent studies (e.g. Cohen, Barlow & Kuhi 1975) found circumstellar dust emission from most WC9 and many WC8 stars. The process was soon inverted, and bright IR sources discovered in space- or ground-based IR surveys were found to harbour optically faint dusty WC8–9 stars (e.g. AFGL 2104 = WR 112, Cohen & Kuhi 1977). Amongst these was WR 48a, discovered by Danks et al. (1983, hereafter DDWS) in a survey of the H ii region G305.5 +0.0. They observed WR 48a to be undergoing an infrared outburst similar to that shown in 1977 by HD 193793 (Williams et al. 1978, Hackwell, Gehrz & Grasdalen 1979). DDWS tracked the rise of the IR emission to maximum in 1979 and its initial fading, and presented a spectrum showing He and C emission lines, most conspicuously He i 10830Å and C iii 9710Å, from which they classified WR 48a as a WC9 star.
In their survey of IR dust emission by late subtype WC stars, Williams, van der Hucht & Thé (1987a, hereafter WHT), reported photometry of WR 48a in 1982–86 which showed continuing fading of its dust emission. They also extended the spectroscopy to the yellow (5550–5950Å), and argued from the approximately equal intensities in the C iii 5696-Å and C iv 5808-Å classification lines that WR 48a was a WC8 star. Further IR photometry of WR 48a was reported by Williams et al. (2003, hereafter Paper I), showing that the fading continued to about 1997, but that the spectral energy distribution (SED) at that time still showed dust emission, indicating that dust was still being formed by WR 48a. In this respect it differed from ‘episodic’ dust makers like HD 193793 (WR 140), which form dust for only a fraction of their periods (Williams et al. 1990). The IR photometry of WR 48a also showed secondary dust-formation episodes, ‘mini eruptions’, in 1990 and 1994. These resembled those observed by Williams et al. (2001) in another episodic dust maker, the WC7+O9 system WR 137 (HD 192641). In Paper I, the 2.4–25-m SED of WR 48a observed with the short-wavelength spectrometer (SWS) on ISO in a survey of WR spectra (van der Hucht et al. 1996) was compared with that of WR 104 (Ve2–45), the classical dust-making WC9 star, and found to be significantly cooler. This difference was consistent with the radial dust density distribution around WR 48a being flatter than the law expected of a system making dust at a constant rate like WR 104: the evolution of the dust density distribution of WR 48a is considered further in Section 3.4. The ISO-SWS spectrum of WR 48a presented in Paper I showed an emission feature near 7.7 m similar to that observed in WR 104 and WR 112 by Cohen, Tielens & Bregman (1989) and ascribed to a carbonaceous carrier with small aromatic domains, a possible precurson to carbon grains; an independent study of the SWS spectrum by Chiar, Peeters & Tielens (2002) identified and discussed emission features at 6.4m and 7.9m.
The enduring interest of dust formation by WR stars is the great difficulty in forming dust in such hostile environments: close to the stars, the stellar radiation fields would heat any dust to above its evaporation temperature but at greater distances, where the radiation field is sufficiently diluted, the density of the WR stellar wind is too low to allow homonuclear dust condensations – as recognised early on by Hackwell et. al. (1979) in the case of WR 140 and discussed by WHT for the WC8–9 stars making dust persistently. Zubko (1998) found that carbon grains having drift velocities relative to the WC8–9 wind could grow via collision with carbon ions, but the question of grain nucleation remains open. A chemical kinetic study of the formation of molecular species and carbon grain precursors in WC9 winds by Cherchneff et al. (2000) found that only C2 was formed in useful amounts, and even that required significantly (factor ) higher densities than expected in the regions of isotropic, smooth WR winds where dust grains are observed. Understanding the physicochemical process of dust formation by WR stars appears to have stalled, but the incidence of observed dust formation by WR stars in different systems provides valuable information on the origin of the significantly higher densities demanded.
Large-scale, high-density structures in a WR wind are provided by compression of the stellar wind in strong shocks formed where the wind of a WR star collides with that of a sufficiently luminous companion in a binary system – a colliding wind binary (CWB) – as occurs in WR 140. Usov (1991) suggested that very high compression factors () could be produced in WR 140 if the heated and compressed wind was able to cool efficiently. The link between the dust-formation episodes and binary orbit in WR 140 is provided by the periodic increases by factor of 40 of the pre-shock wind density at the wind-collision region (WCR) for a brief time around periastron passage (Williams 1999) in its very elliptical orbit. Similarly, Lefèvre et al. (2005) showed that the episodic dust-maker WR 137 was a spectroscopic binary having a period (13.05 yr) equal to that of the dust-formation episodes (Williams et al. 2001), with periastron passage about a year before maximum dust emission. More recently, Williams, Rauw & van der Hucht (2009a) showed that the radial velocities of the WC5+O9 system WR 19 were consistent with its being a high-eccentricity () binary, having periastron passage shortly before its brief, periodic (10.1-yr) dust-formation episodes.
The connection between the persistent dust-formation by the WC9 stars and their movement in binary orbits comes from IR images of the dust, which show rotating ‘pinwheel’ structures around WR 104, WR 98a (IRAS 17380–3031) and WR 112, interpreted to be dust formed and ejected in a stream to one side of a rotating binary system observed at a relatively low orbital inclination (Tuthill, Monnier & Danchi 1999, Monnier, Tuthill, & Danchi 1999, and Monnier et al. 2007). The observation of non-thermal radio emission from the ‘pinwheel’ systems (Monnier et al. 2002) provides further support for their being CWBs; but their stellar components have not yet been resolved, so that it has not been possible to relate the positions of the stars and WCRs to that of the dust.
Monnier et al. (2007) found the dust emission by WR 48a to be extended at 2m; and the dust cloud was imaged at 12.3m by Marchenko & Moffat (2007), showing the dust emission to be extended E–W, suggesting a flattened structure, possibly a fragmentary spiral, seen at moderately high inclination.
DDWS and Danks et al. (1984) associated WR 48a with two newly discovered galactic clusters, Danks 1 (C 1310–624) and Danks 2 (C 1309–624) at a distance between 3.3 and 4.6 kpc. Bica et al. (2004) derived colour-magnitude diagrams from deeper photometry and derived distances to the clusters of and kpc respectively. The connection between WR 48a and the clusters was reinforced by Clark & Porter (2004) in their study of star formation in the region. They suggested that star formation might have been triggered by WR 48a and adopted a distance of 4 kpc for the complex. This gives a greater distance to WR 48a than that (1.2 kpc, van der Hucht 2001) implied by its spectral type, and these estimates need to be reconciled.
By all accounts, WR 48a is heavily reddened, but the exact value is not certain. DDWS derived A 9.2 from the 7000–10000-Å colour in their spectrum. Williams, van der Hucht & Thé (1987b) derived A from the 5000–7000-Å slope in their spectrum observed in 1986, and noted that this was consistent with the strength of the 6284-Å diffuse interstellar absorption band (DIB) and the relation between these quantities from other reddened stars. From the SWS spectrum of WR 48a, Schutte et al. (1998) found the interstellar ‘silicate’ feature to have . The ratio of visual extinction to ‘silicate’ optical depth in the spectra of WR stars and Cyg OB2 No. 12 showed significant scatter, . Applying this ratio to the observed in WR 48a gives . (A lower value, (6.1), was derived from in Paper I but this used a different and probably inappropriate calibration.) Baume, Carraro & Momany (2009) observed photometry in 2006, and derived . For a standard reddening law, this implies a lower extinction and, from their observed , an intrinsic , which is abnormally red for an early type star. If some of the extinction occurs in the carbon dust made by WR 48a, the extinction law may not be standard. For example, Menzies & Feast (1997) found an anomalous reddening law for the carbon dust made by the RCB star RY Sgr, so the sightline to WR 48a may have a reddening law intermediate between the standard interstellar and that for carbon dust. On the other hand, the circumstellar component of the reddening is unlikely to be very great, given the strength of the ‘silicate’ feature and the reddening to the associated clusters and respectively (Bica et al.). For the present, therefore, we adopt and a standard interstellar law for the reddening of WR 48a.
Zhekov, Gagné & Skinner (2011) have identified a strong, highly obscured X-ray source with WR 48a. They pointed out that, if WR 48a was physically associated with the clusters Danks 1 and Danks 2 at a distance of kpc, it would be the most X-ray luminous WR star in the Galaxy, after Cyg X-3. They also derived a high extinction, cm-2, from their NEI shock modelling of the X-ray spectrum and noted that this was consistent with using the standard conversion, cm-2; but could be 40-50% higher using more recent conversions. As one of several possible origins for the X-ray emission, they considered colliding stellar winds in a wide WR+O binary. As noted by Zhekov et al., and also Mauerhan, van Dyk & Morris (2011), WR 48a was detected with Chandra as a very strong X-ray source.
In this paper, we report almost three decades (1982–2011) of IR photometry tracking the emission by the dust cloud made by WR 48a and showing that the 1978–9 dust-formation was not an isolated event, but one which appears to be recurring after an interval of over 32 yrs. We present optical spectra which suggest that the WC8 star in WR 48a has an OB companion, apparently an Oe or Be star. We use the IR colours and simple modelling of the SEDs to describe the evolution of the dust cloud and develop a preliminary picture of WR 48a as a colliding-wind binary.
2 Observations
2.1 Infrared photometry
| Date | |||||
|---|---|---|---|---|---|
| 2445418 | 7.80 | 5.21 | 3.01 | 0.29 | -0.42 |
| 2445419 | 7.88 | 5.25 | 3.10 | 0.41 | -0.37 |
| 2445839 | 8.27 | 5.61 | 3.39 | 0.52 | -0.31 |
| 2446278 | 8.46 | 5.94 | 3.71 | 0.80 | 0.04 |
| 2446632 | 8.57 | 6.23 | 4.07 | 1.13 | 0.27 |
| 2446829 | 8.68 | 6.40 | 4.22 | 1.18 | 0.32 |
| 2446831 | 8.69 | 6.38 | 4.12 | 1.27 | 0.25 |
| 2447258 | 8.72 | 6.46 | 4.35 | 1.41 | 0.58 |
| 2447259 | 8.73 | 6.45 | 4.32 | 1.36 | 0.63 |
| 2447260 | 8.70 | 6.45 | 4.33 | 1.40 | 0.63 |
| 2447261 | 8.70 | 6.46 | 4.36 | 1.42 | 0.61 |
| 2447519 | 8.91 | 6.69 | 4.57 | 1.54 | 0.64 |
| 2447520 | 8.94 | 6.69 | 4.57 | 1.54 | 0.73 |
| 2447540 | 9.17 | 6.78 | 4.56 | 1.59 | 0.67 |
| 2447453 | 8.94 | 6.75 | 4.55 | 1.56 | 0.66 |
| 2447544 | 8.93 | 6.70 | 4.56 | 1.58 | 0.69 |
| 2447552 | 8.85 | 6.73 | 4.55 | 1.55 | 0.70 |
| 2447573 | 8.87 | 6.71 | 4.60 | 1.58 | 0.74 |
| 2447670 | 8.73 | 6.67 | 4.63 | 1.69 | 0.91 |
| 2447671 | 8.86 | 6.80 | 4.70 | 1.66 | 0.73 |
| 2447672 | 8.86 | 6.82 | 4.73 | 1.71 | 0.78 |
| 2447910 | 8.89 | 6.83 | 4.80 | 1.79 | 0.89 |
| 2447966 | 8.87 | 6.87 | 4.86 | 1.85 | 0.94 |
| 2447967 | 8.93 | 6.89 | 4.86 | 1.87 | 0.96 |
| 2447968 | 8.90 | 6.87 | 4.83 | 1.83 | 0.92 |
| 2447970 | 8.91 | 6.88 | 4.85 | 1.84 | 0.96 |
| 2447971 | 8.90 | 6.88 | 4.84 | 1.83 | 0.95 |
| 2447991 | 8.91 | 6.89 | 4.87 | 1.87 | 0.93 |
| 2447992 | 8.86 | 6.88 | 4.86 | 1.84 | 0.95 |
| 2447993 | 8.89 | 6.88 | 4.87 | 1.85 | 0.97 |
| 2448316 | 8.89 | 6.91 | 4.89 | 1.94 | 1.01: |
| 2448317 | 8.89 | 6.89 | 4.89 | 1.92 | 1.02 |
| 2448318 | 8.91 | 6.90 | 4.88 | 1.93 | 1.02 |
| 2448347* | 8.91 | 6.93 | 4.93 | 1.97 | 1.07 |
| 2448348 | 8.94 | 6.96 | 4.95 | 1.97 | 1.04 |
| 2448349 | 8.96 | 6.96 | 4.96 | 1.98 | 1.09 |
| 2448350 | 8.95 | 6.98 | 4.97 | 1.97 | 1.08 |
| 2448639 | 8.91 | 6.92 | 4.95 | 2.03 | 1.16 |
| 2448698 | 8.96 | 7.02 | 5.04 | 2.08 | 1.14 |
| 2448749 | 8.98 | 7.07 | 5.10 | 2.11 | 1.21 |
| 2448752 | 9.00 | 7.07 | 5.10 | 2.12 | 1.20 |
| 2448753 | 8.92 | 7.05 | 5.09 | 2.12 | 1.21 |
| 2448799 | 9.16 | 7.14 | 5.13 | 2.13 | 1.20 |
| 2449050+ | 9.01 | 7.15 | 5.24 | 2.26 | 1.35 |
| 2449052+ | 8.98 | 7.14 | 5.24 | 2.26 | 1.35 |
| 2449179 | 8.97 | 7.09 | 5.20 | 2.29 | |
| 2449180 | 8.96 | 7.10 | 5.21 | 2.30 | 1.37 |
| 2449181 | 8.94 | 7.11 | 5.22 | 2.31 | 1.38 |
| 2449182 | 8.92 | 7.11 | 5.23 | 2.32 | 1.39 |
| 2449183 | 8.96 | 7.11 | 5.22 | 2.31 | 1.36 |
| 2450198+ | 7.11 | 5.37 | 2.49 | 1.61 | |
| 2450890+ | 9.07 | 7.12 | 5.20 | 2.54 | 1.78 |
| Date | Tel. | ||||||
|---|---|---|---|---|---|---|---|
| 2445150 | 0.08 | -0.67 | -1.6 | -1.4 | -1.9 | -1.7 | 3.6m |
| 2445425 | 0.29 | -0.46 | -1.4 | -1.3 | -1.6 | -1.5 | 3.6m |
| 2446194 | 0.86 | -0.03 | -1.3 | -1.1 | -1.7 | 3.6m | |
| 2447519 | 1.54 | 0.73 | -0.9 | -0.5 | -1.4 | 1.0m | |
| 2447987 | 1.81 | 0.80 | -0.8 | -0.6 | -1.2 | -1.2 | 2.2m |
| 2447988 | 1.88 | 0.91 | -0.7 | -0.5 | -1.3 | -1.3 | 2.2m |
| 2448346 | 1.95 | 1.10 | -0.6 | -0.4 | -1.1 | -1.2 | 3.6m |
| 2448347 | 1.96 | 1.09 | -0.6 | -0.3 | -1.1 | -1.1 | 3.6m |
| Date | ||||
|---|---|---|---|---|
| 2445417 | 7.78 | 5.19 | 3.05 | 0.65 |
| 2447547 | 8.38 | 6.50 | 4.50 | 1.98 |
| 2447553 | 8.34 | 6.49 | 4.57 | 1.98 |
| 2447607 | 8.34 | 6.55 | 4.57 | 2.00 |
| 2447634 | 8.42 | 6.64 | 4.63 | 2.11 |
| 2447669 | 8.39 | 6.59 | 4.62 | 2.08 |
| 2447687 | 8.43 | 6.63 | 4.63 | 2.08 |
| 2447737 | 8.42 | 6.65 | 4.67 | 2.17 |
| 2448028 | 8.36 | 6.66 | 4.77 | 2.24 |
| 2448108 | 8.31 | 6.46 | 4.61 | 2.30 |
| 2448285 | 8.40 | 6.87 | 4.78 | 2.29 |
| 2448289 | 8.42 | 6.70 | 4.78 | 2.31 |
| 2448327 | 8.41 | 6.73 | 4.82 | 2.34 |
| 2448365 | 8.43 | 6.76 | 4.87 | 2.35 |
| 2448378 | 8.38 | 6.73 | 4.85 | 2.41 |
| 2448385 | 8.41 | 6.76 | 4.87 | 2.35 |
| 2448427 | 8.42 | 6.74 | 4.88 | 2.42 |
| 2448437 | 8.41 | 6.74 | 4.89 | 2.41 |
| 2448451 | 8.40 | 6.73 | 4.86 | 2.39 |
| 2448457 | 8.41 | 6.71 | 4.85 | 2.39 |
| 2448462 | 8.40 | 6.72 | 4.85 | 2.38 |
| 2448500 | 8.33 | 6.62 | 4.78 | 2.37 |
| 2448701* | 8.47 | 6.80 | 4.96 | 2.48 |
| 2448734* | 8.54 | 6.83 | 4.98 | 2.51 |
| 2448760* | 8.44 | 6.83 | 5.00 | 2.51 |
| 2448783 | 8.40 | 6.82 | 5.00 | 2.52 |
| 2448792 | 8.46 | 6.85 | 5.01 | 2.54 |
| 2448817 | 8.45 | 6.86 | 5.03 | 2.56 |
| 2448851 | 8.51 | 6.90 | 5.07 | 2.63 |
| 2449001 | 8.48 | 6.94 | 5.11 | 2.60 |
| 2449106 | 8.52 | 6.91 | 5.14 | 2.68 |
| 2449146 | 8.42 | 6.87 | 5.12 | 2.69 |
| 2449221 | 8.44 | 6.90 | 5.14 | 2.75 |
| Date | ||||
|---|---|---|---|---|
| 2449382 | 8.56 | 6.97 | 5.23 | 2.79 |
| 2449406 | 8.46 | 6.86 | 5.14 | 2.77 |
| 2449501 | 8.35 | 6.62 | 4.91 | 2.68 |
| 2449519 | 8.28 | 6.55 | 4.85 | 2.67 |
| 2449583 | 8.32 | 6.58 | 4.84 | 2.62 |
| 2449590 | 8.34 | 6.59 | 4.84 | 2.59 |
| 2449735 | 8.43 | 6.75 | 4.96 | 2.61 |
| 2449820 | 8.46 | 6.79 | 4.98 | 2.68 |
| 2449887 | 8.46 | 6.85 | 5.04 | 2.68 |
| 2450091 | 8.47 | 6.91 | 5.13 | 2.76 |
| 2450127 | 8.44 | 6.89 | 5.13 | 2.77 |
| 2450178 | 8.45 | 6.95 | 5.21 | 2.75 |
| 2450206 | 8.42 | 6.95 | 5.20 | 2.83 |
| 2450237 | 8.47 | 6.95 | 5.22 | 2.86 |
| 2450259 | 8.49 | 6.95 | 5.23 | 2.90 |
| 2450320 | 8.48 | 6.99 | 5.28 | 2.90 |
| 2450484 | 8.46 | 7.02 | 5.32 | 2.90 |
| 2450591 | 8.46 | 7.07 | 5.44 | 3.03 |
| 2450618 | 8.52 | 7.06 | 5.43 | 3.07 |
| 2450798 | 8.41 | 6.82 | 5.12 | 2.89 |
| 2450980 | 8.44 | 6.92 | 5.23 | 2.98 |
| 2451234 | 8.40 | 6.83 | 5.14 | 2.92 |
| 2451298 | 8.46 | 6.93 | 5.23 | 2.94 |
| 2451358 | 8.45 | 6.93 | 5.21 | 2.99 |
| 2451576 | 8.34 | 6.68 | 5.02 | 2.89 |
| 2451614 | 8.39 | 6.71 | 4.99 | 2.86 |
| 2451677 | 8.42 | 6.75 | 5.02 | 2.86 |
| 2451685 | 8.45 | 6.77 | 5.02 | 2.87 |
| 2451715 | 8.42 | 6.79 | 5.05 | 2.84 |
| 2451743 | 8.43 | 6.82 | 5.06 | 2.86 |
| 2451785 | 8.44 | 6.84 | 5.08 | 2.88 |
| 2451967 | 8.42 | 6.86 | 5.14 | 2.93 |
| Date | ||||
|---|---|---|---|---|
| 2451981 | 8.42 | 6.86 | 5.14 | 2.89 |
| 2452070 | 8.40 | 6.78 | 5.06 | 2.90 |
| 2452093 | 8.41 | 6.79 | 5.06 | 2.87 |
| 2452116 | 8.45 | 6.80 | 5.07 | 2.88 |
| 2452290 | 8.52 | 6.85 | 5.10 | 2.90 |
| 2452322 | 8.41 | 6.81 | 5.08 | 2.91 |
| 2452351 | 8.41 | 6.84 | 5.12 | 2.90 |
| 2452383 | 8.42 | 6.80 | 5.11 | 2.94 |
| 2452426 | 8.36 | 6.75 | 5.07 | 2.93 |
| 2452451 | 8.38 | 6.74 | 5.05 | 2.91 |
| 2452694 | 8.44 | 6.87 | 5.18 | 2.97 |
| 2452755 | 8.36 | 6.72 | 5.03 | 2.92 |
| 2452798 | 8.55 | 6.82 | 5.05 | 2.94 |
| 2452868 | 8.38 | 6.68 | 4.97 | 2.86 |
| 2453065 | 8.41 | 6.72 | 4.92 | 2.76 |
| 2453118 | 8.36 | 6.66 | 4.90 | 2.74 |
| 2453177 | 8.22 | 6.42 | 4.70 | 2.61 |
| 2453194 | 8.24 | 6.39 | 4.66 | 2.60 |
| 2453408 | 8.26 | 6.37 | 4.54 | 2.43 |
| 2453442 | 8.31 | 6.42 | 4.55 | 2.42 |
| 2453507 | 8.30 | 6.43 | 4.60 | 2.43 |
| 2453562 | 8.28 | 6.38 | 4.55 | 2.45 |
| 2453906 | 8.19 | 6.05 | 4.19 | 2.14 |
| 2453935 | 8.13 | 6.06 | 4.20 | 2.13 |
| 2454184 | 7.99 | 5.77 | 3.88 | 1.84 |
| 2454234 | 7.93 | 5.70 | 3.81 | 1.75 |
| 2455011 | 7.52 | 5.04 | 3.16 | 1.08 |
| 2455353 | 7.56 | 4.90 | 2.99 | 0.99 |
| 2455621 | 7.21 | 4.71 | 2.86 | 0.82 |
| 2455642 | 7.25 | 4.75 | 2.92 | 0.99 |
| 2455731 | 7.26 | 4.73 | 2.84 | 0.77 |
| 2455733 | 7.24 | 4.72 | 2.85 | 0.77 |
Photometry of WR 48a was obtained using aperture photometers on the 1-m, 2.2-m and 3.6-m telescopes of the European Southern Observatory (ESO) at La Silla, Chile, (Tables 1 and 2), the Mk II photometer on 0.75-m telescope of the South African Astronomical Observatory (SAAO), Sutherland, South Africa (Table 3), and the Infrared Photometer/Spectrometer (IRPS) on the Anglo-Australian Telescope (AAT) at Siding Spring, Australia (Table 4). The final two observations in Table 1 were obtained with the array camera IRAC-1 on the 2.2-m telescope at La Silla.
During our campaign, the near-infrared (NIR) photometric systems on the three ESO telescopes were the same, and as described by Bouchet, Manfroid & Schmider (1991) and Bersanelli, Bouchet & Falomo (1991). The final (‘Postscript’) photometry by DDWS was on this system, whereas that in the body of their paper was on the earlier ESO system (Wamsteker 1981), which differed principally in using a filter having 3.5–3.6 m instead of 3.8 m for . The 3.8-m filter is often called ‘’ to distinguish it from the shorter-wavelength , a convention we follow here. The SAAO photometry (Carter 1990) uses a shorter-wavelength (m) filter. The NIR system at the AAT (Allen & Cragg 1983) also used a 3.8-m filter for , but their filter had a slightly shorter than the ESO filter and closer to that of the filter in the SAAO Mk II photometer (see Glass 1993).
Observations of WR 48a can be affected by the nearby 11th magnitude star CPD -62 3058. From HST WFPC2 images, Wallace et al. (2003) measured a separation and position angle , placing it within or near the edges of some of the apertures used for the photometry of WR 48a. To determine the effect of this contribution on the photometry, we observed CPD -62 3058 with IRIS on the AAT through a 5 aperture and give the results, together with magnitudes from the DENIS (Epchtein et al. 1999) and 2MASS (Skrutskie et al. 2006) surveys, in Table 5. Despite the scatter in the data, we assume that the CPD star is not significantly variable in the NIR. In the band, the CPD star is 0.2 mag. fainter than WR 48a at its minimum (2.4 mag. at maximum) and so makes a significant contribution to the magnitudes observed with the SAAO 0.75-m telescope, which used 36 or, occasionally, 24 apertures (see Table 3). This contribution is much smaller at longer wavelengths, with differences (WR 48a minus CPD star) in the ranges mag., mag., and mag. corresponding to minima and maxima in WR 48a. The AAT photometry used apertures of 5 or 6 and that with the ESO 3.6-m telescope used a aperture, so the CPD star should have been well excluded. Depending on the seeing and centring, there might have been some contamination of observations with the ESO 1-m and 2.2-m photometers, which generally used 15 and 12 apertures. We searched for this by comparing the dispersion in the magnitudes when WR 48a was observed on successive nights in an observing run (Table 1) with the dispersion in , where any contamination by the CPD star would be at least a factor of 20 smaller, but found no significantly greater dispersion in .
| Date | |||||
|---|---|---|---|---|---|
| 2446309 | 8.61 | 5.94 | 3.73 | 1.00 | -0.11 |
| 2446595 | 8.88 | 6.17 | 4.00 | 1.11 | |
| 2446716 | 8.98 | 6.28 | 4.07 | 1.18 | |
| 2446888 | 8.76 | 6.40 | 4.26 | 1.31 | |
| 2447614 | 8.97 | 6.77 | 4.70 | 1.71 |
| Date | source | |||||
|---|---|---|---|---|---|---|
| 2446888 | 9.48 | 9.20 | 8.99 | AAT | ||
| 2447614 | 9.39 | 9.13 | 8.97 | 8.53 | AAT | |
| 2450501 | 9.33 | 8.86 | DENIS | |||
| 2450973 | 9.28 | DENIS | ||||
| 2451595 | 9.30 | 9.13 | 8.90 | 2MASS |
2.2 Homogenizing the NIR photometry
| System | 3.5 | 3.6 | 3.8 | ||
|---|---|---|---|---|---|
| AAT | -0.02 | -0.01 | -0.03 | ||
| pre-1982 ESO | -0.03 | -0.01 | 0.04 | ||
| post-1982 ESO | -0.06 | -0.03 | -0.01 | ||
| SAAO | 0.00 | 0.00 | 0.00 | ||
| adjustments | 0.00 | 0.18 | 0.38 |
In order to determine the evolution of the dust emission by WR 48a from the IR photometry, it is necessary to consider the relations between the different systems. The zero points of the systems are fairly similar (Table 6, compiled from Cohen et al. 1999) but the redness of WR 48a compared with the photometric standards is more of a problem. Bouchet et al. (1991), Carter (1990), and Allen & Cragg (1983) all derive colour transforms between their and other NIR photometric systems, none of these extend to objects as red as WR 48a: most comparisons are based on stars having () 1.1, whereas WR 48a generally has () . We therefore estimated ad hoc transformations for WR 48a, concentrating on the various and systems, as the filters for these have very different wavelengths. We relate the AAT and two sets of ESO photometry to the corrected SAAO data as the last forms the largest homogeneous dataset.
To relate the post-1982 ESO photometry of WR 48a to the corrected SAAO photometry, we compared contemporaneous observations, i.e., those made within about 0.02 yr of each other, sometimes using successive observations at one observatory to bracket those made at the other and avoiding times when WR 48a appeared to be changing rapidly. This gave eight useful comparisons between 1983 and 1993, yielding differences in the sense SAAO minus ESO: , , and , while the ESO () colour of WR 48a was in the range 4.8–3.9. The difference is much greater than that found by Bouchet et al. (1991) for stars having ()1.0, but not surprising given the difference between the two filters and the extreme redness of WR 48a. Attempts to derive a colour equation, such as a linear fit of the differences to (), did not yield statistically significant coefficients, so we restricted ourselves to applying a constant difference, , to our ESO photometry (and to the final, 1982, observation by DDWS) of WR 48a to bring the data into line with the SAAO photometry for the production of homogeneous light and colour curves.
For the earlier ESO photometry of WR 48a in DDWS, we do not have contemporaneous SAAO observations for direct comparison. Instead, we used the photometry of WR stars by Pitault et al. (1983), which was also on the older ESO system and included two dust-emitting WC9 stars having () comparable to that of WR 48a as an intermediate step. Comparison of their photometry of WR 104 and WR 106 with observations of these stars by WHT, which was on the post-1982 ESO system, suggests an offset –= 0.20. This is about half the difference between and the SAAO , as one might expect from the fact that the efective wavelength of the older ESO filter lies between those of and the SAAO . To convert DDWS magnitudes of WR 48a to the SAAO scale, we therefore added 0.18 mag., and made no adjustments to or .
Four of the AAT observations of WR 48a are contemporaneous with observations at ESO or SAAO, from which we infer an offset –= 0.34, comparable to that for the ESO photometry, as one might expect from the similarity of the filter wavelengths. Inspection of the AAT and data suggests that there is no significant shift between them and the ESO data.
We applied these differences to the AAT and the two sets of ESO photometry and combined them with the corrected SAAO photometry to produce a homogeneous photometry set in . The light curves from these data and the mid-IR photometry in Table 2 are discussed below, and the trajectory in the near-IR colour-magnitude diagram is discussed in Section 3.2. The adjusted magnitudes are not used for production of the SEDs in Sections 3.3 and 3.4 where the calibrated fluxes are entered at their respective wavelengths.
2.3 Optical spectroscopy
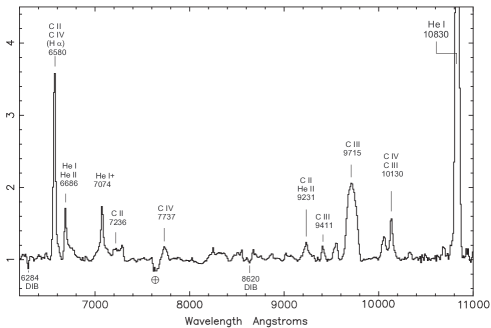
New spectra were observed for us with the RGO spectrograph on the Anglo Australian Telescope on 1993 June 21, when the NIR emission had faded about 2.5 mag. from maximum (cf. Fig 3). In the blue, the resolution was 7.4Å while that in the red, observed simultaneously, was 18Å. A spectrum of the metal-poor star HD 184711 observed on the same night was used to help with removal of telluric absorption features in the red. Rectified spectra are shown in the first two panels of Fig. 1. The correction for the strong telluric absorption in the A band (7630Å) was incomplete because HD 184711 was observed at a rather lower airmass than WR 48a.
The ‘red’ spectrum resembles that in DDWS, but the emission lines appear more strongly. We measured equivalent widths (EWs) of the strong He i 10830-Å and C iii 9715-Å lines to be 280Å and 118Å respectively, compared with EWs of 63Å and 46Å estimated from fig. 3 of DDWS. Taken at face value, these differences suggest that, at the time (1980 January) DDWS’s spectrum was observed, these emission lines were diluted by additional contimuum emission of factors 1.6 – 3.4 above the stellar continuum between 9715Å and 10830Å possibly by the newly formed dust, which is considered below.
The 10830-Å emission line falls close to the blue edge of the filter and line emission can contribute to the magnitudes. For example, the transmission of the filter in the SAAO Mk II IR photometer (Glass 1993) is about 50% maximum at this wavelength while that of the post-1982 ESO filter (Bersanelli et al.) is nearer 20%. The other optical components and the atmosphere will reduce these percentages. The corresponding contributions of the 10830-Å line to magnitudes observed with the Mk II photometer at the times of the 1980 and 1993 spectra would then be 0.01 and 0.05 mag. for a flat continuum across the -filter passband, and somewhat less for a rising dust continuum, while the contributions to the ESO magnitudes would be about half these values. We did not adjust photometry en masse but did adjust the SAAO magnitude used for the SED near minimum (Section 3.3) for the 10830-Å line contribution.
We were not able to measure a P Cygni absorption component of the 10830-Å line, but its FWZI of 90 Å allows us to estimate the wind velocity to be km s-1. This is lower than the average (1700 km s-2) for WC8 stars (van der Hucht 2001, table 27) and equal to that for WC9 stars. This line needs to be re-observed at higher resolution and higher S/N ratio to to refine our measurement. (The broad C iii feature at 9715Å is a multiplet with components ranging 9704–9720Å.)
We measured the 6284-Å diffuse interstellar band to have an EW of 3.1 Å, comparable to the value (2.8Å) in the 1986 spectrum, observed when the dust emission was greater (Williams, van der Hucht & Thé 1987b) , so it is unlikely that this feature has a circumstellar component.
After the 10830-Å line, the strongest emission line is that at 6570Å (EW 73Å). This is much stronger than the C iii 9715-Å feature, whereas it is weaker than the C iii lines in the spectra of the WC8+O9 systems WR 11 ( Vel) and WR 70 presented by Vreux, Dennefeld & Andrillat (1983), and significantly weaker in the single WC8 star in their sample, WR 53 (since reclassified WC9 by Crowther, de Marco & Barlow 1998). The identification of the 6570-Å feature is difficult. DDWS identified it with 6560 He ii (Hu), but we consider any contribution of He ii – which we cannot rule out given the resolution of the spectrum – to be small, because of the weakness or absence of the Hu line at 10124Å. There may be a small Hu contribution to the C iii-iv feature at 10130Å, but the Hu line would be even smaller. Another contributor to the 6570Å feature is multiplet 2 of C ii. The spectra of WR 11, WR 53 and WR 70 (Vreux et al.) suggest that the strength of this should be comparable (within a factor of 2) to that of multiplet 3 of C ii at 7236Å; but the 6570-Å line is a factor of about 16x stronger in our spectrum of WR 48a, so C ii cannot be the dominant contributor. Another possible contributor to the 6570Å feature in low-resolution spectra of WR 48a is the C iv line at 6592Å. This line accounts for the rising ratio of the 6570Å and 7236Å C ii lines in the spectra of earlier subtype WC stars (cf. Vreux et al.), but nowhere is the ratio as high as it is observed in WR 48a – nor are the other C iv lines in our spectrum found to be anomalously strong. No other plausible WC8 lines seem capable of explaining the strength of the 6570Å feature. We suggest it comes from H, either from a nebula very close to the star (not resolved in the long-slit spectrum) or from an Oe or Be stellar companion to the WC star.
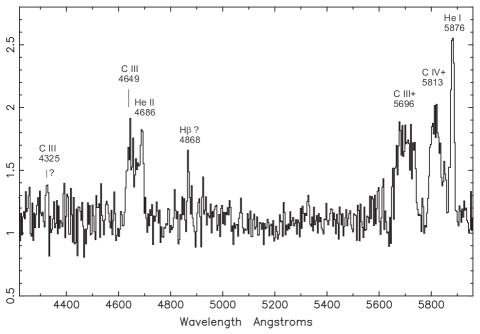
Owing to the heavy reddening of WR 48a, the blue spectrum is very noisy at short wavelengths, and only that longward of 4200Å is considered useful. The only convincing feature in the blue is the blend of C iii 4649Å and He ii 4686Å. This is very weak, having an equivalent width (EW) of 36Å, compared with the EW of 410Å of the same feature measured from the low-resolution spectrum of the single WC8 star WR 135 observed by Torres & Massey (1987). There is a possible feature at the position of the 4325-Å C iii line and a stronger, narrow line at 4868 Å which might be H emission from the proposed companion.
The spectrum in the yellow is similar to that observed in 1986 (WHT). Compared with the WC8 spectra in Torres & Massey, the He i 5896-Å line in WR 48a appears abnormally strong relative to the C iii and C iv lines. This is not a question of the classification of WR 48a: the WC9 spectra in Torres & Massey have the He i comparable in strength to the C iv line but much weaker than C iii. The carbon lines are much weaker: the EWs of the 5696-Å and 5813-Å features in WR 48a are 49 Å and 41 Å repectively, one quarter their values in WR 135 (197 Å and 185 Å respectively).
We take relative weakness of the C iii and C iv lines as evidence for their dilution, in this wavelength region, by the proposed stellar companion. Taking the ratios of 5696-Å and 5813-Å lines in WR 48a and the WC8 standard WR 135, the companion would be (1.2 mag.) brighter than the WC8 star in and the total luminosity (1.5 mag.) brighter. If the WC8 star had (cf. for WC8 stars in clusters and associations, van der Hucht 2001), the companion would have , comparable to that of an O6V star (Martins, Schaerer & Hillier 2005), and the system would have . At 4 pc, this would be which, reddening by , would give , close to the observed by Baume et al. and potentially resolving the discrepancy between the spectroscopic distance to WR 48a and that of the clusters. Fitting the observed magnitude and retaining the adopted distance and reddening would give O5V for the companion and for the WC8 star, still within the range for its spectral type. The total luminosity of the WR 48a system would be , which matches that found by Clark & Porter (2004).
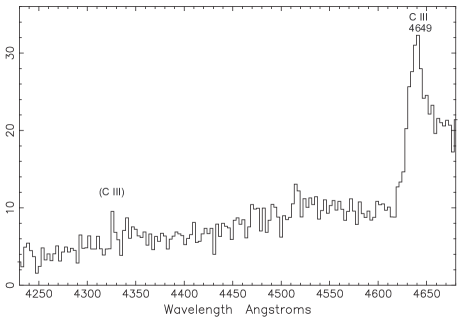
In an attempt to classify the companion, we re-observed WR 48a in the blue using the ESO Multi-mode Instrument (EMMI) on the 3.6-m New Technology Telescope (NTT) at La Silla on 2001 June 17-19 to look for absorption lines. The spectrum in the bottom panel of Fig. 1 is blocked down to 3-Å bins to improve the S/N ratio. The C iii 4649-Å triplet is present about 50% stronger than in the low-resolution spectrum but we do not confirm the C iii 4325-Å line, nor do we see any evidence for emission at the position of C iv 4441Å usually seen more strongly in WC8 and still present in WC9 spectra. Evidently, the continuum from the companion is dominant in this wavelength region and it is disappointing not to observe absorption lines from it, apart from a possible weak line at the position of B, which may owe its weakness to partial infill by emission.
The formal classification of the WC star is clearly WC8 from the ratio of the C iii 5696-Å and C iv 5813-Å features but it appears to be atypical in terms of He i strength and wind velocity. Without the absorption lines, the companion cannot be classified, but estimates of its luminosity adopting a distance of 4 kpc and suggests an O5Ve star and gives for the WC8 star.
2.4 Infrared spectroscopy
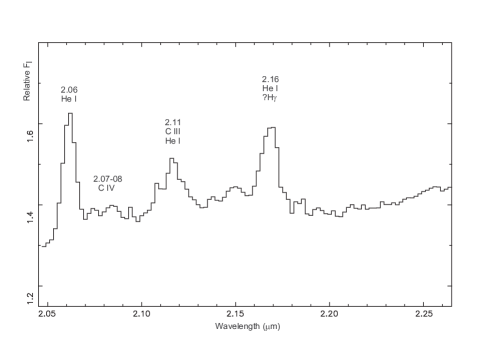
The infrared spectrum of WR 48a is dominated by dust emission, but it is still possible to see the line spectrum on top of this in the near IR. Low-resolution NIR spectra were observed for us using the InfraRed Imaging Spectrograph (IRIS) on the AAT on 1995 August 15. The echelle gave a spectral resolution of . The spectrum in the 2-micron region is shown in Fig. 2. Comparison with the spectra of WC8 and WC9 stars discussed by Eenens, Williams & Wade (1991) and Figer, McLean & Najarro (1997), particularly the relative strengths of the C iv triplet at 2.07-08 m and C iii/He i blend at 2.11 m shows that WR 48a is a closer match to the WC9 spectra than the WC8 star WR 135. Stronger than either of these features in WR 48a is the He i 2.06-m line, also strong in the WC9 stars WR 121 and WR 119 (cf. Figer et al.) but not WR 88 (cf. Eenens et al.). Of particular interest is the strength of the 2.16-m He i feature, which is stronger then the other lines in any of the WC8 or WC9 spectra in Eenens et al. and Figer et al. We suggest one possible reason for this is a contribution from Br from the companion to the WR star.
3 Evolution of the dust emission from WR 48a
3.1 Infrared light curves
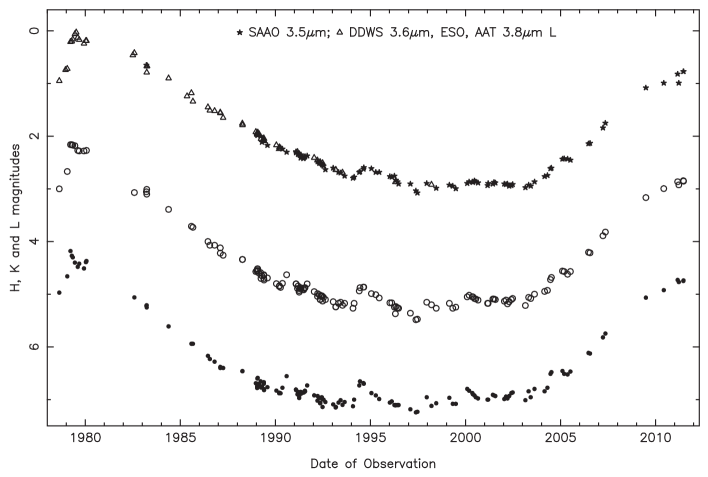
The light curves in , and from the homogenized NIR data are shown in Fig. 3. We see that the flux faded until about 1997, after which it grew very slowly until about 2003, and then began rising again. In it reached the level of DDWS’s first (1978) observation in 2010 and continued brightening, albeit more slowly.
Superimposed on the long-term variation are secondary episodes in 1990, 1994–5, 1999–2000, 2004 and perhaps 1997–8 and 2010–11. The best defined is that in 1994–95. From 1994.1, the flux rose to maximum in 1994.4 ( and ) to 1994.6 ( and ) and then gradually faded through 1995 and 1996. The rates of fading are strongly wavelength dependent ( 0.38 mag.y-1 in , 0.34 mag.y-1 in , 0.22 mag.y-1 in and 0.15 mag.y-1 in ) and the evolution of the IR colour (Section 3.2) is consistent with the formation and cooling of extra dust. Within the coverage of the observations, the other episodes have similar shapes: a steep rise for about 0.4 yr followed by a slower decline. Simple modelling of the SED of the epsiode is discussed in Section 3.4. To determine the timing of other episodes, we shifted the and light curves defining the 1994 mini outburst to those near the other events and used the best fits to measure the shifts to the other events, deriving –3.95 yr, +3.3 yr, +5.4 yr and +10.2 yr, giving intervals between the mini epsiodes of 3.95 yr, 3.3 yr, 2.1 yr and 4.8 yr. There is no suggestion of periodicity in these data. The , and photometry of DDWS suggests that there was another in 1980, but this is not evident in their photometry. It is possible that there were mini episodes between then and 1990, but the data are too sparse to be certain. As discussed in Section 3.2, the trajectory in the NIR colour-magnitude diagram points to more secondary outbursts, including a possible one in 2010–11. These irregularities suggest that the IR light curves will not repeat exactly and will make it hard to determine a photometric period without several more years observations but the present data suggests a period a little longer than 32 years and we will discuss WR 48a in the framework of its being a long-period CWB.

We tracked the fading of the dust emission at longer wavelengths and show light curves in (12.8m), (8.4m), and , together with from DDWS in Fig. 4. As can be seen from Table 2, the and magnitudes follow the same trend ( is always fainter than and owing to the coverage by this band of the strong silicate absorption feature) but are omitted from Fig. 4 for clarity. Between 1983 and 1991, the rates of fading are strongly wavelength dependent: 0.07 mag yr-1 in , 0.08 mag yr-1 in , 0.16 mag yr-1 in and 0.17 mag yr-1 in , showing continued cooling of the dust. Between the 1979 maximum and our first mid-IR photometry the fading appears to be slower, and at 20 microns our is comparable to observed by DDWS, reminiscent of the behaviour of WR 140, where the long-wavelength fluxes brightened a year after maximum (Williams et al. 2009b).
3.2 Synopsis of dust evolution from the infrared colour-magnitude diagram
There are three principal processes determining the evolution of the dust made by a system like WR 48a and its infrared emission (cf. consideration of the dust made by the archetypal dust-making CWB WR 140 by Williams et al. 2009b). These are the nucleation of new grains within the compressed stellar winds, the growth of the grains by accretion of carbon ions as they are accelerated through the wind by radiation pressure, and the cooling of the grains as they move away from the stars and the stellar radiation heating them is progressively diluted. The nucleation process is not understood, observations indicate that the newest grains have temperatures in the region of 1200 K (e.g. WHT, Williams et al. 2009b). The growth of the grains can also cause them to cool as they become relatively more efficient coolants than small grains. Their velocity from the stars is initially that inherited from the compressed wind, and is increased by radiation pressure on the grains until they reach a drift velocity relative to the wind when the radiative acceleration is balanced by supersonic drag.
Compared with the case of WR 140, we know less about the WR 48a system, e.g. velocity of the dust and its distance from the stars and stellar luminosity, and modelling is premature, but we can at least qualitatively identify these processes from the SEDs of WR 48a and its IR colour and magnitude.
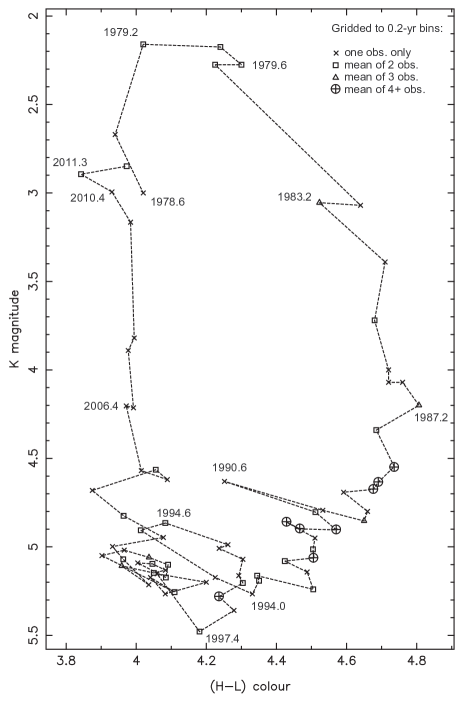
We formed a colour-magnitude diagram from our corrected and adjusted photometry to track the evolution of the dust. For the amount of hot dust, we chose magnitudes, and straddled this with () as the best indicator of the temperature of the newly formed hot dust. Sometimes WR 48a was observed several times in a short interval, so we have gridded the data to avoid confusion in the diagram and also increase the accuracy of the points where they come from averages of two or more observations. From experimentation, we found a grid size of 0.2 yr gave a good balance preserving information and providing clarity. The CMD is shown in Fig. 5.
Initially, in 1978–1979.2 (DDWS’s observations between JD 2443739 and 2443954), we observe the flux brightening while the colour did not change. We attribute this to the formation of new dust at a higher rate than before. The constant colour implies a constant temperature, that at which the dust was condensing, and its persistence shows that the SED was dominated by emission from the hottest, newest dust, – i.e. that the nucleation rate exceeded the rate at which the dust was carried away in the wind. During 1979, the dust emission cooled while the flux barely changed. This can also be seen in DDWS’s light curves: after JD 2443954, the and fluxes grew while and fell slightly. (DDWS consider their magnitudes might be affected by emission-line flares.) We interpret this phase as the continued growth of the newly formed grains while the nucleation process itself had slowed; if the grains did not grow, then the flux at all the wavelengths would start falling at the same time as the grains were carried away from the star and cooled as the stellar radiation heating them was progressively diluted. After 1979 (DDWS’s photometry on JD 2444215), fluxes at all wavelengths faded and the colour became redder owing to cooling of the dust as the condensation rate slowed. The CMD shows continued fading, with () reaching a maximum at 1987.2. The fall in average dust temperature implied by the reddening in () is interpreted as indicating that the dust being continually carried away from the star was no longer being replenished by the condensation of new grains at the same rate as before. After 1987, the () gets bluer again while the flux continues to fade. We interpret this as an indication that the dust formed in the 1979 maximum had now cooled sufficiently that its SED was no longer dominating the band emission. At longer wavelengths, continued cooling after 1987 can be seen from the the mid-IR colours (Table 2): e.g. (), which had increased from 1.6 in 1982 to 2.4 in 1988 (JD 2447519), continued increasing to 2.6 in 1991 (JD 2448345,7). Some of the SEDs are compared in Fig. 7 below.
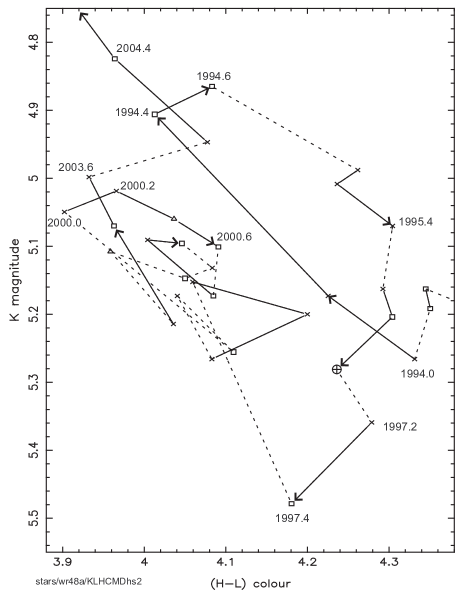
Sharp blueward movement in () accompanied by rises in were observed in 1990 and 1994, the times of the mini episodes seen in the light curves. These changes are interpreted as the consequence of additional episodes of dust formation: the bluer () being a consequence of the addition of hot dust at the condensation temperature, while the total NIR emission rises. We have sufficiently frequent observations to track the evolution of the dust emission in the 1994–95 event. This is shown in more detail in Fig. 6. After the minimum in (), the emission gets redder while continues rising (1994.4–1994.6). This implies that nucleation of grains has ceased but that the mass of dust continues to rise as the grains grow by accretion. After 1994.6, the emission fades and the dust continues cooling as it is carried away in the wind. Part of a similar clockwise trajectory can be seen in 2000.0–2000.6, and smaller bits of the others can be discerned.
After the minimum in 1997.4, and mini eruptions, the () is increasingly influenced by newly formed hot dust and remains blue as the brightens, with a superimposed secondary outburst in 2010.4–2011.3. Generally, however, the , () slope in the CMD of the major rise to maximum differs from those of the mini episodes in that the brightening due to increased dust is not accompanied by further blueing of (): the blue limit must be set by the dust condensation temperature.
3.3 Spectral Energy Distributions (SEDs)
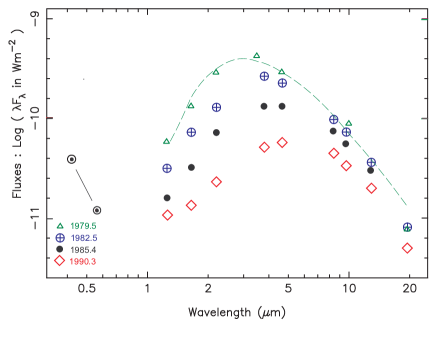
A set of SEDs illustrating the cooling and fading of the dust between maximum and our photometry in early 1990 (before the mini dust-formation episode described above) derived from the photometry is given in Fig. 7. Following the discussion in Section 1, we de-reddened the photometry with a standard interstellar law for . The dashed line through the fluxes at maximum is a 1210-K Planck function for reference – but it may be a good description of the dust SED at this phase if the emission is optically thick. The IR luminosity at maximum (Wm-2, about at the adopted distance of 4 kpc) is about 70 per cent of the total stellar luminosity, for the WC8 star plus its proposed O companion. This is the fraction of the stellar UV-optical flux that is absorbed and re-radiated by the dust, and would give the UV-optical depth in the dust if it were uniformly distributed around the stars; but we know from the images that the dust is not symmeterical, so some sightlines will have greater optical depth.
A Planckian SED in the vs. plane is isomorphic with temperature and flux level, so the broader SEDs seen as the dust cools in 1979–90 indicate that we are observing dust having a greater range of temperature.
We can extrapolate the 1979.5 SED shortwards to 1 micron to investigate the possible dilution of the 10830-Å and 9710-Å emission lines in DDWS’s 1980 spectrum by dust emission. This extrapolation, reddened by , gives a dust-emission magnitude at 1 micron of 10.4. This is significantly brighter than the 1-micron magnitude ( 12.1) extrapolated from the 2006 photometry by Baume et al. (2009) and would provide the additional wavelength-dependent continuum emission implied by the dilution of the longest wavelength lines in the 1980 spectrum. At shorter wavelengths, this is not a problem: the reddened dust-emission is 14.8, significantly fainter than the observed by Baume et al.
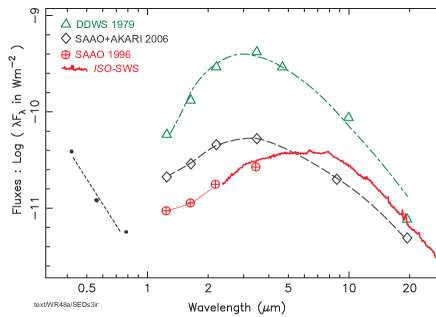
Even at minimum, we can see from the spacing of light curves that there was still significant dust emission by WR 48a. We examine the SED in 1996, near IR minimum by combining the SAAO photometry observed on JD 2450127, contemporaneously with the ISO-SWS spectrum presented in Paper I. Convolution of the SWS spectrum with the filter passband recovers the observed magnitude. The SED (Fig. 8) showing strong dust emission, and the absence of further fading after 1997 to the stellar wind level, demonstrate continuing dust formation, which replenishes that carried away in the stellar wind. In this respect, WR 48a differs from the episodic dust makers like WR 140, and resembles the variable dust-maker WR 98a discussed in Paper I.
To estimate the SED during the rising branch of the light curve, we retrieved mid-IR fluxes for WR 48a observed (as AKARI-IRC-V1 J1312398-624255) in the AKARI IRC Survey (Ishihara et al. 2009) from the ISAS/JAXA Archive. These data come from six scans made between 2006 May and 2007 August and we combined them with observed in 2006 (JD 2453906 and 2453935). Comparison of the AKARI 9-m and 18-m fluxes with the ISO-SWS SED (Fig. 8) suggests that the mid-IR flux from WR 48a barely changed over the decade between the two missions, although we note that the breadth of the and filters used for the IRC survey and their coverage of the ‘silicate’ bands requires care in the conversion of in-band fluxes to monochromatic fluxes for a SED and the observed and extinction-corrected ISO-SWS spectra need to be convolved with the AKARI IRC optics to examine this further. For the present, we note that while the mid-IR flux barely changed, the near-IR has increased significantly between 1996 and 2006, indicating the formation of new hot dust.
The optical data in Figs 7 and 8 (, and ) come from the photometry in 2006 by Baume et al. (2009). Their agrees well with the HST WFPC2 magnitude observed on 1996 July 4111Date is from the HST archive. by Wallace et al. (2003), while the difference between their and Wallace et al.’s is readily understood in terms of the longer wavelength cutoff of the filter and the red colours of WR 48a, which lie outside the range of colours for which the transformations between WFPC2 and colours given by Holtzman et al. (1995) apply. Hence, the and are a good measure of the optical flux from WR 48a at the times of our SEDs in both 2006 and 1996 at least. We note that the measured by Baume et al. is significantly fainter than the = 12.50 and 12.58 observed in the DENIS survey (Epchtein et al. 1999) in 1997 and 1998 respectively. This cannot be emission by the hot dust as we can see (Fig. 8) that there was more hot dust emission in 2006 than in 1997, and further observations in this wavelength region are needed to look for variability.
3.4 Modelling the SED of the ‘mini’ eruption
At its simplest, the IR SED of dust emission is given by the convolution of the grain emissivity, , and the Planck function for the dust temperature, :
where is our distance to the dust, is the dust mass and the emission is optically thin in the IR. Given , the temperature of the grains can be found by fitting the SED over a suitable wavelength range, followed by the dust mass from the overall fit and distance, . We calculated from the optical properties of the ‘ACAR’ amorphous carbon grains prepared in an inert atmosphere in the laboratory by Colangeli et al. (1995) and tabulated by Zubko et al. (1996). Model SEDs calculated using the ‘ACAR’ data gave a better fit to broad features in the 5.5–6.5 m ISO spectra of dust-making WC8–10 stars (Williams, van der Hucht & Morris, 1998) than those based on the ‘ACH2’ grains produced by Colangeli et al. in a hydrogen atmosphere – as one might expect for grains formed in hydrogen-poor WC stellar winds. A comparison of several laboratory analogues of cosmic amorphous carbon grains by Andersen, Lodl & Höfner (1999) shows that their absorption efficiencies have fairly similar wavelength dependencies, , in the IR, but absolute values ranging by a factor of 5. Consequently, the grain temperatures derived from fitting IR SEDs are relatively insensitive to the choice of grain sample, but not the masses of the dust clouds. Usually, circumstellar grains are not all at the same temperature, but have a range of temperature depending on their distances, , from the star(s) heating them, and also on their size. For small ‘ACAR’ grains and in the absence of significant UV-visual optical depth, the temperatures of grains in thermal equilibrium with the stellar UV-visual radiation field falls off with distance as (Williams et al. 2009). This dependence is also relatively insensitive to grain sample, and was found to apply on average even in the full radiative transfer modelling of the thick dust spiral of the classical persistent dust-making WC9 star WR 104 by Harries et al. (2004).
Similar techniques will be required for modelling of the dust made by WR 48a owing to its optical depth. This will require knowledge of the dust geometry, and is beyond the scope of the present paper; for the present, we consider simple optically thin, isothermal modelling of the 1994–5 ‘mini’ eruption. We model the SEDs at two epochs: the maximum in and at 1994.45 (data from JD 2449519) and that in and in 1994.64 (averaging data of JD 2449583 and 2449590). This emission is in excess of the continuous ‘baseline’ dust emission by WR 48a at the time, and we formed a ‘baseline’ SED interpolating between the light curves before and after the ‘mini’ dust-formation episode. The additional IR luminosity in the 1994 sub-peak at maximum (i.e. subtracting the baseline emission) was 10-11 Wm-2, equivalent to at the adopted distance of 4 kpc, is only one per cent of the total stellar luminosity, so we treat its emission as being optically thin – although it may suffer extinction in the cooler dust in our sightline. Also, if the dust is newly formed, the spread in and grain size may be small enough for the dust to be approximately isothermal, and we can usefully derive an average temperature from the observed SED.
The results of fitting these differential SEDs are given in Table 7, in which the uncertainties were estimated from those in the photometry (0.02 mag. in and 0.03 mag. in ). The two epochs roughly separate three phases in the evolution of the dust: (a) nucleation of new grains near the stars until 1994.45, (b) growth of the grains as they moved away from the stars causing the dust mass to increase between then and 1994.64 and (c) the continued fading of the dust emission. The grain temperature from the 1994.45 fit (90 K) is close to that at which the grains nucleate; the relatively large uncertainty comes from fitting the small difference between the two SEDs, and there must be some range in temperature as the first grains to form will have moved further from the stars. There was no emission from the ‘mini’ episode in the 1994.06 photometry, so we determine an average dust formation rate, presumably a combination of nucleation and growth of the oldest grains, for this phase. The lower two months later results primarily from the movement of the mini dust cloud away from the stars. There may be a component from more efficient cooling by the largest grains, but we do not have the data (e.g. velocity of the dust grains) to separate the contributions. The formation rate in this second phase is about four times that in the first and must be almost entirely due to the growth of the existing grains as the and fluxes were falling at the time, implying that nucleation had ceased. The three-fold increase in dust mass implies a 40% increase in average grain radius in the two months of the second phase.
The average dust-formation rate, yr-1, seems high for a minor dust-formation episode compared with the likely mass-loss rate of WR 48a ( yr-1) and abundance of carbon in its wind, but we recall the range in the scales of for different laboratory grain samples resulting in a similar range of derived dust mass.
| Date | formation rate | ||
|---|---|---|---|
| (K) | () | ( yr-1) | |
| 1994.45 | 122090 | ||
| 1994.64 | 105020 |
4 Discussion
The long-term infrared photometry of WR 48a shows complex behaviour different from that of any other WR star: a slow, large-amplitude variation on which are superimposed briefer variations of lower amplitude. In all cases in which they can be determined, the trajectories in the (), colour-magnitude diagram are loops (clockwise in Figs 5 and 6) indicative of the formation of new, hot dust, followed by its cooling. The recurrence time-scale for the slow variation is 32+ yrs; although the 2010–11 NIR photometry reached the levels of the earliest (1978–79) pre-maximum photometry by DDWS, the interval cannot be translated into a period owing to the superimposed short-term variations, and further observations capturing at least the maximum and early decline are needed for a period222Strictly, observations over another whole cycle, but these would take the first author to his centenary and are not planned. Even without a period, there is enough evidence to consider WR 48a as a CWB periodic dust-maker and discuss it in that context.
The total dust luminosity at maximum (1979) is 13 that in 1996, near minimum, implying a variable rate of dust formation assuming a constant wind dispersing the dust. The rate of dust formation is better estimated from the short wavelength flux sensitive to the hottest, newly formed dust and the range in between maximum and minimum (adjusted for the stellar contribution) gives a factor . The fraction of the WC8 wind going into the WCR is determined by the angular size of the WCR, which depends on the wind-momentum ratio , which does not change around the orbit if the winds collide at their terminal velocities, but the pre-shock wind density at the WCR does change with the stellar separation if the orbit is elliptical. If maximum and minimum dust formation coincide with periastron and apastron passages in an elliptical orbit, and if the dust formation rate is proportional to the pre-shock wind density at the WCR, the stellar separation varies by a factor of and the orbital eccentricity would be , with periastron passages in 1979 and some time after mid-2011.
The mini eruptions appear not to be periodic, arguing against the suggestion in Paper I of a third stellar component in WR 48a, and other large-scale overdensity structures which are intercepted by the WCR as it moves through the winds are implied. The only other system having mini outbursts superimposed on its long-term dust-formation variation is WR 137. This is one of the few WR stars to have significant continuum polarization and wind asymmetry (Harries, Hiller & Howarth 1998). Harries, Babler & Fox (2000) pointed out the similarity of WR 137 to WR 6 and WR 134, which display periodic variability in their emission-line morphology possibly caused by the rotation of large-scale azimuthal structures within their flattened winds. Polarization observations of WR 48a are needed to to see if this is the case here. Also, the H emission associated with the companion suggests that this might have a flattened wind and large-scale structures.
The persistence of dust formation even at IR minimum classifies WR 48a as a variable dust maker like WR 98a, which has a period near 564 d. determined from both the rotation of its dust pinwheel (Monnier et al. 1999) and NIR photometry (Paper I). The recurrence time-scale of WR 48a much longer than this, and the periods of the episodic dust makers, of which the longest is 13.05 yrs for WR 137, both from IR photometry (Williams et al. 2001) and the RV orbit (Lèfevre et al. 2005), and even the orbital period, 24.8 yr, of the persistent dust-maker WR 112 inferred from its multi-arc dust cloud (Marchenko et al. 2002). The relevance of the long period is the implied size of the orbit (for stellar systems of similar mass), with implications for the wind-collision process, particularly whether the post-shock WC wind is radiative or adiabatic.
Radiative cooling in the post-shock WC wind is important for dust formation (Usov 1991). It was discussed by Stevens, Blondin & Pollock (1992), who introduced the cooling parameter, : the ratio of the time-scales for cooling of the shocked gas and its escape from the apex of the WCR to flow downstream, and given by
where is the wind velocity in units of 1000 km s-1, is the separation of the stars in units of cm, and is the star’s mass-loss rate in units of M⊙ yr-1. Stevens et al. considered a wind with to be adiabatic and to be radiative; recent hydrodynamical simulations by Parkin & Pittard (2008) find a higher threshold, with the compressed wind cooling rapidly if . The WCR in a system having a very elliptical orbit, like WR 140, can vary between adiabatic and radiative as the stellar separation varies, becoming radiative close to periastron – the only time that dust forms in that system. In the case of WR 48a we know none of , and , but can estimate very roughly. If the stars in WR 48a have masses comparable to those in the Vel system they would have in a yr period circular orbit. Adopting a wind velocity of 1200 km s-1 (Section 2.3) and assuming a mass-loss rate of M⊙ yr-1, we have for the WR 48a WCR. This is significantly above the threshold and indicates an adiabatic WCR – which does not favour dust formation. In an elliptical orbit, the separation and hence would be smaller near periastron (e.g. for ); but they would be larger at apastron – and we know from the observations that dust forms throughout the orbit. The dust formation by WR 112 raises a similar problem: for the same stellar masses, the stars would have in an orbit having (Marchenko et al. 2002) and for the same estimates of mass loss and velocity, which are also those used in their modelling by Marchenko et al. Higher mass-loss rates would result in lower values of , as would lower wind velocities, which enter with the fourth power. Wind velocities below km s-1 would give values of and possibly radiatively cooling winds. The velocities of both stars need to be measured from high-resolution spectra to advance the question of the cooling of the post-shock winds and the conditions allowing their dust formation. Velocities are also needed to aid interpretation of the dust images of the two stars.
The recurrence of dust formation, the dilution of the WC emission lines implying presence of a luminous companion, the anomalous emission in H (and possible H and Br) supporting this, and the strong X-ray emission reported by Zhekov et al. (2011) and Mauerhan et al. (2011) all point to WR 48a being a long-period CWB. The IR photometry needs to be extended to determine a period and characterise the ‘mini’ outburst and the spectrum needs to be re-observed at higher resolution and S/N to elucidate the types of both components and determine the WC wind velocity to further the consideration of the conflict between observed dust formation and an apparently adiabatic post-shock wind. Knowledge of the wind cooling will also be valuable in understanding the X-ray flux from WR 48a and its long term variation. The long period of the system suggests that any non-thermal radio emission from the WCR will have little difficulty in escaping the wind (cf. Dougherty & Williams 2000). Its distance is comparable to that of WR 112 (4 kpc, van der Hucht 2001), which shows variable non-thermal radio emission at the level of a few mJy (Chapman et al. 1999, Monnier et al. 2002), so we expect the similar flux levels from WR 48a if the stars have similar winds, but with greater amplitude of variation given the greater eccentricity and inclination of the WR 48a system.
Acknowledgments
The long-term observing campaign reported here would have been impossible without the active support of many individuals and observatories. We would like to thank the Directors and Staff at the SAAO, ESO and the AAO for continued access to facilities and their support over a long period, and Pik Sin Thé, Frank Spaan, R. de Jong and D. de Winter for contributing or helping with the observations at ESO. It is a pleasure to thank Martin Cohen for helpful discussions. This research has made use of the NASA / IPAC Infrared Science Archive, which is operated by the Jet Propulsion Laboratory, California Institute of Technology, under contract with the National Aeronautics and Space Administration; the Vizier database, operated by the CDS, Strasbourg, the data archive at the Space Telescope Coordinating Facility (ST-ECF) at ESO, and the DARTS archive developed and maintained by C-SODA at ISAS/JAXA. PMW is grateful to the Institute for Astronomy for hospitality and continued access to facilities of the Royal Observatory, Edinburgh. PAW acknowledges a grant from the SA National Science Foundation.
References
- [AAOnIR] Allen D. A., Cragg T. A., 1983, MNRAS, 203, 777
- [AHS] Allen D. A., Harvey P. M., Swings J. P., 1972, A&A, 20, 333
- [Grains] Andersen A.C., Loidl R., Höfner S., 1999, A&A, 349, 243
- [G305] Baume G., Carraro G., Momany Y., 2009, MNRAS, 398, 221
- [GLIMPSE] Benjamin R. A., et al. 2003, PASP, 115, 953
- [ESOcal] Bersanelli M., Bouchet P., Falomo R., 1991, A&A, 252, 854
- [clust] Bica E., Ortolani S., Momany Y., Dutra C. M., Barbuy B., 2004, MNRAS, 352, 226
- [ESOnIR] Bouchet P., Manfroid J., Schmider F. X., 1991, A&A Supp., 91, 409
- [SAAO] Carter B. S., 1990, MNRAS, 242, 1
- [nTSWR] Chapman J. M., Leitherer C., Koribalski B., Bouter R., Storey M., 1999, ApJ, 518, 890
- [C2] Cherchneff I., Le Teuff Y. H., Williams P. M., Tielens A. G. G. M., 2000, A&A, 357, 572
- [ISO48a] Chiar J. E., Peeters E., Tielens A. G. G. M., 2002, ApJ, 579, L91
- [starf] Clark J. S., Porter J. M., 2004, A&A, 427, 839
- [CBK] Cohen, M., Barlow, M.J. & Kuhi, L.V. 1975, A&A, 40, 291
- [WR112] Cohen, M. & Kuhi, L.V. 1977, MNRAS, 180, 37
- [CTB] Cohen M., Tielens A. G. G. M., Bregman J. D., 1989, ApJ, 344, L13
- [Calib] Cohen M., Walker R. G., Carter B., Hammersley P., Kidger M., Noguchi K., 1999, AJ, 117, 1864
- [ACAR] Colangeli L., Mennella V., Palumbo P., Rotundi A., Bussoletti E., 1995, A&AS, 113, 561
- [WCWOclass] Crowther P. A., De Marco O., Barlow M. J., 1998, MNRAS, 296, 367
- [DDWS] Danks A. C., Dennefeld M., Wamsteker W., Shaver P. A., 1983, A&A, 118, 301 (DDWS)
- [Clust] Danks A. C., Wamsteker W., Shaver P. A., Retallack D. S., 1984, A&A, 132, 301
- [] Dougherty S. M., Williams P. M., 2000, MNRAS, 319, 1005
- [WRspectra] Eenens, P. R. J., Williams P. M., Wade R., 1991, MNRAS, 252, 300
- [DENIS1] Epchtein N., et al. 1999, A&A, 349, 236
- [Katlas] Figer D. F., McClean I. S., Najarro F., 1997, ApJ, 486, 420
- [DENISc] Fouqué P., Chevallier L., Cohen M., et al., 2000, A&A Suppl, 141, 313
- [MkII] Glass I. S., 1993, in Kilkenny D., Lastovica E., Menzies J. W., eds, Precision Photometry, SAAO, p. 119
- [HGG] Hackwell J. A., Gehrz R. D., Grasdalen G. L., 1979, ApJ, 234, 133
- [Pol] Harries T. J., Hillier D. H., Howarth I. D., 1998, MNRAS, 296, 1072
- [pol137] Harries T. J., Babler B. L., Fox G. K., 2000, A&A, 361, 273
- [3D104] Harries T. J., Monnier J. D. Symington N. H. Kurosawa R., 2004, MNRAS, 350, 565
- [HST2UBV] Holtzman J. A., Burrows C. J., Casertano S., Hester J. J., Trauger J. T., Watson A. M., Worthey G., 1995, PASP, 107, 1065
- [AKARI-IRC] Ishihara, D., et al., 2009, in AKARI, A Light to Illuminate the Misty Universe, eds T. Onaka, G.J. White, T. Nakagawa, I. Yamamura, ASP Conference Series, 418, p. 9
- [WR137] Lefèvre L., et al., 2005. MNRAS, 360, 141
- [WR112] Marchenko S. V., Moffat A. F. J., Vacca W. D., Côté S., Doyon R., 2002, ApJ, 565, L59
- [TReCS] Marchenko S. V., Moffat A. F. J., 2007, in St-Louis N., Moffat A. F. J., eds, Massive Stars in Interacting Binaries, ASP Conference Series 367, p. 213
- [Ostars] Martins F., Schaerer D., Hillier D. J., 2005, A&A, 436, 1049
- [60 new] Mauerhan J. C., van Dyk S. D., Morris P. W., 2011, AJ, 142, 42
- [RYSgr] Menzies J. W., Feast M. W., 1997, MNRAS, 285, 358
- [WR98a] Monnier J. D., Tuthill P. G., Danchi W. C., 1999, ApJ, 525, L97
- [nonT] Monnier J.D., Greenhill L. J., Tuthill P. G., Danchi W. C., 2002, ApJ, 566, 399
- [sizes] Monnier J. D., Tuthill P. G., Danchi W. C., Murphy N., Harries T. J., 2007, ApJ, 655, 1033
- [3DCWB] Parkin E. R., Pittard J. M., 2008, MNRAS, 388, 1047
- [PEGL] Pitault A., Epchtein N., Gomez A. E., Lortet M. C., 1983, A&A, 120, 53
- [ISO62] Schutte W. A., et al., 1998, A&A, 337, 261
- [2MASS] Skrutskie M. F., et al. 2006, AJ, 131, 1163.
- [CWBth] Stevens I. R., Blondin J. M., Pollock A. M. T., 1992, ApJ, 386, 265
- [WCatlas] Torres A. V., Massey P., 1987, ApJS, 65, 459
- [WC9spec] Torres A. V., Conti P. S., 1984, ApJ, 280, 181
- [WR104] Tuthill P. G., Monnier J. D., Danchi, W. C. 1999, Nature, 398, 486
- [DustTh] Usov V. V. 1991, MNRAS, 252, 49
- [7thCat] van der Hucht K. A., 2001, New Astron. Rev., 45, 135
- [annex7] van der Hucht K. A., 2006, A&A, 458, 453
- [ISOSWS] van der Hucht K. A., et al., 1996, A&A, 315, L193
- [NIRWR] Vreux J. M., Dennefield M., Andrillat Y., 1983, A&A Supp., 54, 437
- [Atlas] Walborn N. R., Fitzpatrick E. L., 1990, PASP, 102, 379
- [HSTims] Wallace D. J., Moffat A. F. J., Shara M. M., Gies D. R., Niemela V. S., Nelan, E., 2003, in: van der Hucht K. A., Herrero A., Esteban C., eds, Proc. IAU Symp. No. 212, A Massive Star Odyssey from Main Sequence to Supernova, Astron. Soc. Pacific, San Francisco, p. 578
- [ESOnIR] Wamsteker W. M., 1981, A&A, 97, 329
- [IAU193] Williams P. M. 1999, in: van der Hucht K. A., Koenigsberger G., Eenens P. R. J., eds, Proc. IAU Symp. No. 193, Wolf-Rayet Phenomena in Massive Stars and Starburst Galaxies, Astron. Soc. Pacific, San Francisco, p. 267
- [WBLSA] Williams P. M., Beattie D. H., Lee T. J., Stewart J. M., Antonopoulou E., 1978, MNRAS, 185, 467
- [WHT] Williams P. M., van der Hucht K. A., Thé P. S., 1987a, A&A, 182, 91 (WHT)
- [Kashi] Williams P. M., van der Hucht K. A., Thé P. S., 1987b, QJRAS, 28, 248
- [Paper1] Williams P. M., van der Hucht K. A., Pollock A. M. T., Florkowski D. R., van der Woerd H., Wamstecker W. M., 1990, MNRAS, 243, 662
- [SWS] Williams P. M., van der Hucht K. A., Morris P. W., 1998, ApSS, 255, 169
- [WR137ii] Williams P. M., Kidger M. R., van der Hucht K. A. et al., 2001, MNRAS, 324, 156
- [IAU212] Williams P. M., van der Hucht K. A., Morris P. W., Marang F., 2003, in: van der Hucht K. A., Herrero A., Esteban C., eds, Proc. IAU Symp. No. 212, A Massive Star Odyssey from Main Sequence to Supernova, Astron. Soc. Pacific, San Francisco, p. 115 (Paper I)
- [WR19] Williams P. M., Rauw G., van der Hucht K. A., 2009a, MNRAS, 395, 2221
- [WR140] Williams P. M., et al., 2009b, MNRAS, 395, 1749
- [XMM] Zhekov S. A., Gagné M., Skinner S. L., 2011, ApJL, 727, L17
- [dust] Zubko V. G., 1998, MNRAS, 295, 109
- [1] Zubko V. G., Mennella V., Colangeli L., Bussoletti E., 1996, MNRAS, 282, 1321