Lock-in detection for pulsed electrically detected magnetic resonance
Abstract
We show that in pulsed electrically detected magnetic resonance (pEDMR) signal modulation in combination with a lock-in detection scheme can reduce the low-frequency noise level by one order of magnitude and in addition removes the microwave-induced non-resonant background. This is exemplarily demonstrated for spin-echo measurements in phosphorus-doped Silicon. The modulation of the signal is achieved by cycling the phase of the projection pulse used in pEDMR for the read-out of the spin state.
Electron paramagnetic resonance (EPR) has proven to be a powerful tool in the characterization of defects in semiconductors Spaeth and Overhof (2003). However, EPR is rather insensitive and typically limited to samples with more than 1010 spins Maier (1997). Due to its higher sensitivity, electrically detected magnetic resonance (EDMR) is now widely used to study defects, in particular in indirect, disordered or organic semiconductors Lepine (1972); Frankevich, Pristupa, and Kobryanskii (1984); Dyakonov et al. (1994); Carlos and Nakamura (1997); Stutzmann, Brandt, and Bayerl (2000); Graeff et al. (2005). Over the last years, pulsed EDMR (pEDMR) has gained considerable interest, since it combines the large toolbox of pulsed EPR methods Schweiger and Jeschke (2001) with the enhanced sensitivity of EDMR e.g. to identify spin-dependent transport and recombination processes and study hyperfine interactions Boehme and Lips (2003); Stegner et al. (2006); Harneit et al. (2007); McCamey et al. (2008); Behrends et al. (2009, 2010); Hoehne et al. (2011a, b); Fehr et al. (2011). However, in many cases pEDMR suffers from strong low-frequency noise and large non-resonant background signals induced by the strong microwave pulses used to manipulate the spin system Stegner et al. (2006). Here, we demonstrate that for pEDMR, a lock-in detection scheme is able to subtract the non-resonant background and effectively reduce low-frequency noise by more than one order of magnitude following similar ideas that have been applied in conventional pulsed EPR spectroscopy Percival and Hyde (1975).
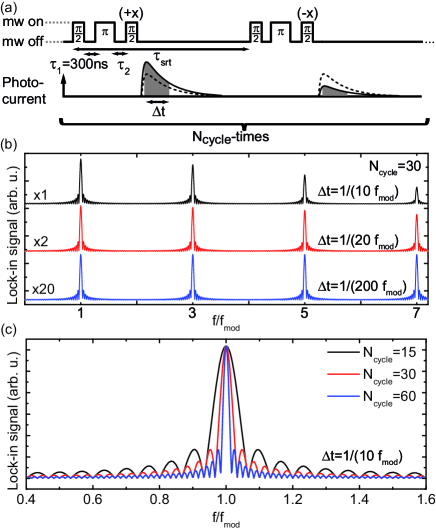
In the pulsed EDMR discussed here, the symmetry of a spin pair is changed by resonant microwave pulses resulting in a change of the recombination rate of excess carriers, which is reflected in a current transient after the microwave pulses. The pEDMR signal is obtained by box-car integrating the current transient after the pulse sequence over a time interval , resulting in a charge proportional to the recombination rate at the end of the pulse sequence Boehme and Lips (2003), as schematically shown in Fig. 1 (a). However, the strong microwave pulses also cause spin-independent non-resonant changes of the current due to e.g. rectification in the semiconductor sample resulting in additional noise and background signals which are typically much larger than the spin-dependent signals. These effects can be mitigated by using a lock-in detection scheme for pEDMR measurements, as will be described in the following.
Lock-in detection employs modulation of a signal at a certain frequency and its phase-sensitive detection in combination with bandpass filtering Dicke (1946). We will discuss how such a scheme can be implemented in pEDMR exemplarily for the measurement of electrically detected spin echoes. We use a /2----/2 spin-echo pulse-sequence, where and denote microwave pulses with corresponding flipping angles and and denote the duration of periods of free evolution [Fig. 1 (a)] Huebl et al. (2008). Depending on the phase of the projection pulse (indicated in Fig. 1 by x), the detection echo-sequence forms an effective 2 pulse for (+x) or an effective pulse for (-x), since a phase change of 180∘ results in a reversed sense of rotation of the spin states on the Bloch sphere. Thus, the echo amplitude for a (-x) projection pulse is inverted when compared to a (+x) projection pulse. By repeating the spin echo pulse sequence times with a shot repetition time and inverting the phase for every shot, the signal is square-wave modulated at a frequency ). For phase-sensitive detection, the detected for (+x) and (-x) are multiplied by +1 and -1, respectively, and the result is averaged over all cycles. As shown below, this scheme is only sensitive to signals within a bandwidth around the modulation frequency , where denotes the overall measurement time.
In contrast to conventional lock-in detection schemes, the signal in pEDMR is integrated only over the time interval which is typically much smaller than the shot repetition time ). We therefore calculate the response of the detection scheme including the box-car integration interval for an input signal of the form representing a noise component with frequency and random phase . The function is given by
| (1) |
Since the phase of the noise signal is random, the response has to be averaged over , giving
| (2) | |||||
The function is plotted in Fig. 1 (b) for different box-car integration intervals =1/(10), 1/(20) and 1/(200) with . The lock-in detection scheme is only sensitive to signals at odd harmonics of . For longer integration intervals , the higher harmonics are suppressed when compared to the fundamental frequency while for short supression is not effective as can be seen for =1/(200) in Fig. 1 (b). This can be understood by considering the frequency dependence of the envelope of the peaks, which is determined by the term of (2). For , this term can be written as , which is independent of the frequency and therefore all harmonics contribute equally.
In pEDMR, the photocurrent response typically occurs as a transient which decays within tens of microseconds after the mw pulses Boehme and Lips (2003), while typical shot repetition times are 1 ms and therefore . Therefore, the modulated signal contains frequency components at odd multiples of up to a frequency kHz. For a cut-off frequency of a high-pass filter kHz typically used to surpress low-frequency current noise which is larger than the modulation frequency Hz, the first harmonics are surpressed, but most of the signal at higher harmonics will pass through the filter. The width of the peak at the fundamental frequency (as well as for all harmonics) and therefore the bandwidth of the lock-in detection scheme and thus , as shown in Fig. 1(c) for =1/(10).
For an experimental demonstration of this detection scheme, we use Si:P epilayers consisting of a nm thick Si layer with a nominal P concentration of cm-3, covered with a native oxide and grown on a µm thick, nominally undoped Si buffer on a silicon-on-insulator substrate. EDMR signals observed in this type of sample originate dominantly from spin-dependent recombination between 31P donors and Si/SiO2 interface states (Pb0) Hoehne et al. (2010). For electrical measurements, interdigit Cr/Au contacts with a spacing of m covering an active area of mm2 are evaporated. All experiments are performed at 5 K in a dielectric microwave resonator for pulsed EPR at X-band frequencies. The samples are illuminated with above-bandgap light and biased with 100 mV resulting in a current of 60 A. The current transients after the pulse sequence are amplified by a custom-built balanced transimpedance amplifier (Elektronik-Manufaktur, Mahlsdorf) with low- and high-pass filtering at cut-off frequencies of 1 MHz and 2 kHz, respectively. In all experiments, we choose the microwave frequency and external magnetic field such that the microwave pulses resonantly excite the spectrally isolated high-field P hyperfine line Hoehne et al. (2010). We apply the spin echo pulse sequence with 30 ns long pulses, =1000 and a shot repetition time =5 ms resulting in a modulation frequency of =100 Hz.
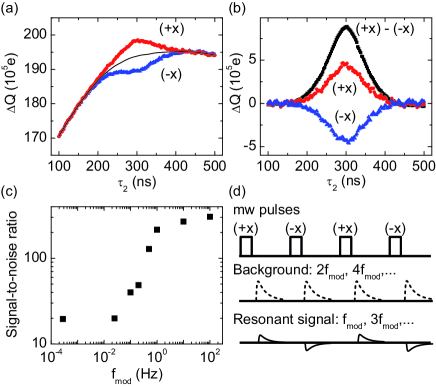
In Fig. 2(a), the integrated charge is shown separately for (+x) and (-x) as a function of for =300 ns. The echo peaks are visible at =300 ns on top of a large background with positive echo amplitude for (+x) and negative echo amplitude for (-x) while the background is the same for the two phases. To recover the signal, we subtract the two traces from each other resulting in the trace (+x)-(-x) shown in Fig. 2(b). For comparison, the echo traces (+x) and (-x) after subtraction of the background taken as the smoothed average of the two traces (black line in Fig. 2(a)) are shown as well. In addition to the effective removal of the background, comparison of the noise level in traces (+x) and (-x) with their difference (+x)-(-x) illustrates the considerable reduction of noise by the lock-in detection scheme.
The benefit of this modulation scheme is further demonstrated by measuring the noise as a function of the modulation frequency . To change the modulation frequency independently of the measurement time, in every cycle we repeat the pulse sequence (+x) -times followed by pulse sequences (-x), so that . Varying and between 1 and 1000, while keeping the number of sample points constant, changes from 0.1 Hz to 100 Hz at a constant bandwidth of 0.1 Hz. The noise is quantified as the standard deviation of 90 measurements of the echo amplitude for ==300 ns, where for each measurement 1000 sample points are recorded.
In Fig. 2 (c), the signal-to-noise ratio, obtained by dividing the echo peak amplitude by the standard deviation of the noise defined above, is plotted as a function of . By increasing the modulation frequency from several mHz to 100 Hz the signal-to-noise ratio is improved by more than one order of magnitude. The data point at =0.025 Hz is measured with 20 ms, and resulting in a 4 times longer measurement time when compared to the other data points. Since the bandwidth of the lock-in detection scheme , the obtained noise amplitude is divided by 2 to make it comparable with the other values. The data point at =0.3 mHz is taken without phase modulation. In this case, is calculated as the inverse of the overall measurement time.
The signal-to-noise ratio saturates both at low as well as at high frequencies. A measurement of the current noise of the illuminated Si sample without the application of microwave pulses shows that the noise floor at high is determined by the current noise of the sample (data not shown). The current noise spectrum shows a strong increase of the noise at low frequencies, which is, however, removed effectively by the high-pass filter of the amplifier, so that a flat noise spectrum is observed at its output. We therefore conclude that the strong decrease of the signal-to-noise ratio at lower frequencies observed in Fig. 2 (c) is due to low-frequency noise of the background current transients induced by the strong microwave pulses. We tentatively attribute this noise to low-frequency variations of the mw pulse amplitude, which, due to the non-resonant current transients, has stronger effects on EDMR measurements when compared to ESR. This noise, although at low-frequencies, is not removed by the high-pass filter as discussed below.
Since the amplitude of the non-resonant current transients is independent of the phase of the mw pulse, the background signal contains Fourier components at even multiples of , while the Fourier components of the signal occur at odd multiples of as sketched in Fig. 2(d). Both signals occur on the same timescale and therefore contain Fourier components up to kHz as discussed above. Noise in the amplitude of the mw pulses at frequencies will be mixed with the background signal resulting in noise components at and higher even harmonics, which are not filtered out by the high-pass filter. However, the lock-in detection scheme is only sensitive to signals at odd harmonics of (see Fig. 1) and, therefore, the low-frequency noise is removed for large as shown in Fig. 2(c). Since noise at cannot be removed by lock-in detection, the signal-to-noise ratio decreases for smaller due to the low-frequency noise.
In most pulsed EDMR experiments until now, the large microwave-induced background is removed by measuring additional traces at different values of the static magnetic field where no resonant processes are observed Stegner et al. (2006). In the approach presented here, no additional traces at off-resonance fields have to be measured since the background is subtracted by the lock-in detection scheme. Since for a spin echo without lock-in detection conventional pEDMR measurements were performed at typically two additional values of the magnetic field, the phase-cycling itself reduces the measurement time by a factor of 3. Together with the tenfold increase of the signal-to-noise ratio due to the lock-in detection, this leads to a reduction of the measurement time by a factor of 300. In principle, for pulse sequences where phase modulation is not feasible, other parameters like the microwave frequency or the magnetic field can be modulated.
In summary, we have demonstrated theoretically and experimentally a lock-in detection scheme for pulsed EDMR experiments which significantly improves the signal-to-noise ratio. This scheme allows to extend the experimental methods of pEDMR to more advanced pulse sequences Hoehne et al. (2011a, b) and opens its application to other materials and spin-dependent processes to be studied with this technique.
This work was supported by DFG (Grant No. SFB 631, C3) and BMBF (EPR-Solar, Grant No. 03SF0328).
References
- Spaeth and Overhof (2003) J.-M. Spaeth and H. Overhof, Point Defects in Semiconductors and Insulators (Springer, Berlin, 2003).
- Maier (1997) D. C. Maier, Bruker Rep. 144, 13 (1997).
- Lepine (1972) D. J. Lepine, Phys. Rev. B 6, 436 (1972).
- Frankevich, Pristupa, and Kobryanskii (1984) E. L. Frankevich, A. I. Pristupa, and V. M. Kobryanskii, JETP Lett. 40, 733 (1984).
- Dyakonov et al. (1994) V. Dyakonov, N. Gauss, G. Rösler, S. Karg, W. Rieß, and M. Schwoerer, Chem. Phys. 189, 687 (1994).
- Carlos and Nakamura (1997) W. E. Carlos and S. Nakamura, Appl. Phys. Lett. 70, 2019 (1997).
- Stutzmann, Brandt, and Bayerl (2000) M. Stutzmann, M. S. Brandt, and M. W. Bayerl, J. Non-Cryst. Solids 266-269, 1 (2000).
- Graeff et al. (2005) C. F. O. Graeff, G. B. Silva, F. Nüesch, and L. Zuppiroli, Eur. Phys. J. E 18, 8 (2005).
- Schweiger and Jeschke (2001) A. Schweiger and G. Jeschke, Principles of pulse electron paramagnetic resonance (Oxford University Press, Oxford, 2001).
- Boehme and Lips (2003) C. Boehme and K. Lips, Phys. Rev. B 68, 245105 (2003).
- Stegner et al. (2006) A. R. Stegner, C. Boehme, H. Huebl, M. Stutzmann, K. Lips, and M. S. Brandt, Nat. Physics 2, 835 (2006).
- Harneit et al. (2007) W. Harneit, C. Boehme, S. Schaefer, K. Huebener, K. Fostiropoulos, and K. Lips, Phys. Rev. Lett. 98, 216601 (2007).
- McCamey et al. (2008) D. R. McCamey, H. A. Seipel, S.-Y. Paik, M. J. Walter, N. J. Borys, J. M. Lupton, and C. Boehme, Nat. Mat. 7, 723 (2008).
- Behrends et al. (2009) J. Behrends, A. Schnegg, M. Fehr, A. Lambertz, S. Haas, F. Finger, B. Rech, and K. Lips, Phil. Mag. 89, 2655 (2009).
- Behrends et al. (2010) J. Behrends, A. Schnegg, K. Lips, E. A. Thomsen, A. K. Pandey, I. D. W. Samuel, and D. J. Keeble, Phys. Rev. Lett. 105, 176601 (2010).
- Hoehne et al. (2011a) F. Hoehne, L. Dreher, H. Huebl, M. Stutzmann, and M. S. Brandt, Phys. Rev. Lett. 106, 187601 (2011a).
- Hoehne et al. (2011b) F. Hoehne, J. Lu, A. R. Stegner, M. Stutzmann, M. S. Brandt, M. Rohrmüller, W. G. Schmidt, and U. Gerstmann, Phys. Rev. Lett. 106, 196101 (2011b).
- Fehr et al. (2011) M. Fehr, J. Behrends, S. Haas, B. Rech, K. Lips, and A. Schnegg, Phys. Rev. B 84, 193202 (2011).
- Percival and Hyde (1975) P. Percival and J. S. Hyde, Rev. Sci. Instr. 46, 1522 (1975).
- Dicke (1946) R. H. Dicke, Rev. Sci. Instr. 17, 268 (1946).
- Huebl et al. (2008) H. Huebl, F. Hoehne, B. Grolik, A. R. Stegner, M. Stutzmann, and M. S. Brandt, Phys. Rev. Lett. 100, 177602 (2008).
- Hoehne et al. (2010) F. Hoehne, H. Huebl, B. Galler, M. Stutzmann, and M. S. Brandt, Phys. Rev. Lett. 104, 046402 (2010).