Late-time Light Curves of Type ii Supernovae: Physical Properties of SNe and their environment
Abstract
We present band photometry of 6 core-collapse supernovae, SNe 1999bw, 2002hh, 2003gd, 2004et, 2005cs, and 2006bc measured at late epochs (2 yrs) based on Hubble Space Telescope (), Gemini north, and WIYN telescopes. We also show the lightcurves of a supernova impostor SN 2008S up to day 575 because it was serendipitously in our SN 2002hh field of view. Of our 43 observations in total, 36 observations are successful in detecting the light from the SNe alone and measuring magnitudes of all the targets. observations show a resolved scattered light echo around SN 2003gd at day 1520 and around SN 2002hh at day 1717. Our Gemini and WIYN observations detected SNe 2002hh and 2004et, as well. Combining our data with previously published data, we show -band lightcurves and estimate decline magnitude rates at each band in 4 different phases. Our prior work on these lightcurves and other data indicate that dust is forming in our targets from day 300-400, supporting SN dust formation theory. In this paper we focus on other physical properties derived from the late time light curves. We estimate 56Ni masses for our targets (0.5-14 10-2 ) from the bolometric lightcurve of each for days 150-300 using SN 1987A as a standard (7.510-2 ). The flattening or sometimes increasing fluxes in the late time light curves of SNe 2002hh, 2003gd, 2004et and 2006bc indicate the presence of light echos. We estimate the circumstellar hydrogen density of the material causing the light echo and find that SN 2002hh is surrounded by relatively dense materials ((H) 400 cm-3) and SNe 2003gd and 2004et have densities more typical of the interstellar medium (1 cm-3). We analyze the sample as a whole in the context of physical properties derived in prior work. The 56Ni mass appears well correlated with progenitor mass with a slope of 0.3110-2, supporting the previous work by Maeda et al. (2010), who focus on more massive Type ii SNe. The dust mass does not appear to be correlated with progenitor mass.
Subject headings:
(Stars:) supernovae: individual: SN1999bw, SN2002hh, SN 2003gd, SN2004et, SN2005cs, SN2006bc, SN 2008S; (ISM:) dust, extinction1. Introduction
Since the discovery of SN 1987A, dust formation has been confirmed observationally in the ejecta of several core-collapse supernovae (Type ii SNe; e.g., Wooden et al. 1993, Kozasa et at al. 2009). In these, one or more of the following signatures are observed 250-600 days after the initial explosion: (1) the development of an infrared excess seen in the spectral energy distribution (SED) of the SN; (2) the appearance of blue-shifted optical/near-infrared lines, which is interpreted as the attenuation of the redshifted wing (i.e., the receding gas) by dust formed homogeneously in the ejecta; and (3) the steepening decline of the optical lightcurve consistent with an increase in circumstellar extinction. The SN luminosity after day 150 is supported by rays from 56Co decaying into 56Ni. If the dust is formed in SNe, the optical luminosity from the SN remnant has become much fainter than would be produced by the radioactive decay power.
In order to properly assess dust formation by Type ii SNe ejecta it is essential to continue monitoring Type ii SNe before and after dust formation started (i.e. day 300) because other physical properties such as the 56Ni mass and light echos from circumstellar and interstellar dust can be measured and disentangled from dust production effects. The early epoch evolution of Type ii SNe before day 300 has been relatively well studied in optical and near-IR bands. However at the present time, the evolution beyond day 300 has been poorly measured.
To address these issues, we have conducted a long term photometric monitoring of SNe using high angular resolution facilities such as HST/WFPC2/NICMOS, WIYN/WHIRC, and Gemini/NIRI through our SNe project (Survey for Evolution of Emission from Dust in SNe, PI: M.Barlow). In this paper we report on the late-epoch light-curves of 6 Type ii SNe. The remainder of this paper is organized as follows. In section 2, we present the observations, data processing and resulting images, and light curves. In section 3, we analyze the resulting light curves to derive 56Ni masses for all targets except for SN 1999bw and, for cases with detected light echoes, to estimate the density of the environment. In section 4, we discuss the results for each SN. In section 5, we do a comparative analysis of these SNe in the context of physical properties reported in the literature, such as the amount of dust produced and progenitor mass.
2. Observations & Data reduction
2.1. Sample selection
We chose 6 Type ii SNe in nearby galaxies, matching the following three criteria. (1) The distance to a SN is within 15 Mpc and thus suitable for long-term follow-up observations with , , and 4-m class ground based telescopes. (2) At the start of the observations, the SN is 1 year or older after the initial explosion. (3) The expected -band magnitude of targets is 28 based on the evolution of SN 1987A in order that the SNe is detectable within a reasonable integration time. These 6 Type ii SNe include 4 Type ii-P (SNe 2002hh, 2003gd, 2004et, and 2005cs), 1 Type ii-n (SN 1999bw), and 1 Type ii-L or ii-P (SN 2006bc). In addition, during our campaign, a supernova impostor, SN 2008S, erupted in the field of view of our SN 2002hh observations, allowing us to monitor this new type of variable as well.
2.2. observations
The high-angular resolution images of our target SNe were taken by the Hubble Space Telescope with the Wide Field Planetary Camera 2 (WFPC2) and the Near Infrared Camera and Multi-Object Spectrometer 2 (NICMOS2) through the cycle 16 proposal by M.Meixner (proposal ID: GO 11229). The observations were coordinated so that the WFPC2 and NICMOS images were taken within days to a week of each other. In the WFPC2 observations, we took the images using the F450W, F606W, F622W, and F814W filters. In the NICMOS2 observations, we took the images using the F110W, F160W, and F205W filters. The observation logs and SN positions are summarized in Table LABEL:obslog. The boldface coordinates in this table are derived from our F606W or F622W observations and the others are from the SIMBAD database.
2.3. data reduction
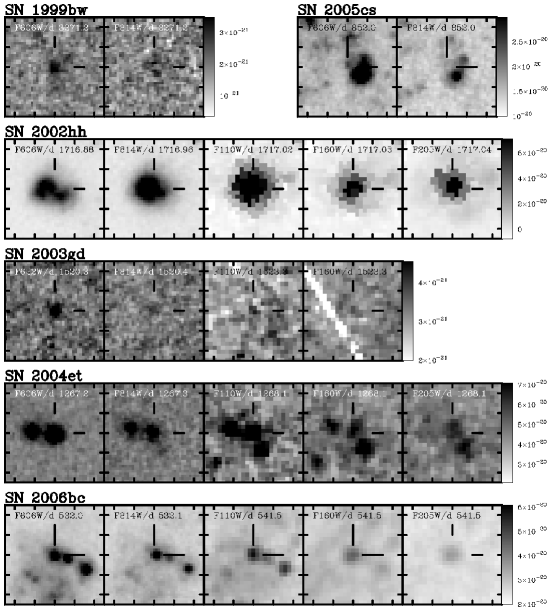
The data reduction and calibration were performed by standard techniques. Using the STSDAS package version 3.8 specialized for , we reduced and calibrated the data, including cosmic rays and artificial features removal and detector linearity correction. The final high resolution images were created using the STSDAS/DRIZZLE package. For both the WFPC2 and NICMOS2 observations, we conducted sub pixel scale dithering to improve S/N and remove cosmic rays and obtain further high-resolution images via the drizzle technique. We set 4 or 5 points dithering with 115-400sec per science frame for each band. After DRIZZLE processing, we performed an additional distortion correction and alignment using background stars for the NICMOS2 data. The point-spread-function (PSF) of these reference background stars were fit by Gaussian profiles to obtain accurate positions, and then instrumental distortions were corrected with the XYXYMATCH, GEOMAP, and GEOTRAN IRAF routines, and we aligned the positions of stars in the NICMOS detector to those in the WFPC2. The resultant plate scale reaches 0.025′′ pixel-1 in the WFPC2 and archived ACS/HRC data (see below) and 0.04′′ pixel-1 in the NICMOS2 and archival NICMOS3 data (see below), respectively. The size of the PSF at FWHM typically corresponds to 3 pixel. Using the PSF fitting package IRAF/DAOPHOT, photometry was performed on the images, except for SN 2005cs in F110W and F160W and SN 2002hh in all bands. For SN 2005cs in F110W and F160W, we used differential images with pre-explosion images using archival NICMOS3 images of the host galaxy taken in 1998 June 28th (PI:N.Scoville, Proposal-ID: GO 7237) and our NICMOS2 data to detect the SN alone and performed PSF fitted photometry. SN 2002hh has an extended shell structure as shown in Fig.1, we therefore performed aperture photometry based on background star subtracted images. We used 0.6′′ radius regions to define the entire the SN. We subtracted background from an annulus centered on the SN with inner and outer radii of 0.6′′ and 0.8′′. The aperture corrections were calculated with an empirical PSF function. Note that the magnitudes of SN2002hh listed in Tables 1, 2, and 3 include the SN + extend light echo.
For each filter, the measured count rate (CR, in units of DN s-1) of the SN was converted to flux by multiplication with the PHOTFLAM (erg s-1 cm-2 Å-1 DN-1 or erg s-1 cm-2 Å-1 electron-1) conversion factor given in the fits header, where PHOTFLAM is the bandpass-averaged flux density for a source that would produce a count rate (CR in units of DN s-1 or electron s-1). The system magnitude (STMAG) was calculated from the following equation,
| (1) |
where ZP is the zero point magnitude for 1 DN s-1 or 1 electron s-1. For the WFPC2 and archival ACS data (see below), the conversion from F450W, F606W and F622W, and F814W STMAG to the Vega magnitude system , , , and , respectively, used the STSDAS/SYNPHOT package. The broad band NICMOS filters, F110W, F160W and F205W, are roughly equivalent to the , and filters respectively, color transformations are not well constrained for late-time SN spectra at near-IR wavelengths. Based on our experience, for SNe in days 300-1000, the spectral energy distribution (SED) in the range from 0.44 to 2.2 m can be represented by a single blackbody function with the effective temperature of 7 000-11 000 K. The conversion from the STMAG to the Vega magnitude system was done by the STSDAS/SYNPHOT package, assuming a 9 000 K blackbody function as the incident SED.
| SN Name | Host Galaxy | (Mpc) | (2000.0) | (2000.0) | Obs.Date | Epoch (day) | Exp.time | Detector | Filter | Detect | Magnitudes | |
|---|---|---|---|---|---|---|---|---|---|---|---|---|
| SN1999bw | NGC 3198 | 13.7 | 0.013 | 10:19:46.81 | +45:31:35.0 | 2008/04/03 | 3271.24 | 128sec5 | NIC2 | F110W | N | |
| (ii-n) | 10:19:46.68 | +45:31:37.32 | 2008/04/03 | 3271.25 | 128sec4 | NIC2 | F160W | N | ||||
| 2008/04/03 | 3271.26 | 115sec5 | NIC2 | F205W | N | |||||||
| 2008/04/03 | 3271.11 | 400sec4 | PC1 | F606W | Y | 25.77 0.16 | ||||||
| 2008/04/03 | 3271.20 | 400sec4 | PC1 | F814W | Y | 25.55 0.24 | ||||||
| SN2002hh | NGC 6946 | 5.9 | 1.97 | 20:34:44.29 | +60:07:19.0 | 2007/07/09 | 1716.88 | 400sec4 | PC1 | F606W | Y | 20.62 0.11 |
| (ii-P) | 20:34:44.19 | +60:07:20.11 | 2007/07/09 | 1716.91 | 400sec4 | PC1 | F814W | Y | 19.67 0.11 | |||
| 2007/07/09 | 1716.96 | 400sec4 | PC1 | F450W | Y | 23.25 0.18 | ||||||
| 2007/07/10 | 1717.02 | 128sec5 | NIC2 | F110W | Y | 18.84 0.11 | ||||||
| 2007/07/10 | 1717.03 | 128sec4 | NIC2 | F160W | Y | 18.53 0.11 | ||||||
| 2007/07/10 | 1717.04 | 115sec5 | NIC2 | F205W | Y | 17.44 0.11 | ||||||
| SN2003gd | NGC 628 | 7.2 | 0.18 | 01:36:42.65 | +15:44:19.9 | 2007/08/11 | 1519.79 | 400sec4 | PC1 | F622W | Y | 24.91 0.18 |
| (ii-P) | 01:36:42.71 | +15:44:20.25 | 2007/08/11 | 1519.86 | 400sec4 | PC1 | F814W | Y | 25.60 0.19 | |||
| 2007/08/14 | 1523.25 | 128sec5 | NIC2 | F110W | Y | 24.92 | ||||||
| 2007/08/14 | 1523.26 | 128sec4 | NIC2 | F160W | Y | 25.47 | ||||||
| 2007/08/14 | 1523.27 | 115sec5 | NIC2 | F205W | N | |||||||
| SN2004et | NGC 6946 | 5.9 | 0.41 | 20:35:25.33 | +60:07:17.7 | 2007/07/08 | 1071.74 | 400sec4 | PC1 | F606W | Y | 23.01 0.12 |
| (ii-P) | 20:35:25.36 | +60:07:17.80 | 2007/07/08 | 1071.82 | 400sec4 | PC1 | F814W | Y | 23.04 0.14 | |||
| 2007/07/08 | 1071.91 | 128sec5 | NIC2 | F110W | Y | 21.76 0.14 | ||||||
| 2007/07/08 | 1071.94 | 128sec4 | NIC2 | F160W | Y | 22.56 0.22 | ||||||
| 2007/07/08 | 1071.95 | 115sec5 | NIC2 | F205W | Y | 22.07 | ||||||
| 2008/01/19 | 1266.71 | 400sec4 | PC1 | F606W | Y | 23.35 0.11 | ||||||
| 2008/01/19 | 1266.78 | 400sec4 | PC1 | F814W | Y | 23.35 0.13 | ||||||
| 2008/01/20 | 1267.58 | 128sec5 | NIC2 | F110W | Y | 21.99 0.15 | ||||||
| 2008/01/20 | 1267.59 | 128sec4 | NIC2 | F160W | Y | 22.62 0.24 | ||||||
| 2008/01/20 | 1267.59 | 115sec5 | NIC2 | F205W | Y | 21.07 0.19 | ||||||
| SN2005cs | NGC 5194 | 7.1 | 0.14 | 13:29:53.37 | +47:10:28.2 | 2007/10/28 | 851.96 | 400sec4 | PC1 | F606W | Y | 25.16 0.19 |
| (ii-P) | 13:29:52.80 | +47:10:35.64 | 2007/10/28 | 852.02 | 400sec4 | PC1 | F814W | Y | 25.07 0.24 | |||
| 2007/10/31 | 854.15 | 128sec5 | NIC2 | F110W | Y | 23.30 | ||||||
| 2007/10/31 | 854.16 | 128sec4 | NIC2 | F160W | N | |||||||
| 2007/10/31 | 854.17 | 115sec5 | NIC2 | F205W | N | |||||||
| 2008/03/31 | 1006.15 | 400sec4 | PC1 | F606W | Y | 25.94 | ||||||
| 2008/03/31 | 1006.21 | 400sec4 | PC1 | F814W | N | |||||||
| SN2006bc | NGC 2397 | 16 | 0.52 | 07:21:16.50 | –68:59:57.3 | 2007/09/07 | 531.98 | 400sec4 | PC1 | F606W | Y | 23.16 0.19 |
| (ii-P or L) | 07:21:16.45 | –68:59:56.75 | 2007/09/07 | 532.07 | 400sec4 | PC1 | F814W | Y | 21.72 0.19 | |||
| 2007/09/17 | 541.45 | 128sec5 | NIC2 | F110W | Y | 21.60 0.20 | ||||||
| 2007/09/17 | 541.46 | 128sec4 | NIC2 | F160W | Y | 20.80 0.20 | ||||||
| 2007/09/17 | 541.47 | 115sec5 | NIC2 | F205W | Y | 19.90 0.10 | ||||||
| 2008/02/17 | 694.25 | 400sec4 | PC1 | F606W | Y | 23.85 0.26 | ||||||
| 2008/02/17 | 694.28 | 400sec4 | PC1 | F814W | Y | 22.51 0.31 | ||||||
| 2008/02/17 | 694.35 | 128sec5 | NIC2 | F110W | Y | 22.40 0.30 | ||||||
| 2008/02/17 | 694.36 | 128sec4 | NIC2 | F160W | Y | 21.70 0.40 | ||||||
| 2008/02/17 | 694.37 | 115sec5 | NIC2 | F205W | Y | 20.70 0.20 |
2.4. Archive data
Except for SN 2004et, archival WFPC2, Advanced Camera for Surveys (ACS), and NICMOS3 images are available for our SNe sample as noted in Table 2. We created drizzled images and we measured the magnitudes by the same way as described above. The measured magnitudes are listed in Table 2. In this table we also list the magnitudes measured at earlier epochs as found in the literature as noted in the table.
| SN Name | Obs.Date | Epoch | Detector | Filter | Magnitudes | Ref. |
|---|---|---|---|---|---|---|
| SN 1999bw | 2001/01/09 | 629.88 | PC1 | F555W() | 24.08 0.06 | (1) |
| SN 2002hh | 2005/09/17 | 1056.26 | HRC | F606W() | 20.88 0.11 | (2) |
| 2005/09/17 | 1056.40 | HRC | F814W() | 19.49 0.11 | (2) | |
| 2006/04/23 | 1273.94 | HRC | F606W() | 20.91 0.11 | (2) | |
| SN 2003gd | 2004/12/08 | 544.11 | HRC | F435W() | 23.98 0.15 | (3) |
| 2004/12/08 | 544.11 | HRC | F622W() | 23.13 0.16 | (3) | |
| 2007/06/21 | 1469.45 | PC1 | F450W() | 25.01 0.17 | (4) | |
| 2007/06/21 | 1469.45 | PC1 | F675W() | 24.10 0.16 | (4) | |
| SN 2005cs | 2006/12/10 | 529.02 | HRC | F555W() | 22.07 0.15 | (5) |
| 2006/12/10 | 529.02 | HRC | F814W() | 21.36 0.15 | (5) | |
| SN 2006bc | 2006/10/14 | 203.28 | WFC1 | F555W() | 22.10 0.10 | (6) |
| 2006/10/14 | 203.28 | WFC1 | F814W() | 19.80 0.10 | (6) |
| SN 2002hh | |||||
|---|---|---|---|---|---|
| Obs.Date | Epoch | Instr. | |||
| 2005/06/04 | 951.5 | NIRI | 18.50 0.16 | 17.76 0.16 | 16.93 0.20 |
| 2005/08/04 | 1012.5 | NIRI | 18.57 0.15 | 17.80 0.16 | 16.93 0.20 |
| 2005/10/16 | 1085.3 | NIRI | 18.48 | 17.88 | 16.78 0.20 |
| 2006/07/07 | 1349.5 | NIRI | 18.51 0.15 | 17.75 0.16 | 16.95 0.20 |
| 2007/07/10 | 1717.0 | HST | 18.61 0.19 | 18.03 0.23 | 17.02 0.21 |
| 2008/11/12 | 2208.1 | WHIRC | 18.59 0.15 | 17.82 0.16 | 17.00 0.20 |
| 2009/05/10 | 2387.4 | WHIRC | 17.54 0.20 | ||
| 2009/08/30 | 2499.3 | WHIRC | 18.07 0.20 | ||
| SN 2004et | |||||
| 2009/08/30 | 1801 | WHIRC | 22.6 | ||
| SN 2008S | |||||
| 2008/11/12 | 283.3 | WHIRC | 18.37 0.15 | 16.73 0.15 | 15.64 0.20 |
| 2009/05/10 | 463.5 | WHIRC | 17.83 0.16 | 16.25 0.73 | |
| 2009/08/30 | 575.5 | WHIRC | 18.74 0.16 | ||
2.5. NIRI and WHIRC observations
To complement observations, we performed -band high-resolution imaging observations for SNe 2002hh, 2004et, and 2008S using the Gemini north 8.2-m telescope with the Near Infrared Imager and spectrometer (NIRI) and the WIYN 3.5-m telescope with the WIYN High Resolution Infrared Camera (WHIRC; Meixner et al. 2010). The NIRI and Aug 2009 WHIRC observations were carried out through the NOAO open use programs of P.Is. G.C.Clayton and M.Otsuka, respectively. The other WHIRC observations were carried out in STScI guaranteed observation time (P.I.: M.Meixner). The plate scale of both instruments is 0.1′′ pixel-1 and the seeing was 0.3′′-0.8′′ at -bands. The average PSF size of 0.5′′ enabled us to measure magnitudes of both SNe with relatively little contamination from nearby stars.
The data reductions using the IRAF/MSCRED package were carried out in a standard manner (dark subtraction, flat-fielding, and local sky subtraction). For the WHIRC data, we performed a detector linearity correction using the WHIRC task WPREP and distortion correction using the files downloaded from the WIYN/WHIRC web page. The magnitude measurements were performed using the IRAF/DAOPHOT. The conversion of the instrumental magnitudes into the standard system was performed relative to Two Micron All-Sky Survey (2MASS) photometry of 4-10 stars in the field.
The measured magnitudes are listed in Table 3. The errors include the estimated errors of 2MASS stars’ magnitudes. For SN 2002hh, we converted the Vega magnitudes derived from data to 2MASS magnitudes. Comparison between and 2MASS magnitudes indicates that a star nearby SN 2002hh contributes 0.2-0.3 mag.
2.6. Results
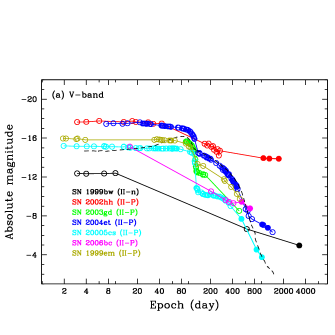
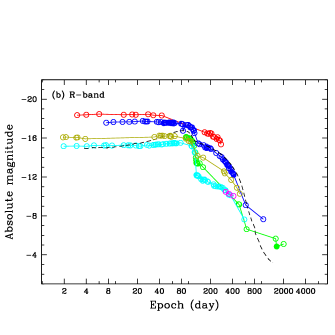
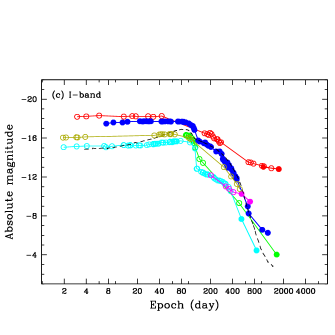
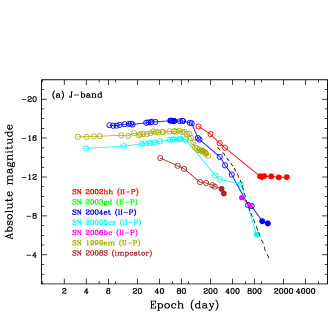
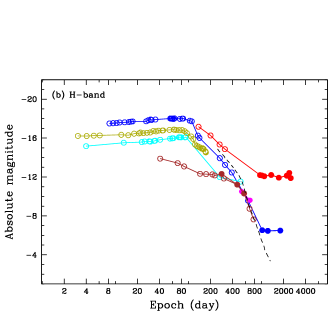
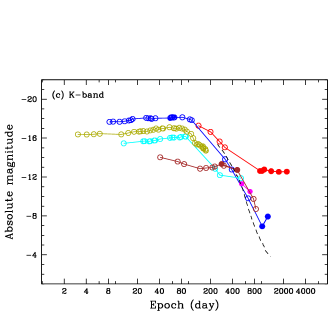
The resultant images of target SNe are presented in Fig.1. We are successful in detecting the SNe and measuring either F606W() or F622W() band magnitudes of all the targets in observations. The light-curves of each SN are presented in Figs.2 () and 3 (-bands). Theses light-curves are based on our data (filled circles) and data from the literature for each object (open circles). The data after 600-1000 days are mainly from the former and the data before this phase are mainly from the latter. The data sources for each object are summarized in Table 4. The values in Figs. 2 and 3 are de-reddened absolute magnitudes adopting the distance to the host galaxy, , and listed in the third and forth columns of Table 1. All in Table 1 are the total extinction by the Milky Way Galaxy and host galaxy. We used the reddening function assuming the =3.1 case by Cardelli et al. (1989) for all SNe. As references, we plot the lightcurves of the Type ii-P SNe 1987A (Hamuy & Suntzeff 1990; Walker & Suntzeff 1991) and 1999em (Elmhamdi et al. 2003), which are well studied Type ii SNe.
We measured the rate of fading of SNe during 4 phases, namely, days 30-100 (plateau phase), 150-300 (radioactive decay phase), 300-800 (dust forming phase), and 800. The results are summarized in Table 5. For each phase, we fit a line to the light-curve, the slope of which is the fading rate for that phase measured in units of magnitude per 100 days. The values indicated by bold face are derived from the data presented in this work. We note that light echoes, which may appear as flattening or increasing fluxes in the lightcurve, could arise during any of these phases depending on the location of the scattering material with respect to the SNe. The lightcurves of Type ii SNe during the radioactive decay phase can be explained by -rays power by the radioactive decay of 56Co to 56Fe, at a rate corresponding to the -folding life time of the 56Co decay ( = 111.3 days). The rate expected for radioactive decay of 56Co into 56Fe is 0.98 mag per 100 days, while the averaged among 8 SNe is 0.960.12 (Patat et al. 1994). For SN 2004et, for example, Sahu et al. (2006) found that the lightcurves in 180-310 days were linear with = 1.04, = 1.01, = 1.07. Maguire et al. (2010) also obtained similar results (1.02, 0.92, 1.09, respectively). Our estimated except for SNe 2002hh and 2005cs are in good agreements with Patat et al. (1994). Two SNe might have additional power sources in this phase (See sections 4.2 for SN 2002hh and 4.5 for SN 2005cs). We find that are 1-1.4 for all objects. Beyond 300 days, the fading rates are steeper than the 56Co decay, because the opacity to -rays is decreased and dust starts forming. This supports SN dust formation theory. We find flattening or increasing magnitude features in SNe 1999bw, 2002hh, 2003gd, 2004et, and 2006bc at the same epoch. We will discuss whether these SNe have light echos based on the surrounding ISM density later.
| SN Name | References |
|---|---|
| SN 1999bw | Li et al. (2002); Smith et al. (2010); This work |
| SN 2002hh | Pozzo et al. (2006); Welch et al. (2007); This work |
| SN 2003gd | Hendry et al. (2005); Maund & Smartt (2009); This work |
| SN 2004et | Fabbri et al. (2011a); Kotak et al. (2009); This work |
| SN 2005cs | Pastorello et al. (2009); Tsvetkov et al. (2006); This work |
| SN 2006bc | Brown et al. (2009); Gallagher et al. (2010); This work |
| SN 1987A | Hamuy & Suntzeff (1990); Walker & Suntzeff (1991) |
| SN 1999em | Elmhamdi et al.(2003) |
| SN 2008S | Botticella et al. (2009);Prieto et al. (2010); This work |
| Epoch | SN1999bw | SN2002hh | SN2003gd | SN2004et | SN2005cs | SN2006bc | SN1987A | SN1999em | |
|---|---|---|---|---|---|---|---|---|---|
| 30-100 | 0.764 | 0.067 | 0.400 | ||||||
| 150-300 | 0.972 | 0.780 | 1.006 | 0.277 | 0.709 | 0.980 | 0.932 | ||
| 300-800 | 1.268 | 1.069 | 0.333 | 1.469 | 0.985 | ||||
| 800 | 0.064 | 0.008 | 0.173 | 0.506 | 0.562 | ||||
| 30-100 | 0.147 | 0.417 | –0.591 | –0.030 | |||||
| 150-300 | 0.971 | 1.211 | 1.014 | 0.684 | 0.855 | 0.945 | |||
| 300-800 | 1.453 | 1.509 | 1.135 | 1.640 | 1.126 | ||||
| 800 | 0.052 | 0.528 | |||||||
| 30-100 | 0.798 | 0.105 | –0.856 | –0.269 | |||||
| 150-300 | 0.968 | 1.295 | 0.918 | 0.771 | 0.669 | 0.946 | |||
| 300-800 | 0.135 | 1.454 | 1.002 | 0.468 | 1.661 | 1.126 | |||
| 800 | 0.049 | 0.052 | 0.126 | 0.565 | |||||
| 30-100 | –0.467 | –1.164 | –0.371 | ||||||
| 150-300 | 1.256 | 1.497 | 1.071 | 1.192 | 1.158 | ||||
| 300-800 | 1.016 | 1.017 | 0.493 | 1.528 | |||||
| 800 | 0.007 | 0.117 | 0.809 | ||||||
| 30-100 | –0.269 | –0.911 | –0.428 | ||||||
| 150-300 | 1.316 | 1.438 | 1.305 | 1.444 | |||||
| 300-800 | 1.098 | 0.555 | 1.386 | ||||||
| 800 | 0.014 | 0.003 | 0.857 | ||||||
| 30-100 | –0.245 | –0.784 | –0.425 | ||||||
| 150-300 | 1.286 | 1.790 | 1.578 | 1.482 | |||||
| 300-800 | 1.177 | 0.493 | 1.594 | ||||||
| 800 | 0.011 | –0.510 | 0.624 |
3. Analysis of late time light curves
In our prior work on the late time light curves of these SNe, we have concentrated on the dust formation process and estimated dust mass as noted in section 4. In this paper, we analyze these light curves for two other quantities: the ejected 56Ni mass (Table 6) and the density of the environment when a light echo is present (Table 8). Table 8 summarizes the derived physical parameters for these SNe including 56Ni mass, the environment density, dust produced and progenitor mass. Below we describe how we calculate the 56Ni mass and the environment density.
3.1. Mass of 56Ni
Here, we focus on the 56Ni mass synthesized in the SN explosion, because we can estimate this mass using bolometric lightcurves during radioactive decay.
The method for 56Ni mass estimation is to (1) determine the bolometric luminosity light curve for the SNe and (2) compare the slope during radioactive decay between targets and a standard SN. Here, we use SN 1987A as a standard. Arnett & Fu (1989) estimated 0.073 0.015 of freshly synthesized 56Ni in SN 1987A by comparing the observed bolometric luminosity curve and theoretical model.
By using simple blackbody fitting techniques, we estimated the luminosity and emitting radius of the hot component (5000 K here). We estimated these three quantities based on . Actually, there are archival data only in very early phase. For SN 2004et, Fabbri et al. (2011) performed multi components blackbody fittings to the and Spitzer IRAC 4 bands and MIPS 24m data. They showed that the percentages of hot component to the total luminosity exceeded 76 from days 64 to 464. We assume that the condition is the same as in the other SNe, i.e., the hot component represented by optical- to near-IR SED is the main component of the bolometric luminosity. Since we are interested in the late epoch spectral energy distributions (SEDs), we selected days 150, 300, and 600. The flux densities at each band are estimated using the fading rate in Table 5. The results of SED fittings are summarized in Table 6. The uncertainties of and are 20 of the estimated values and 500 K.
Next, we estimated the ejected 56Ni mass based on the assumption that the energy source of our sample SNe beyond 150 days is mainly from the power of gamma rays emitted through 56Co to 56Fe radioactive decay. As the ejecta expand, their opacity to -rays is expected to decrease, which results in a modified light curve given by Woosley et al. (1989),
| (2) |
where is the -folding life time of 56Co and the term in the brackets is the effective opacity; = 0.033 cm2 g-1 is the average opacity to 56Co-decay -rays, and = 7104 g cm-2 is the column depth at the fiducial time = 11.6 days. Fitting equation (2) to the estimated bolometric luminosity curve, we can determine the constant for each SN. Assuming that radioactive materials were powering the late time photometric evolution, we estimated the 56Ni mass by comparing the luminosity curves of each SN and SN 1987A by the following equation
| (3) |
If we can estimate luminosities at one epoch during the radioactive decay phase, we can estimate the 56Ni mass in principle. The estimated 56Ni mass is listed in the last column of Table 6. Since several bands are lacking for SN 2006bc during the radioactive decay phase, the estimated 56Ni mass is based only upon the data. Since the quantities for SN 2002hh are derived from the bolometric luminosity and flux densities of the SN and the light echo, the estimated values might have 30 uncertainties. As later discussed, the 56Ni mass of SN 2002hh might go down by 80 (i.e., 2.8 ) when we consider the contribution from the light echo to the total flux.
3.2. Light echoes and environment densities
Light echoes are created when the flash from the SNe scatters off dust in their environments, which can be interstellar or circumstellar. The timing of the light echo depends on the location of the dust with respect to the SN. However, light echoes at late times in the SN light curve are more easy to detect because the increased light due to the SN is more apparent when the SN light has decayed significantly.
The intensity of the light echo depends on the density of the surrounding medium. Using the scattering optical depth of the light echo given by Romaniello et al. (2005),
| (4) | |||||
where = / is the ratio of total neutral hydrogen column density to color excess at solar metallicity (=5.8 1021 cm-2 mag-1; Bohlin et al. 1978), is the duration of the burst of the SN (100 days in the case of Type ii-P), () is the grain albedo (0.6 at optical wavelength; e.g., Mathis et al. 1977). Using equation (2), () is estimated to be 1.20510-4 adopting =0.6 and =100 days. Sparks (1994) argued that the difference between peak () and light echo magnitudes () is
| (5) |
If a light echo is associated with a SN, – 10.3 – 2.5 (H). Using the light curves, we can measure the magnitude difference in SNe with light echoes and estimate the density .
| SN Name | Epoch | (56Ni) | ||||
|---|---|---|---|---|---|---|
| (day) | (106 ) | (K) | (1013 cm) | (10-2 ) | ||
| SN2002hh | 150 | 238 | 5490 | 119 | 14 | |
| 300 | 39.9 | 6170 | 38.6 | |||
| SN2003gd | 300 | 2.4 | 5930 | 10 | 0.8 | |
| SN2004et | 150 | 92.9 | 7040 | 45.1 | 5.9 | |
| 300 | 12.6 | 7200 | 15.9 | |||
| 600 | 0.3 | 6360 | 3.26 | |||
| SN2005cs | 300 | 1.50 | 7250 | 5.41 | 0.5 | |
| SN2006bc | 600 | 0.3 | 6800 | 2.84 | 2.7 | |
| SN1987A | 150 | 86.5 | 6030 | 59.4 | 7.3 | |
| 300 | 25.8 | 7130 | 23.2 | |||
| 600 | 0.4 | 6500 | 3.42 | |||
| SN1999em | 150 | 22.0 | 5560 | 35.2 | 1.9 | |
| 300 | 6.1 | 5220 | 21.1 |
4. Results for individual SNe
4.1. SN 1999bw
SN 1999bw is a Type ii-n SN in NGC 3198 (=13.7 Mpc; Freedman et al. 2001) and was discovered on JD.2451288.7. The position measured from our HST observation is in agreement with Sugerman et al. (2004) within 0.5′′. We detected the light of the SN in F606W and F814W. The optical spectra at early epochs are dominated by emission lines having full width at half maximum (FWHM) of 1000-2000 km s-1 (Garnavich et al. 1999; Filippenko et al. 1999). With Spitzer/IRAC flux densities and the blackbody fitting method, Sugerman et al. (2004) estimated the emitting radius of 1.61016 cm and the expansion velocity of 1000 km s-1 in the fifth year after the initial explosion. Dust production has not been measured for this SN so far, most likely because insufficient data exist for such an estimate. Fabbri (2011b) measured flux densities in 4 Spitzer/IRAC bands (days 3316), IRS-PU 16 m (3331), and MIPS 24 m (3320), as listed in Table LABEL:99bw_tab. Based on her results, we estimated a dust mass of 9.210-5 at a temperature of 300 K at day 3320 using modified blackbody fitting, assuming amorphous carbon grains only with 0.1 m radius. In the fitting, we adopted the optical constants of Zubko et al. (1996). The best fit SED is presented in Fig.4.
Smith et al. (2010) reported magnitudes at the very early plateau phase. They suggested that this object might be an impostor from statistical study of expansion velocities of Type ii SNe and luminous blue variables (LBVs) based on optical spectra. They estimated a peak absolute -band magnitude of –12.65 using optical spectra at day 4, which lies between those of P-Cygni and Carinae. There is no information on the progenitor star. There is no information on the brightness of the SN during days 150-626, so we estimate the -band magnitude decline rate for 800 days. Since the magnitude difference between peak and day 1000 is 6.6, the hydrogen density (H) assuming solar O abundance (8.69; Lodders et al. 2003) is estimated to be 30 cm-3, which is larger than typical interstellar gas densities (1-10 cm-3). We might therefore be looking mostly at pre-existing circumstellar material rather than the ISM.

| Obs.Date | Epoch | Flux density (Jy) | |||||
|---|---|---|---|---|---|---|---|
| (day) | 3.6 m | 4.5 m | 5.8 m | 8.0 m | 16 m | 24 m | |
| 2008/05/13 | 3316 | 10 | 4.00.5 | 213 | 468 | ||
| 2008/05/17 | 3320 | 650 | |||||
| 2008/05/28 | 3331 | 9316 | |||||
4.2. SN 2002hh
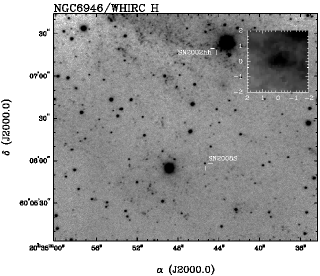
SN 2002hh is a Type ii-P SN in a spiral arm of the starburst galaxy NGC 6946 (=5.9 Mpc; Karachentsev et al. 2000) and was discovered on JD.2452574.5. We detected the light from the SN in , NIRI, and WHIRC observations. The SN birth rate in this galaxy is very high, 0.1 SN yr-1 during the past 100 yr. Within 2 radius from SN 2002hh, SNe 1969P and 2008S were observed (Fig.5). The high SN formation rate could be a natural consequence of the high star forming activity in NGC 6946.
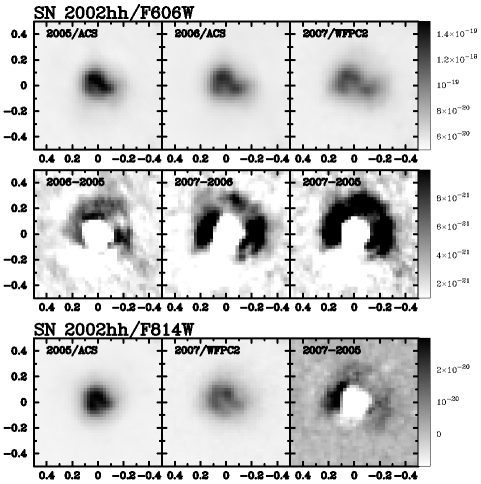
SN 2002hh is still bright and close to peak brightness even after 7 years (Fig.3). While at the early plateau phase around day 150 the fading rate roughly followed the 56Co decay power (0.97 at and and 1.3 at ), the fading rates are 0.1 from day 300 or later. Pozzo et al. (2006) argued that the near-IR excess in this SN is due to an IR light echo from a pre-existing, dusty circumstellar medium. In Fig.6, we show the temporal evolution of the SN at F606W (-band). The 2005 and 2006 images (upper left two panels) were taken by the ACS/HRC. In the middle three panels, we show the subtraction images between two different epochs. Two arc structures are seen and appear to be expanding with time. We interpret these structures as light echoes.
Our formula for the density of the environment depends on the metallicity, here measured as the oxygen (O) abundance. Belley & Roy (1992) investigated the oxygen (O) abundances in 160 H ii regions in NGC 6946 and estimated the O abundance gradient of ((O)/(H))/=–0.089 dex kpc-1, where n(O) and n(H) are the number densities of oxygen and hydrogen and the extrapolated (O)/(H)+12=9.36 and is the distance from the core of the galaxy. SNe 2002hh and 2004et (see below) are located in 5.7 and 8 kpc from the center, respectively. When we adopt the solar O abundance, the O abundances of SNe 2002hh and 2004et are expected to be 8.85 and 8.65, respectively.
Since the difference magnitude between the peak and day 1000 or later is 3.7, 440 cm-3 is required if the light echo is associated with the SN. This hydrogen density is close to relatively dense gas density in such H ii regions rather than that in interstellar space. Welch et al. (2007) suggests that most of the mid-IR flux may have come from dust in the star formation region associated with SN 2002hh precursor. We should note that we measured the magnitude of the SN and the light echo. In the case of SN 2004et, which has the light echo and is a member of NGC 6946, the apparent radius of the SN is 0.1. If we adopted 0.1 radius in aperture photometry for SN 2002hh and we define that the inner radius of light echo is 0.1, 80 of the total flux is from the light echo as of days 1717 (our observations).
Barlow et al. (2005) estimated 0.1-0.15 dust around SN 2002hh after 600 days with radiative transfer modelings based on /IRAC/MIPS. However, the minimum emitting radius 1017 cm is too large for the emitting dust to be forming dust in the SN ejecta. Pozzo et al. (2006) suggest that dust within 1017 cm would be evaporated. Barlow et al. (2005) therefore concluded that the emitting dust must have been pre-existing and its origin may be from an enhanced mass-loss by the 10 progenitor.
4.3. SN 2003gd
SN 2003gd is a Type ii-P SN in NGC 628 (=7.2Mpc; Van Dyk et al. 2003) and was discovered on JD.2452803.2. Van Dyk et al. (2003) and Smartt et al. (2004) identified the progenitor with an F606W image; the progenitor is a 6-12 red supergiant. Maund & Smartt (2009) estimated the and band magnitudes of the progenitor using pre-explosion images from the and Gemini telescope archives. They estimated =25.8 and =23.3 and an initial mass of 6-12 .
The -band fading rates from day 150-300 are comparable with the radioactive decay rate as earlier mentioned. But, in days 300-800, the fading rates are much larger than those supported by the 56Co decay power, indicating that dust formation had started from day 300 or later. Sugerman et al. (2006) estimated the dust mass of 1.710-3 at day 499 (clumped dust distribution model).
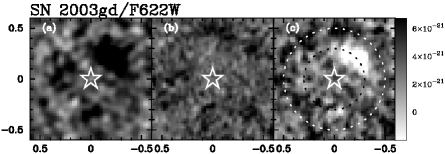
When we focus on day 500 or later, the magnitude is almost constant. This is due to a light echo. Sugerman (2005; 0.225′′ inner and 0.375′′ outer radii at day 632) and Van Dyk et al. (2006; 0.31′′ at the same epoch) found the light echo in the F625W band. We detected an arc shaped light echo with 0.5′′ radius (5.391019 cm at 7.2 Mpc) in the same band as shown in Fig.7. We should note that the shape of the light echo is changing with time. Belley & Roy (1992) measured the O abundances in 130 H ii regions in NGC 628 and estimated the O abundance gradient of ()/=–0.081 dex kpc-1, where the extrapolated +12=9.2 in the galaxy core. When we adopt of 4.5 kpc and =2.32, – 10.6-2.5 (H). Since the difference magnitude between the peak and day 1998 is 10.97, (H) is 1.4 cm-3, which corresponds to a typical interstellar medium density.
4.4. SN 2004et
SN 2004et is a Type ii-P SN in NGC 6946 discovered on JD.2453217.5. We successfully detected the SN at all the observed bands.
The light curves and fading rates at all bands are very similar to those of SNe 1987A and 1999em except for day 1000 or later. Up to 1000 days after the initial explosion, the brightness at both optical and infrared wavelength bands was monotonically fading, but from 1200 days it starts to increase again, in particular in the -band. Our observations were taken just before and after the beginning of this brightening. Kotak et al. (2009) argued that this phenomenon is caused by an interaction between the SN ejecta and the surrounding ISM. On the other hand, Sugerman et al. (in prep.) propose a light-echo as an explanation for the re-brightening. Since the difference of between the plateau and day 1000 is 10.53, (H) is 1.2 cm-3. The magnitude after day 1000 is consistent with the light echo interpretation.
With the bolometric light-curve Sahu et al. (2006) estimated a 56Ni mass of 0.06 . The progenitor mass is 15-24.5 (Li et al. 2005; Utrobin & Chugai 2009). Fabbri et al. (2011a) estimated an SN produced dust mass of 410-4 to 410-3 using SED fits of combined and optical/near-IR data. There are active star forming regions around SN 2004et. Like SNe 2002hh and 2008S (but a SN impostor, see below), the progenitor of SN 2004et would have formed in a metal-rich environment.
| SN | Type | Distance | (56Ni) | ISM dens. | Light | References for | |||
|---|---|---|---|---|---|---|---|---|---|
| Name | (Mpc) | (MW+Host) | () | (10-2 ) | () | (cm-3) | echo? | /(56Ni)/ | |
| 1999bw | ii-n or | 13.7 | 0.01 | ? | ? | 10-4 | 30 | No | (1) |
| impostor | |||||||||
| 2002hh | ii-P | 5.9 | 1.97 | 10 | 14 | 0.1-0.15 | 400 | Yes | (1),(2) |
| 2003gd | ii-P | 7.2 | 0.18 | 6-12 | 0.8 | 410-5-1.710-3 | 1.4 | Yes | (1),(3),(4) |
| 2004et | ii-P | 5.9 | 0.41 | 15-24.5 | 5.9 | 1.510-4- 1.510-3 | 1.2 | Yes | (1),(5),(6),(7) |
| 2005cs | ii-P | 7.1 | 0.14 | 7-12 | 0.5 | 3.110-3 | 0.4 | No | (1),(8),(9),(10) |
| 2006bc | ii-P or ii-L | 16 | 0.52 | 12 | 2.7 | 910-4 | 36 | Yes | (1),(11),(12) |
| 2007it | ii-P | 11.7 | 0.13 | 16-27 | 9 | 10-4 | 19 | Yes | (13) |
| 2007od | ii-P | 24.5 | 0.13 | ? | 0.26 | 410-4 | 3.6 | Yes | (14) |
| 1987A | ii-P | 50 | 0.19 | 16-22 | 7.5 | (3-5)10-4-1.310-3 | 1.5 | Yes | (15) |
| 1999em | ii-P | 7.83 | 0.10 | 12-14 | 1.9 | 110-4 | No | (16),(17) | |
| 2008S | impostor | 5.9 | 0.34a | 6-8 | 0.14 | 0.02 | ? | Yes | (18),(19) |


4.5. SN 2005cs
SN 2005cs is a Type ii-P SN in NGC 5194 (=7.1 Mpc; Takáts & Vinkó 2006) and was discovered on JD.2453550.4. We note that the position measured from the F606W image differs significantly from the position we used for observing, i.e. the SIMBAD position. As a consequence, SN 2005cs was unfortunately on the edge of the field for the observations we report and was entirely missed by our NIC2 measurement in 2008. SN 2005cs is 0.1′′ northeast from the bright cluster (Li et al. 2006). Due to its faintness, we can not detect the SN in the NIC2/F160W and 205W bands.
The fading rate at day 150-300 is much smaller than the 56Co decay power. Pastorello et al. (2009) argued that such flattening could be formed by a radiation flow generated in the warmer inner ejecta, which propagates throughout the transparent cooler external layers, and contributes to the light curve as an additional source. The lightcurves and magnitude decline rates beyond day 300 are comparable to SNe 2004et and 1987A, suggesting that dust formation may have occurred. Fabbri (2011b) gave an upper limit to the dust mass = 3.110-3 (O-rich case) from the detection limit of a Gemini/Michelle 10 m image obtained in 2007 (PI: M.J.Barlow).
Li et al. (2006) detected the progenitor from the ACS images, and they estimated 25.5 and 24.14. Maund et al. (2005) and Li et al. (2006) reported the detection of the progenitor using the archival ACS images. They argued that the progenitor is a 7-12 RSG. Pastorello et al. (2009) obtained similar results (8-15 ). Pastorello et al. (2009) also estimated that the explosion energy is 31050 erg (cf. 1051 erg in typical Type ii SNe) and a 56Ni mass of 2.8-4.2 10-3 . They measured a low expansion velocity (1000-2000 km s-1) in optical and near-IR spectra. The flattening of the light curve in the last two epoch measurements suggests a light echo. Since the difference between the peak and day 1006 is 11.2 in the -band, the ISM density is 0.4 cm-3 assuming that the SN has a light echo and the SN light after day 1006 is partially from the light echo.
4.6. SN 2006bc
SN 2006bc is a Type ii-L (Gallagher et al. 2010) or Type ii-P (Brown et al. 2009) SN in NGC 2397 (=16 Mpc; Mihos & Bothun 1997) and was discovered on JD.2453819.4. The SWIFT telescope detected the SN light at an early epoch and the -magnitude was 17.5 at day 15.8 (Brown et al. 2009). We detected the SN light in all bands. Smartt et al. (2009) give an upper limit of the progenitor mass of 12 for SN 2006bc
SN 2006bc is surrounded by an H ii region; the optical spectra taken by Gemini-N/GMOS show the complex of the SN and H ii region components (Gallagher et al. 2011). Gallagher et al. (2011) extracted the SN component by multi-Gaussian fitting, and they confirmed that the H line profile is blueward shifting as the SN becomes older suggesting dust production. An IR-excess has been measured in the Spitzer IRAC bands and SED fitting by Gallagher et al. (2011) indicates a dust mass of . The fading rates are much smaller than the typical 56Co decay power and our estimated 56Ni mass of 2.710-2 is lower than average in our sample. A flattening of the light curve between days 400 and 500 suggests a short duration light echo. The estimated density of the matter in this light echo is 36 cm-3 from the difference -magnitude = 6.4 between day 15.8 and 694.
4.7. SN Impostor: SN 2008S
SN 2008S is regarded as an SN impostor in NGC 6946 and was discovered around JD.2454498 (Arbour & Boles 2008). by the Galaxy is estimated to be 0.34 from reddening maps of Schlegel et al. (1998). Botticella et al. (2009) estimated the extinction by the host galaxy 1 (1.13 by the Galaxy) by comparing their light echo model with the observed SED at 17 days. In this paper, we corrected only the extinction by the Galaxy with =0.34. Our light curves show that SN 2008S is quite different from Type ii SNe: for example, no plateau phase and no clear level-off around day 100. The nature of the progenitor star is under debating. Botticella et al. (2009) argue that SN 2008S may have evolved from a 6-8 asymptotic giant branch (AGB) star and formed not by Fe-core collapse but O-Ne-Mg core collapse by electron capture during the AGB phase. While, Smith et al. (2010) argue for a high mass progenitor (20 ) for this class of objects such as SN2008S. The 56Ni mass of SN 2008S has the smallest Ni mass estimated for Type ii SNe, the value is 1.4 10-3 (Botticella et al. 2009).
Wesson et al. (2010) estimated the dust mass-loss rate of the progenitor of SN 2008S to be 510-7 yr-1 and a total dust injection into the ISM to be 0.01 . The large infrared excess on day 17 could only be an echo, as there would be no way for dust in the necessary quantity to have formed in such a short time. The SED on day 180 could be well matched by models using the same shell geometry as day 17, without any need for new dust formation.
5. Discussion
In Table 8, we summarize the derived physical quantities of our sample. 56Ni mass (sixth column of this table) and ISM density (eighth column) are from this work. The other quantities are from the literature listed in the last column.
The behaviors of the SN lightcurves are affected mainly by (1) the explosion energy, (2) the ISM density (), and (3) the formed dust mass () in the SNe, because the explosion energy determines the peak luminosity of the SNe, the surrounding ISM density/distribution and the dust affects the lightcurves at 1000 days and at 300 days, respectively. Relations between progenitor mass () and 56Ni mass and explosion energy are known for massive (20 ) Type ii SNe (e.g., Maeda et al. 2010), however, relations among the 56Ni mass, , , and ISM density are unknown for less massive Type ii SNe. Through this work, we have estimated the ISM density and the 56Ni mass for our sample using our data. Using the theoretical radiative transfer code MOCASSIN (Ercolano et al. 2005), we have estimated dust masses for our sample except for SNe 1999bw, 1999em, and 2005cs. The dust masses listed in this table are based on mid-IR data and the value is as of 800 days. Here, we will examine relations among 16Ni mass, , , ISM density, and .
5.1. 56Ni mass vs.
In Fig.8(a), we present the relation between the 56Ni and the progenitor masses . In principal, there is a relationship among the amount of 56Ni yield in stars, the progenitors masses, the initial abundances, and the metallicity. The metallicity of our sample is similar, we assume that the effects of metallicity in nucleosynthesis would be therefore negligible. Maeda et al. (2010) and his colleagues find relationships between the predicted 56Ni mass (of order 10-2 M⊙), the SN progenitor masses, and the kinematic energy of the explosion (1100 1051 erg s-1), however they focused on Type ii SNe evolved from 20-50 progenitors (hypernova). We expected a similar relationship between the 56Ni and progenitor masses in Type ii SNe with progenitor masses of 10-25 . Fig.8(a) strongly supports the previous works. As early mentioned, the estimated 56Ni mass might have large uncertainties. When we exclude the data of SN 2002hh (due to the large uncertainty of the 56Ni mass), (56Ni) represents 0.3110-2 (). The 56Ni mass derived from the bolometric luminosity could be an effective tool to estimate the SN progenitor mass.
5.2. vs.
Fig.8(b) shows the relation between ISM density and the extinction . We added information on SNe 2007it (Andrews et al. 2010) and 2007od (Andrews et al. 2011), which are targets in our SEEDS project. Andrews et al. estimated the nickel mass and dust mass and found the light echo by observations. The ISM densities around SNe 2007it and 2007od are derived by the same way applied to the other SNe, using the difference -band magnitude between plateau and day 922 in 2007od (7.12) and day 811 in 2007it (8.9). For both objects, we assume solar metallicity.
There is no correlation between them. This can be explained by the different light echo geometry (shape, size, and inclination angle, etc.). For example, modeling of the possible light echo geometries in SN 2004et currently suggests an hourglass-shaped nebula similar in size to that discovered around SN 1987A, but oriented such that we are looking down the symmetry axis (Sugerman et al. in prep.).
5.3. 56Ni mass vs.
Fig.8(c) shows the relation between the 56Ni mass and the dust mass . The dust mass in this diagram is the maximum value in an early phase within 1-3yr. If the correlation between the 56Ni and progenitor masses is true and we exclude SN 2002hh, where we observed the pre-existing dust rather than SN origin dust, there is no relation or a very weak relation between the dust and progenitor masses within 30 . This diagram also implies that Type ii origin dust mass ranges from 10-4 upto 10-2 per SN at day 800 despite the progenitor mass.
The origin of dust in high- galaxies is a hotly-debated issue stemming from both observational and theoretical studies since Bertoldi et al. (2003) discovered large amounts of dust (4108 ) in the QSO J1148+5251 (z=6.4, 900 Myr). At the present epoch in our Galaxy, Type ii SNe and AGB stars are the main dust producers (Gehrz et al. 1989). In young galaxies, AGB stars are not likely to contribute significantly to dust production. Such low-mass stars proceed too slowly toward the AGB phase to produce dust within 1 Gyr. For example, 1 single stars with solar metallicity take 10 Gyr to evolve into the thermally pulsing AGB (TP AGB). If the initial mass is 5 , these stars can evolve into TP AGB stars and might be able to be the main dust producers in young galaxies within 1 Gyr (Valiante et al. 2009). However, massive stars can evolve into Type ii SNe in timespans under 20 Myr. Theoretical ISM dust models by Dwek & Cherchneff (2010) predict that an average 20 (initial mass) SN has to make at least 0.1-1 of dust in order to be a viable source for the dust found in the QSO J1148+5251. However, the 56Ni mass- diagram does not follow the prediction by Dwek & Cherchneff (2010).
6. Summary
We performed band photometry of 6 Type ii SNe at late epochs (days 500) using and ground based telescopes to investigate their natures and relations between dust mass, 56Ni, ISM density, and progenitor mass. Most of our observations are successful in detecting the light from the SNe alone and in measuring magnitudes with less contamination from nearby stars. Combining our data with previously published data, we showed lightcurves at -bands and estimate the decline magnitude rates at each band at 4 different phases. These lightcurves and other data indicate that dust is forming in our targets from day 300-400, supporting SN dust formation theory. We estimated the ISM or circumstellar density around SNe 2002hh, 2003gd, 2004et, and 2006bc. The light echo density around SN 2002hh is higher than a typical ISM density. The ISM density around the other SNe is a 1-70 cm-3. We estimated 56Ni masses (0.5-14 10-2 ) by comparing their bolometric luminosity with SN 1987A and we find that it correlates with progenitor mass. This relation supports the work by Maeda et al. (2010), who focus on Type ii hyper SNe (20 ). The dust mass does not appear to be correlated with 56Ni mass among the 7 SNe.
References
- (1) Andrews, J. E., et al. 2010, ApJ, 715, 541
- (2) Andrews, J. E., et al. 2011, ApJ, 731, 47
- (3) Arbour, R., & Boles, T. 2008, Central Bureau Electronic Telegrams, 1234, 1
- (4) Arnett, W. D., & Fu, A. 1989, ApJ, 340, 396
- (5) Barlow, M. J., et al. 2005, ApJ, 627, L113
- (6) Belley, J., & Roy, J.-R. 1992, ApJS, 78, 61
- (7) Bertoldi, F., Cox, P., Neri, R., et al. 2003, A&A, 409, L47
- (8) Bohlin, R. C., Savage, B. D., & Drake, J. F. 1978, ApJ, 224, 132
- (9) Botticella, M. T., et al. 2009, MNRAS, 398, 1041
- (10) Brown, P. J., et al. 2009, AJ, 137, 4517
- (11) Cardelli, J. A., Clayton, G. C., & Mathis, J. S. 1989, ApJ, 345, 245
- (12) Dwek, E. & Cherchneff, I., arXiv1011.1303v1
- (13) Elmhamdi, A., et al. 2003, MNRAS, 338, 939
- (14) Ercolano et al. 2005, MNRAS, 362, 1038
- (15) Ercolano et al. 2007, MNRAS, 375, 753
- (16) Fabbri, J. et al. 2011a, MNRAS in press
- (17) Fabbri, J 2011b, PhD thesis, University College London
- (18) Filippenko, A. V., Li, W. D., & Modjaz, M. 1999, IAU Circ., 7152, 2
- (19) Freedman, W. L., et al. 2001, ApJ, 553, 47
- (20) Gallagher, J. S., et al. 2010, Bulletin of the American Astronomical Society, 41, 359
- (21) Gallagher, J. S., et al. 2011, submitted to ApJ
- (22) Garnavich, P., Jha, S., Kirshner, R., Calkins, M., & Brown, W. 1999, IAU Circ., 7150, 1
- (23) Gehrz, R. 1989, Interstellar Dust, 135, 445
- (24) Hamuy, M., & Suntzeff, N. B. 1990, AJ, 99, 1146
- (25) Hendry, M. A., et al. 2005, MNRAS, 359, 906
- (26) Karachentsev, I. D., Sharina, M. E., & Huchtmeier, W. K. 2000, A&A, 362, 544
- (27) Kotak, R., et al. 2009, ApJ, 704, 306
- (28) Kozasa, T., Nozawa, T., Tominaga, N., Umeda, H., Maeda, K., & Nomoto, K. 2009, Cosmic Dust - Near and Far , 414, 43
- (29) Li, W., Filippenko, A. V., Van Dyk, S. D., Hu, J., Qiu, Y., Modjaz, M., & Leonard, D. C. 2002, PASP, 114, 403
- (30) Li, W., Van Dyk, S. D., Filippenko, A. V., Cuillandre, J.-C., Jha, S., Bloom, J. S., Riess, A. G., & Livio, M. 2006, ApJ, 641, 1060
- (31) Li, W., Van Dyk, S. D., Filippenko, A. V., & Cuillandre, J.-C. 2005, PASP, 117, 121
- (32) Lodders, K. 2003, ApJ, 591, 1220
- (33) Maeda, K., Tominaga, N., Umeda, H., Nomoto, K., & Suzuki, T. 2010, Mem. Soc. Astron. Italiana, 81, 151
- (34) Maguire, K., et al. 2010, MNRAS, 404, 981
- (35) Mathis, J. S., Rumpl, W., & Nordsieck, K. H. 1977, ApJ, 217, 425
- (36) Maund, J. R., Smartt, S. J., & Danziger, I. J. 2005, MNRAS, 364, L33
- (37) Maund, J. R., & Smartt, S. J. 2009, Science, 324, 486
- (38) Meixner, M., et al. 2010, PASP, 122, 451
- (39) Mihos, J. C., & Bothun, G. D. 1997, ApJ, 481, 741
- (40) Pastorello, A., et al. 2009, MNRAS, 394, 2266
- (41) Patat, F., Barbon, R., Cappellaro, E., Turatto, M., 1994, A&A, 282, 731
- (42) Prieto, J. L., Szczygiel, D. M., Kochanek, C. S., Stanek, K. Z., Thompson, T. A., Beacom, J. F., Garnavich, P. M., & Woodward, C. E. 2010, arXiv:1007.0011
- (43) Pozzo, M., et al. 2006, MNRAS, 368, 1169
- (44) Romaniello, M., Patat, F., Panagia, N., Sparks, W. B., Gilmozzi, R., & Spyromilio, J. 2005, ApJ, 629, 250
- (45) Sahu, D. K., Anupama, G. C., Srividya, S., & Muneer, S. 2006, MNRAS, 372, 1315
- (46) Schlegel D. J., Finkelbeiner D. P., & Davis M., 1998, ApJ, 500, 525
- (47) Smith, N. et al. 2010, arXiv:1010.3718v2
- (48) Smartt, S. J., Eldridge, J. J., Crockett, R. M., & Maund, J. R. 2009, MNRAS, 395, 1409
- (49) Smartt, S. J., Maund, J. R., Hendry, M. A., Tout, C. A., Gilmore, G. F., Mattila, S., & Benn, C. R. 2004, Science, 303, 499
- (50) Sparks, W. B. 1994, ApJ, 433, 19
- (51) Sugerman, B., Meixner, M., Fabbri, J., & Barlow, M. 2004, IAU Circ., 8442, 2
- (52) Sugerman, B. E. K., et al. 2006, Science, 313, 196
- (53) Sugerman, B. E. K. 2005, ApJ, 632, L17
- (54) Takáts, K., & Vinkó, J. 2006, MNRAS, 372, 1735
- (55) Tsvetkov, D. Y., Volnova, A. A., Shulga, A. P., Korotkiy, S. A., Elmhamdi, A., Danziger, I. J., & Ereshko, M. V. 2006, A&A, 460, 769
- (56) Utrobin, V. P., & Chugai, N. N. 2009, A&A, 506, 829
- (57) Van Dyk, S. D., Li, W., & Filippenko, A. V. 2006, PASP, 118, 351
- (58) Van Dyk, S. D., Li, W., & Filippenko, A. V. 2003, PASP, 115, 1289
- (59) Valiante, R., Schneider, R., Bianchi, S., & Andersen, A. C. 2009, MNRAS, 397, 1661
- (60) Walker, A. R., & Suntzeff, N. B. 1991, PASP, 103, 958
- (61) Welch, D. L., Clayton, G. C., Campbell, A., Barlow, M. J., Sugerman, B. E. K., Meixner, M., & Bank, S. H. R. 2007, ApJ, 669, 525
- (62) Wesson, R., et al. 2010, MNRAS, 403, 474
- (63) Wooden, D. H., Rank, D. M., Bregman, J. D., Witteborn, F. C., Tielens, A. G. G. M., Cohen, M., Pinto, P. A., & Axelrod, T. S. 1993, ApJS, 88, 477
- (64) Woosley S. E., Hartmann D., Pinto P. A., 1989, ApJ, 346, 395
- (65) Zubko, V. G., Mennella, V., Colangeli, L., & Bussoletti, E. 1996, MNRAS, 282, 1321