Temperature dependence of structural and electronic properties of the spin-liquid candidate -(BEDT-TTF)2Cu2(CN)3
Abstract
We investigate the effect that the temperature dependence of the crystal structure of a two dimensional organic charge-transfer salt has on the low-energy Hamiltonian representation of the electronic structure. For that, we determine the crystal structure of -(BEDT-TTF)2Cu2(CN)3 for a series of temperatures between K and 300 K by single crystal X-ray diffraction and analyze the evolution of the electronic structure with temperature by using density functional theory and tight binding methods. We find a considerable temperature dependence of the corresponding triangular lattice Hubbard Hamiltonian parameters. We conclude that even in the absence of change of symmetry, the temperature dependence of quantities like frustration and interaction strength can be significant and should be taken into account.
pacs:
71.15.Mb, 75.10.Jm, 61.05.cp, 61.66.HqI Introduction
The two-dimensional organic charge-transfer salts based on bis(ethylenedithio)tetrathiafulvalene (BEDT-TTF or even shorter ET) molecules in a -type lattice arrangement have been intensively studied over the past thirty years due to their complex interplay between electron correlation and the effects of low dimensionality and spin frustration. Kanoda11 In particular, the discovery of spin-liquid behavior in -(BEDT-TTF)2Cu2(CN)3 Shimizu03 has fascinated experimentalists and theorists alike. Issues of current interest concern the nature of the low-temperature spin-liquid realized in this material SYamashita08 ; MYamashita08 ; Pratt11 and the various anomalies observed upon approaching the spin-liquid state from high temperatures. These anomalies include drastic changes in the 1H-NMR relaxation rate around 200-150 K Kurosaki05 , the thermopower at 150 K Komatsu96 , relaxor-type ferroelectricity around 60 K Abdel10 and a mysterious phase-transition anomaly at 6 K Manna10 . The latter feature, which manifests itself in anomalies in thermodynamic SYamashita08 ; Shimizu03 and transport MYamashita08 quantities, is accompanied by pronounced lattice effects. Manna10 Various scenarios have been suggested for the 6 K anomaly including a crossover from a thermally to a quantum disordered state SYamashita08 , an instability of the quantum spin-liquid SYamashita08 ; Baskaran89 ; Liu05 ; Kyung06 ; Grover10 ; Lee07 ; Galitski07 ; Kawamura84 or a distinct type of charge ordering. Li10 Theoretically, the spin-liquid properties have been investigated on the basis of the anisotropic triangular-lattice Hubbard Hamiltonian. Kyung06 ; Mizusaki06 ; Tocchio09 ; Yang10 ; Balents10 The parameters , and of this Hamiltonian have been determined with semi-empirical Komatsu96 as well as first principles methods Kandpal09 ; Nakamura09 based on the experimental structure at room temperature. Missing in such investigations is, however, the consideration of a possible temperature dependence of the model parameters.
In this work, we find by a combination of single crystal X-ray diffraction at various temperatures and density functional theory calculations that even in the absence of structural phase transitions, the temperature dependence of the structural parameters is significant enough to influence the electronic behavior and the determination of the Hamiltonian model parameters in -(BEDT-TTF)2Cu2(CN)3. We suggest that this has subtle effects on the degree of frustration and interaction strength.
In 1991, the crystal structure of -(BEDT-TTF)2Cu2(CN)3 was first reported, Geiser91 and the unit cell parameters confirmed, Komatsu91 on twinned crystals at room temperature. The crystal structure was redetermined in 1993, also on a twinned crystal at room temperature. Papavassiliou93 The crystal structure of the very similar -(BEDT-TTF)2Cu2(CN)3 structure, which is reported to be an ambient pressure superconductor, was described in 1992. Yamochi92 ; Yamochi93 The crystal structure of the phase was subsequently redetermined in 1997, Bu97 and the unit cell redetermined in 2001, both at room temperature. Drozdova01 Already in 1991, the unit cell parameters were reported at 300 and 30 K, with , , and , and . Bu93 Our comparable contraction values between 300 and 20 K are , , and , and and agree well with the previous results. In addition, we find evidence for an ordering of the ethylene groups in a staggered conformation between 200-150 K. Despite the current interest in this material as a spin-liquid candidate, no low-temperature structural determinations have yet been reported. Herein, we present a detailed characterization of the crystal structure as function of temperature determined on a single crystal with agreement factors better than any previously reported.
II Single crystal X-ray diffraction
A black, plate-like crystal of -(BEDT-TTF)2Cu2(CN)3 with dimension mm3 was placed onto the tip of a glass fiber and mounted on a Bruker APEX II 3-circle diffractometer equipped with an APEX II detector. Temperature control in the 100-300 K region was provided by an Oxford Cryostream 700 Plus Cooler while below 100 K it was provided by a Cryocool-LHE cryogenic system (Cryo Industries of America). The sample temperature below 100 K was confirmed by installing a Cernox thermometer (Lakeshore) in the immediate vicinity of the crystal and stabilizing the temperature immediately prior to data collection. In order to reduce adverse thermal effects the thermometer wires (twisted manganin wires, 0.5 mm diameter, supplied by Lakeshore) were anchored on the surfaces of the cryostat exposed to 4He stream. The data were collected using MoKα radiation ( Å) with a detector distance of 50 mm. Unit cell parameters were determined upon cooling in 10 K increments between 100 and 290 K, with a frame exposure time of 10 seconds. Full data sets for structural analysis were collected at temperatures of 5, 20, 100, 150, 200, 250 and 300 K. The uncertainties in the temperature determination are typically K down to 100 K, while for the 20 K and 5 K data points an error bar of K has to be accepted. These data collections nominally covered over a hemisphere of reciprocal space by a combination of three sets of exposures. Data to a resolution of 0.68 Å were considered in the reduction. The raw intensity data were corrected for absorption (SADABS Sheldrick01a ). The structure was solved and refined using SHELXTL. Sheldrick01b A direct-method solution was calculated, which provided most of atomic positions from the E-map. Full-matrix least squares / difference Fourier cycles were performed, which located the remaining atoms. All non-hydrogen atoms were refined with anisotropic displacement parameters. The hydrogen atoms were placed in ideal positions and refined as riding atoms with relative isotropic displacement parameters.
| 300 K | 250 K | 200 K | 150 K | 100 K | 20 K | 5 K | |
| (Å) | 16.0919(3) | 16.0848(3) | 16.0781(3) | 16.0703(3) | 16.0746(6) | 16.072(4) | 16.062(3) |
| (Å) | 8.5722(2) | 8.5749(1) | 8.5737(1) | 8.5664(2) | 8.5593(3) | 8.536(2) | 8.544(2) |
| (Å) | 13.3889(2) | 13.3373(2) | 13.2964(2) | 13.2698(3) | 13.2678(5) | 13.262(3) | 13.271(2) |
| (∘) | 113.406(1) | 113.853(1) | 114.273(1) | 114.609(1) | 14.852(1) | 115.088(3) | 115.093(2) |
| (Å3) | 1694.93(6) | 1682.43(4) | 1670.86(4) | 1660.72(6) | 1656.51(1) | 1647.8(6) | 1649.3(5) |
| (g/cm | 1.909 | 1.923 | 1.937 | 1.949 | 1.954 | 1.964 | 1.962 |
| (mm | 2.266 | 2.283 | 2.299 | 2.313 | 2.319 | 2.331 | 2.329 |
| GoF | 1.057 | 1.053 | 1.091 | 1.157 | 1.293 | 1.261 | 1.109 |
| 0.0311 | 0.0269 | 0.0238 | 0.0225 | 0.0220 | 0.0182 | 0.0204 | |
| 0.0838 | 0.0735 | 0.0654 | 0.0627 | 0.0629 | 0.0503 | 0.0515 | |
| staggered (%) | 77 | 86 | 93 | 100 | 100 | 100 | 100 |
| (Å) | 0.050 | 0.056 | 0.064 | 0.069 | 0.073 | 0.072 | 0.072 |
| ET tilt angle | 66.55 | 66.25 | 66.00 | 65.79 | 65.64 | 65.53 | 65.52 |
| 3.558 | 3.538 | 3.518 | 3.500 | 3.488 | 3.470 | 3.473 |
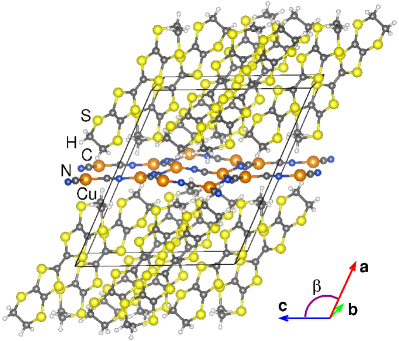
As a representative example, in Fig. 1 we show the structure of -(BEDT-TTF)2Cu2(CN)3 at a temperature of K. In the plane, the BEDT-TTF molecules form their typical -type arrangement. One of the cyanide (CN-) groups resides on an inversion center, thus requiring it to be disordered with a 50% carbon and 50% nitrogen distribution on these two atomic positions Geiser91 . Analysis of the low-temperature structural data (see Tab. 1) indicates that overall, , and -axes decrease with temperature while the angle increases monotonically upon cooling. We find that the orthogonal projection of the -axis, , has the greatest relative contraction with temperature. One ethylene group is disordered at room temperature with a staggered conformation 77% of the time. As the temperature is lowered, the ethylene group remains partially disordered down to a temperature of 200 K and is fully ordered in a staggered conformation at 150 K. The anion layer becomes slightly more buckled at low temperature: at room temperature, the Cu1 atom lies 0.050 Å out of the C11-C12-N12 plane, increasing to 0.072 Å at low temperature. For the purpose of performing density functional theory calculations, the original symmetry of has been lowered to by choosing one of two possible orientations of the CN- group in the inversion center.
III Temperature-dependent structural parameters
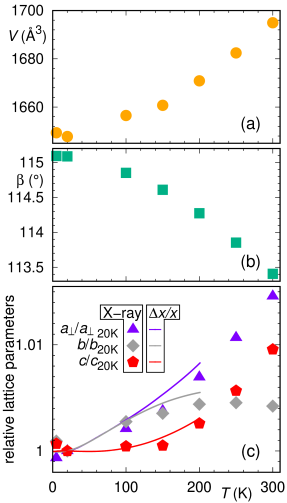
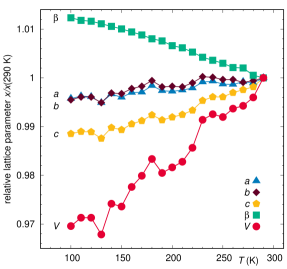
In Fig. 2, we show the evolution of the lattice parameters with temperature. Over the large investigated temperature range from K down to K, the volume is monotonously decreasing with temperature (see Fig. 2 (a)). The monoclinic angle between and lattice vectors (see Fig. 2 (b)) first rapidly increases upon cooling down to a temperature of K, below which it increases more gradually. In Fig. 2 (c), the lattice parameters are displayed as symbols, normalized by their values at K (see Tab. 1). We also include the relative and lattice constants along the two principal axes as obtained by thermal expansion measurements in Refs. Manna10, and deSouza08, . The out-of-plane expansivity data shown there were taken in a direction perpendicular to the plane. They are show together with the corresponding quantity from the X-ray diffraction measurement, .
IV Temperature-dependent electronic structure
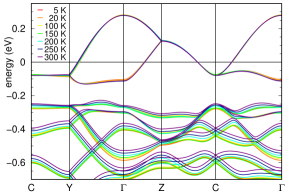
In the following, we determine the electronic properties for the resolved crystal structures at different temperatures by employing the all-electron full-potential local orbitals (FPLO) Koepernik99 basis. We perform all calculations on a mesh with a generalized gradient approximation functional. Perdew96 In Fig. 3 we present the electronic band structures for the various crystal structures. In the calculation, we used the staggered (majority) conformation of the BEDT-TTF molecules at all temperatures. The changes as function of temperature for the two bands at the Fermi level, corresponding to the antibonding combinations of the BEDT-TTF highest occupied molecular orbital (HOMO) levels, are relatively small. On the other hand, the occupied bands down to eV below the Fermi level show a significant dependence on temperature. These bands derive from the bonding combination of BEDT-TTF HOMO levels and from the anion layer. Overall, these bands show a bandwidth that decreases with increasing temperature. This can be explained by the volume increase as function of temperature (see Fig. 2 (a)).
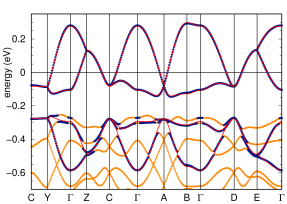
Further analysis of the electronic structure requires a reliable identification of the bands deriving from the BEDT-TTF molecules. For that purpose, band weights have been calculated for all structures and added up for all atoms corresponding to the BEDT-TTF cation layers and to the anion layers, respectively. In Fig. 4, blue circles and orange triangles stand for a predominance of BEDT-TTF weight and weight, respectively. This identification allows us to fit the BEDT-TTF derived bands to a tight binding Hamiltonian
| (1) |
where () create (annihilate) an electron with spin at site ; the sites correspond to the positions of the BEDT-TTF molecules, shown as balls in Fig. 5. While a good overall fit of the band structure can be achieved by including six neighbor BEDT-TTF molecule distances up to Å, a very good fit describing also the small dispersion along the direction, as shown by lines in Fig. 4, requires fourteen neighbor distances up to Å.
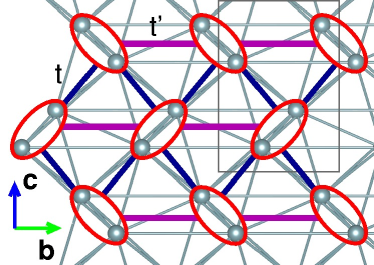
We now proceed to analyze the temperature dependence of the tight binding parameters corresponding to the network of BEDT-TTF dimers that are highlighted in Fig. 5. These dimers form a triangular lattice, with the hopping parameter connecting dimers to chains along the direction and the hopping parameter forming the connections in direction. We are interested in estimating the parameters of the Hubbard Hamiltonian for the anisotropic triangular lattice
| (2) |
where and indicate summations over nearest and next-nearest neighbors, respectively. and can be obtained from the molecular overlap integrals to by considering the geometrical formulas
| (3) |
For the definition of the overlap integrals , see Ref. Kandpal09, . Note that inclusion of longer-range hopping into these formulas (for example including into ) has no influence on the results reported in the following.
V Discussion
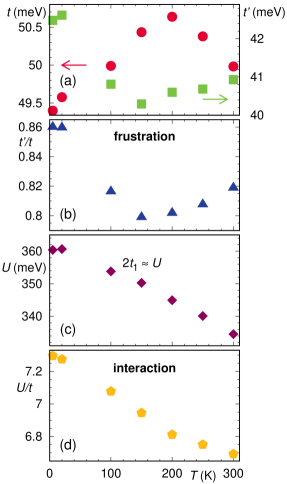
Fig. 6 summarizes our findings from the tight binding analysis. The nearest-neighbor hopping parameters , forming a square lattice, increase upon cooling down to a temperature of K, then decrease again (see Fig. 6 (a)). The frustrating hopping parameters show the opposite behavior as a function of temperature, decreasing upon cooling down to a temperature of K, then increasing. Interestingly, these two effects enhance each other when we consider their ratio as shown in Fig. 6 (b)). which quantifies the degree of frustration in the system decreases from at K to at K, then increases to a maximum value of at K. A rough estimate for the Coulomb interaction strength can also be extracted from the dimer approximation where is the BEDT-TTF intradimer hopping integral (see Fig. 6 (c)). We find that the measure of the interaction strength estimated in this way monotonously falls by 7% as the temperature is increased from K to K.
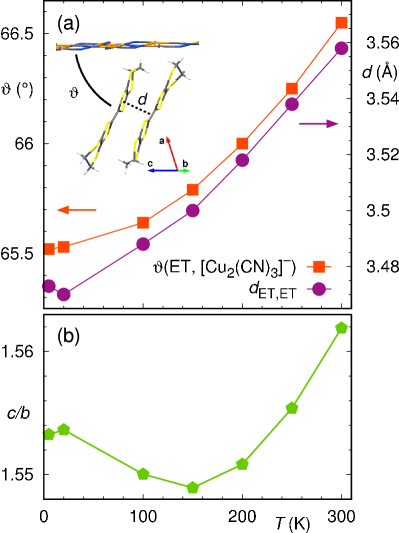
In order to rationalize the observed temperature dependence of the Hamiltonian parameters in (2) we analyze the crystal structure in more detail. For that purpose, we determined the orientation of the BEDT-TTF molecules in space by finding the plane of the TTF part of the molecule and measuring its angle with respect to the plane, cf. inset of Fig. 7. This yields the inclination of the BEDT-TTF molecules against the anion layer shown as squares in Fig. 7 and the intradimer distance shown as circles (see also Table 1). Both quantities show a nearly monotonous increase over the studied temperature range. The decreasing intradimer distance explains the increase of the intradimer hopping integral with decreasing temperature. Apparently, the nonmonotonous evolution of the overlap integrals , , especially the distinct extrema in both quantities around 150 K to 200 K, has to be of different origin.
The overall trend can be understood by considering the temperature dependence of the lattice parameters; from Fig. 5 it is clear that changes in the lattice parameter should have an impact on , while changes in should affect . In Fig. 7 (b), we see that the lattice parameter ratio decreases with temperature down to K, then increases with falling temperature until K. This has an immediate impact on the degree of frustration as it should be approximately proportional to the ratio. Indeed, comparison of Fig. 6 (b) and Fig. 7 (b) confirms this expectation and thus explains the nonmonotonous temperature dependence of the frustation.
An increasing frustration upon cooling, reaching values at low temperatures in excess of those at room temperature, is an interesting finding which may help to better understand the intriguing low-temperature magnetic and dielectric properties of this material. Here we mention the distinct types of charge ordering, accompanied by dielectric anomalies, proposed in Ref. Li10, for the present material as a result of an increasing degree of frustration.
The nonmonotonous evolution of the in-plane distortion , which adopts a minimum around 150 K, might be related to the ordering of the ethylene groups, uncovered in the present study. note According to our structural analysis, the fraction of ethylene groups, ordered in the staggered conformation, gradually grows from 77% at room temperature over 86% at 250 K to 93% at 200 K. For temperatures below 150 K, the ordering is complete within the accuracy of our analysis/refinement. The large step size of 50 Kelvin employed in this study does not allow to determine the ordering temperature more precisely. Likewise, we cannot say whether or not the ordering occurs continuously or sets in abruptly. An argument in favour of the latter possibility might be derived from a small step-like feature revealed in thermal expansion measurements around 150 K, see the out-of plane data shown in Fig. 1 of Ref. Manna10, . We stress, that a fully ordered staggered ethylene conformation below 150 K and a progressively disordered state above 200 K, is fully consistent with the anomalous behavior revealed by 1H-NMR measurements between 150-200 K. Kurosaki05 The strong increase in above 200 K was attributed to thermally activated vibrations of ethylene groups. Kurosaki05 We suggest that the nonmonotonous temperature dependence in might also be related to the drastic change in the thermopower around 150 K. Komatsu96 The thermopower is related to the energy derivative of the density of states at the Fermi level. Miyake05 However, for a strongly correlated system like -(BEDT-TTF)2Cu2(CN)3, density functional theory is not sufficient for the calculation of this quantity and more elaborate many-body calculations – which are beyond the scope of the present study – have to be done.
In summary, we performed an analysis of the temperature dependence of the structural and electronic properties of -(BEDT-TTF)2Cu2(CN)3 by considering a combination of X-ray diffraction at various temperatures and density functional calculations. Our study shows that the temperature dependence of the structural parameters has significant influence on the electronic properties and results in a nonmonotonous behavior of the degree of frustration. Of special relevance is the increase of frustration at low temperatures in comparison to the behavior at room temperature.
Acknowledgements.
This work was supported by UChicago Argonne, LLC, Operator of Argonne National Laboratory (“Argonne”). Argonne, a U.S. Department of Energy Office of Science laboratory, is operated under Contract No. DE-AC02-06CH11357. We also acknowledge support by the Deutsche Forschungsgemeinschaft (SFB/TR 49) and by the Helmholtz Association through HA216/EMMI.Appendix A Additional crystallographic material
Crystallographic data for the -(BEDT-TTF)2Cu2(CN)3 structure at 5, 10, 100, 150, 200,
250 and 300 K has been deposited with the Cambridge Crystallographic
Data Centre as supplementary publication nos. CCDC 850022 to
850028. Copies of the data can be obtained free of charge on
application to CCDC, 12 Union Road, Cambridge CB2 1EZ, UK (fax: (44)
1223 336-033; e-mail: data_request@ccdc.cam.ac.uk).
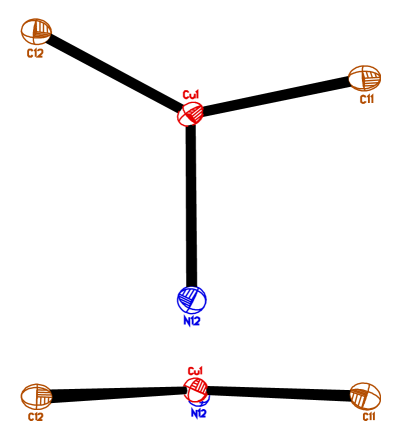
Fig. 8 illustrates geometry of the anion laywer and the slight deviation from planarity. Fig. 9 and Table 2 contain lattice parameters determined at 10 K intervals between 290 K and 100 K.
| T (K) | (Å) | (Å) | (Å) | (∘) | (Å3) |
|---|---|---|---|---|---|
| 290 | 16.248 | 8.655 | 13.516 | 113.56 | 1742 |
| 280 | 16.231 | 8.650 | 13.491 | 113.62 | 1735 |
| 270 | 16.235 | 8.647 | 13.483 | 113.79 | 1732 |
| 260 | 16.226 | 8.652 | 13.475 | 113.80 | 1731 |
| 250 | 16.227 | 8.652 | 13.463 | 113.90 | 1728 |
| 240 | 16.237 | 8.656 | 13.463 | 113.97 | 1729 |
| 230 | 16.234 | 8.657 | 13.453 | 114.04 | 1727 |
| 220 | 16.214 | 8.646 | 13.426 | 114.16 | 1717 |
| 210 | 16.207 | 8.639 | 13.414 | 114.26 | 1712 |
| 200 | 16.203 | 8.640 | 13.407 | 114.31 | 1710 |
| 190 | 16.205 | 8.639 | 13.399 | 114.42 | 1708 |
| 180 | 16.222 | 8.650 | 13.413 | 114.47 | 1713 |
| 170 | 16.200 | 8.640 | 13.397 | 114.56 | 1707 |
| 160 | 16.199 | 8.636 | 13.388 | 114.63 | 1703 |
| 150 | 16.183 | 8.627 | 13.372 | 114.70 | 1696 |
| 140 | 16.194 | 8.628 | 13.378 | 114.76 | 1697 |
| 130 | 16.165 | 8.611 | 13.348 | 114.82 | 1686 |
| 120 | 16.185 | 8.621 | 13.366 | 114.88 | 1692 |
| 110 | 16.187 | 8.621 | 13.367 | 114.90 | 1692 |
| 100 | 16.179 | 8.616 | 13.361 | 114.96 | 1689 |
References
- (1) Present address: Departamento de Física, IGCE, Unesp - Universidade Estadual Paulista, Caixa Postal 178, CEP 13500-970, Rio Claro (SP), Brazil.
- (2) K. Kanoda and R. Kato, Annu. Rev. Condens. Matter Phys. 2, 167 (2011).
- (3) Y. Shimizu, K. Miyagawa, K. Kanoda, M. Maesato, and G. Saito, Phys. Rev. Lett. 91, 107001 (2003).
- (4) S. Yamashita, Y. Nakazawa, M. Oguni, Y. Oshima, H. Jojiri, Y. Shimizu, K. Miyagawa, and K. Kanoda, Nature Phys. 4, 459 (2008).
- (5) M. Yamashita, N. Nakata, Y. Kasahara, T. Sasaki, N. Yoneyama, N. Kobayashi, S. Fujimoto, T. Shibauchi, and Y. Matsuda, Nature Phys. 5, 44 (2008).
- (6) F. L. Pratt, P. J. Baker, S. J. Blundell, T. Lancaster, S. Ohira-Kawamura, C. Baines, Y. Shimizu, K. Kanoda, I. Watanabe, and G. Saito, Nature 471, 612 (2011).
- (7) Y. Kurosaki, Y. Shimizu, K. Miyagawa, K. Kanoda, and G. Saito, Phys. Rev. Lett. 95, 177001 (2005).
- (8) T. Komatsu, N. Matsukawa, T. Inoue, and G. Saito, J. Phys. Soc. Jpn. 65, 1340 (1996).
- (9) M. Abdel-Jawad, J. Terasaki, T. Sasaki, N. Yoneyama, N. Kobayashi, Y. Uesu, and C. Hotta, Phys. Rev. B 82, 125119 (2010).
- (10) R. S. Manna, M. de Souza, A. Brühl, J. A. Schlueter, and M. Lang, Phys. Rev. Lett. 104, 016403 (2010).
- (11) G. Baskaran, Phys. Rev. Lett. 63, 2524 (1989).
- (12) J. Liu, J. Schmalian, and N. Trivedi, Phys. Rev. Lett. 94, 127003 (2005).
- (13) B. Kyung and A.-M. S. Tremblay, Phys. Rev. Lett. 97, 046402 (2006).
- (14) T. Grover, N. Trivedi, T. Senthil, and P. A. Lee, Phys. Rev. B 81, 245121 (2010).
- (15) S.-S. Lee, P. A. Lee, and T. Senthil, Phys. Rev. Lett. 98, 067006 (2007).
- (16) V. Galitski and Y. B. Kim, Phys. Rev. Lett. 99, 266403 (2007).
- (17) H. Kawamura and S. Miyashita, J. Phys. Soc. Jpn. 53, 4138 (1984).
- (18) H. Li, R.T. Clay, and S. Mazumdar, J. Phys.: Condens. Matter 22, 272201 (2010).
- (19) T. Mizusaki and M. Imada, Phys. Rev. B 74, 014421 (2006).
- (20) L. F. Tocchio, A. Parola, C. Gros, and F. Becca, Phys. Rev. B 80, 064419 (2009).
- (21) H.-Y. Yang, A. M. Läuchli, F. Mila, and K. P. Schmidt, Phys. Rev. Lett. 105, 267204 (2010).
- (22) L. Balents, Nature 464, 199 (2010).
- (23) H. C. Kandpal, I. Opahle, Y.-Z. Zhang, H. O. Jeschke, and R. Valentí, Phys. Rev. Lett. 103, 067004 (2009).
- (24) K. Nakamura, K. Nakamura, Y. Yoshimoto, T. Kosugi, R. Arita, and M. Imada, J. Phys. Soc. Jpn. 78, 083710 (2009).
- (25) U. Geiser, H. H. Wang, K. D. Carlson, J. M. Williams, H. A. J. Charlier, J. E. Heindl, G. A. Yaconi,B. J. Love, M. W. Lathrop, J. E. Schirber, D. L. Overmyer, J. Ren, and M.-H. Whangbo, Inorg. Chem. 30, 2586 (1991).
- (26) T. Komatsu, T. Nakamura, N. Matsukawa, H. Yamochi, G. Saito, H. Ito, T. Ishiguro, M. Kusunoki, and K.-I. Sakaguchi, Solid State Commun. 80, 843 (1991).
- (27) G. C. Papavassiliou, D. J. Lagouvardos, A. Terzis, J. Amiell, C. Garrigou-Lagrange, P. Delhaes, B. Hilti, J. Pfeiffer, Synth. Met. 61, 267 (1993).
- (28) H. Yamochi, T. Nakamura, T. Komatsu, N. Matsukawa, T. Inoue, G. Saito, T. Mori, M. Kusunoki, K.-I. Sakaguchi, Solid State Commun. 82, 101 (1992).
- (29) H. Yamochi, T. Komatsu, N. Matsukawa, G. Saito, T. Mori, M. Kusunoki, and K. Sakaguchi, J. Am. Chem. Soc. 115, 11319 (1993).
- (30) X. H. Bu and P. Coppens, Z. Kristallogr. 212, 103 (1997).
- (31) O. Drozdova, G. Saito, H. Yamochi, K. Ookubo, K. Yakushi, M. Uruichi, and L. Ouahab, Inorg. Chem. 40, 3265 (2001).
- (32) X. Bu, A. Frost-Jensen, R. Allendoerfer, P. Coppens, B. Lederli, and M. J. Naughton, Solid State Commun. 79, 1053 (1991).
- (33) G. M. Sheldrick, SADABS, Version 2.03a, Bruker AXS, Inc., Madison, WI, USA, 2001.
- (34) G. M. Sheldrick, SHELXTL, Version 6.12, Bruker AXS Inc., Madison, WI, USA, 2001.
- (35) M. de Souza, Dissertation Frankfurt University 2008, http://publikationen.ub.uni-frankfurt.de/volltexte/2009/6240/
- (36) K. Koepernik and H. Eschrig, Phys. Rev. B 59, 1743 (1999).
- (37) J. P. Perdew, K. Burke, and M. Ernzerhof, Phys. Rev. Lett. 77, 3865 (1996).
- (38) Note that even though all our DFT calculations were performed considering ordered ethylene groups, they capture the effects of the ethylene ordering through the changes caused on the structural parameters.
- (39) K. Miyake and H. Kohno, J. Phys. Soc. Jpn. 74, 254 (2005).