Heavy Fermion superconductor CeCu2Si2 under high pressure:
multiprobing the valence cross-over
Abstract
The first heavy fermion superconductor CeCu2Si2 has not revealed all its striking mysteries yet. At high pressures, superconductivity is supposed to be mediated by valence fluctuations, in contrast to ambient pressure, where spin fluctuations most likely act as pairing glue. We have carried out a multiprobe (electric transport, thermopower, ac specific heat, Hall and Nernst effects) experiment up to on a high quality CeCu2Si2 single crystal. For the first time, the resistivity data allow quantitatively to draw the valence cross-over line within the plane, and to locate the critical end point at and a slightly negative temperature. In the same pressure region, remarkable features have also been detected in the other physical properties, presumably acting as further signatures of the Ce valence cross-over and the associated critical fluctuations: we observe maxima in the Hall and Nernst effects, and a sign-change and a strong sensitivity on magnetic field in the thermopower signal.
pacs:
74.70.Tx, 74.62.Fj, 74.25.fc, 74.25.fgI Introduction
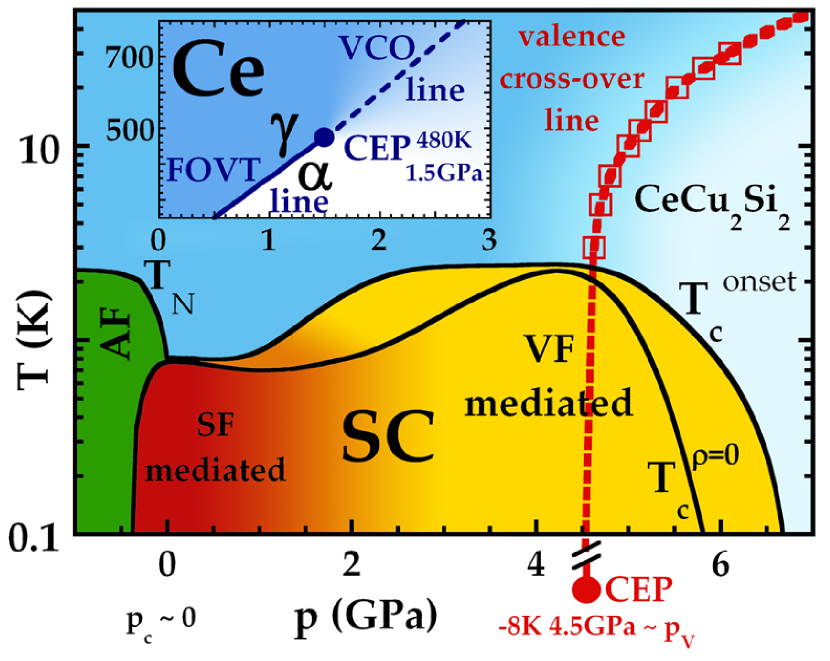
Even though investigations started already in 1979 Steglich et al. (1979), CeCu2Si2 still carries key enigmas of heavy fermion (HF) superconductivity (SC). Numerous (pressure) studies on other Ce-based HF compounds, notably concerning the 115-family, focus on the magnetic instability or magnetic quantum critical point as a driving force for exotic behaviors such as unconventional SC. However, in reference to the case of elementary Ce, it is known that the Ce valence changes with pressure (delocalization of the electron) and that this effect may also play a major role in the determination of electronic properties. As a consequence, observations in Ce compounds may result from a complex combination of different underlying microscopic phenomena. In this respect, CeCu2Si2 may be a good candidate to help to disentangle the contributions from the spin and charge degrees of freedom, more intricate in other Ce systems (like the 115-family). In particular, the pressure () - temperature () phase diagram (fig. 1) of CeCu2Si2 deviates from the “generic” one in which superconductivity (SC) emerges rather close to a magnetic instability, presumably mediated by critical spin fluctuations (SF). Instead, in CeCu2Si2 the superconducting region extends far beyond the magnetic quantum critical point (located at GPa), and exhibits an enhanced transition temperature () culminating at K around GPa Jaccard et al. (1985, 1999); Holmes et al. (2004, 2007). The most elaborate scenario Miyake (2007); Watanabe and Miyake (2011) invokes critical charge or valence fluctuations (VF) associated with an underlying valence transition (VT), i.e. delocalization of the Ce electron when tuning across the critical region (). In elementary Ce (see inset of fig. 1), the first-order valence transition (FOVT) line ( transition), the location of its critical end point (CEP) and the valence cross-over (VCO) line have been unambiguously identified by several experiments Jayaraman (1965); Lipp et al. (2008). In CeCu2Si2, obviously the CEP lies at much lower , where the electron delocalization is accompanied in the transport data by a decrease in resistivity, in combination with SC at the lowest . Preceding experiments point towards distinct natures of the two sc phases Holmes et al. (2004); Miyake (2007) (related to and respectively), and have unveiled close to features peculiar to the concept of critical VF, such as a -linear resistivity and an increased residual resistivity Jaccard et al. (1999); Holmes et al. (2007). Despite such compelling indications for the presence of critical VF in proximity to a CEP, additional signatures of the putative VT are still highly desirable, in order to consolidate the decisive role of the electron delocalization in the properties of CeCu2Si2, and accordingly in other Ce-based compounds.
This challenge is strongly constrained by the necessity of both extreme and reliable conditions. Here we report for the first time on a multiprobe experiment under high pressure, sensing simultaneously electric resistivity , Hall and Nernst effect, thermopower and ac specific heat on the very same CeCu2Si2 single crystal. Based on the resistivity data, we find that the VT is just missed in CeCu2Si2, with a CEP at slightly negative , and suggest a simple method to track the valence cross-over within the plane. More strikingly, it is possible to understand the complete set of low resistivity data as governed by the existence of the CEP via a simple scaling analysis. In addition, anomalies in the -dependence of , and close to are uncovered and appear intimately related to the Ce valence cross-over (VCO).
II Experiment and sample quality
The multiprobe configuration (fig. 2a) offers the unique possibility to analyze complementary properties on the very same sample under uniform conditions. Multiprobing is particularly promising for high pressure studies, and in the case of delicate reproducibility. Of course, it is impossible to probe all 5 quantities in an ideal manner: here the geometry has been optimized for and (see ref. Rüetschi et al., 2011). Fig. 2a depicts the specifically designed setup within the pyrophyllite gasket of our Bridgman-type tungsten carbide anvil pressure cell Rüetschi and Jaccard (2007). Daphne oil 7373 is used as -transmitting medium, providing a high level of hydrostaticity as verified by the included Pb manometer (-gradient of at most 0.1 GPa at 7 GPa). Either an electric current (injected via the whole cross-section of the sample by the wires labeled and in fig. 2a) or a thermal gradient (created via a resistive heater) can be applied to the ab-plane of the plate-like CeCu2Si2 single crystal (, same batch as in ref. Vargoz et al., 1998). As indicated in fig. 2a the magnetic field was aligned perpendicular to that plane, along the c-axis. EM DC nanovoltmeters were used to probe the longitudinal and transverse electric fields, and respectively. The -elevation with respect to the pressure clamp (placed within a dilution refrigerator) is probed with an Au-AuFe thermocouple (calibrated under magnetic field () in a separate experiment). For the measurements, the same lock-in based technique as described in ref. Holmes, 2004 was used for the detection of the amplitude of the periodic thermocouple voltage , including separate runs at low frequency to estimate the corresponding DC elevation. The typical working frequencies varied from about 10 Hz at ambient pressure up to several 100 Hz at high pressures; no sc signal could be detected down to the lowest from 4.9 GPa onward. For the determination of the thermoelectric power , we probed the longitudinal field via two voltages, and (both compared to the opposite longitudinal voltage lead, close to the negative current lead in fig. 2a). The Seebeck coefficient of the sample can then be obtained from , where can generally be neglected for K. This procedure is carried out for several heating currents (different ) and then extrapolated , yielding for a given cryostat . The Nernst signal is defined as the transverse electric field generated by a longitudinal gradient in the presence of a perpendicular magnetic field, . The data were always anti-symmetrized with respect to , and the sign was determined using the common “vortex convention”, yielding a positive for moving vortices Wang et al. (2003, 2006); Rüetschi et al. (2011). Owing to the experimental configuration we measure here the adiabatic Nernst signal with a vanishing transverse heat current, neglecting a possible transverse gradient Blatt (1957).
Sample quality and characterization are particularly important in the case of CeCu2Si2 because of its strong sensitivity on crystal growth conditions and stoichiometry Steglich et al. (1996). Here we summarize the key features of our single crystal with the help of 2 figures (at ambient and under ) comparing position, shape and width of phase transitions as probed by different physical properties in zero and under magnetic field. Fig. 2b displays the phase diagram at ambient obtained from , and . The high superconducting mK goes along with a remarkably low residual (see inset of fig. 4). The sample can be classified as of A/S type Steglich et al. (1996), since the vanishing coincides with a pronounced anomaly in , corresponding to the antiferromagnetic Néel temperature (as identified by its decoupling from under magnetic field and by the associated signchange of , ref. Rüetschi et al., 2011). Under pressure, is rapidly suppressed Lengyel et al. (2009), and close to (fig. 2c) a high degree of homogeneity is testified by simultaneous signatures in , and of a record superconducting . These outstanding sample characteristics, in particular the low residual resistivity and the record bulk , constitute a solid basis for the following data analysis, focussed on the vicinity of .

III Results and Discussion
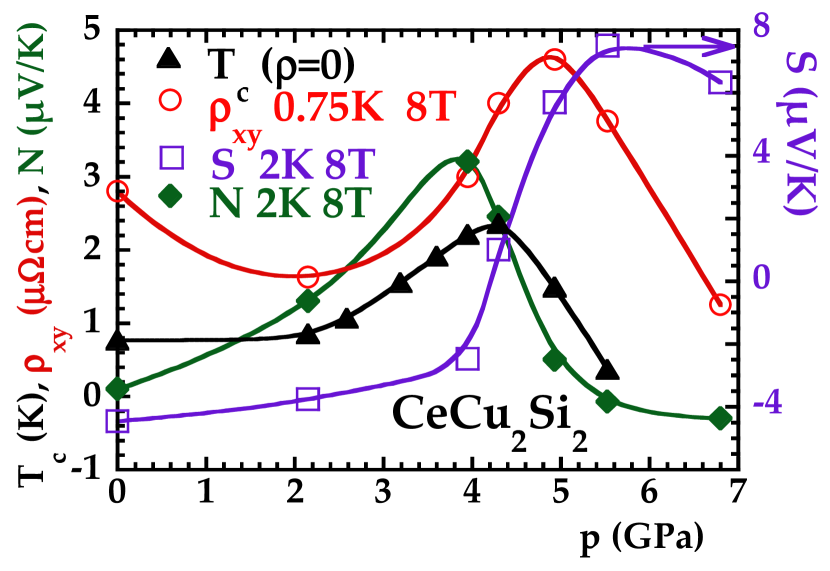
In the following, we will expose and discuss one by one our results on the different investigated physical properties. As a highlight, we display in fig. 3 (which we will often refer to) the -dependence of the superconducting , and for the first time of , and . A strong sensitivity of CeCu2Si2 to pressures around 4 GPa () is revealed, as will be developed further throughout this communication. Most emphasis will be put on our electric transport results, since the improved data and sample quality allow us to go beyond previous studies and address quantitatively features linked to the 4f electron delocalization. Subsequently, the other multiprobe results will be presented, partly consolidating already existing data, partly opening unprecedented routes of exploration. Even if at this stage a deep physical analysis may be premature in the latter case, this novel extensive set of data which allows a direct comparison of 5 experimental probes on the very same CeCu2Si2 single crystal under high pressure may be worthwhile on its own, and trigger further experimental and theoretical investigations.
III.1 Resistivity
III.1.1 Comparison to previous results
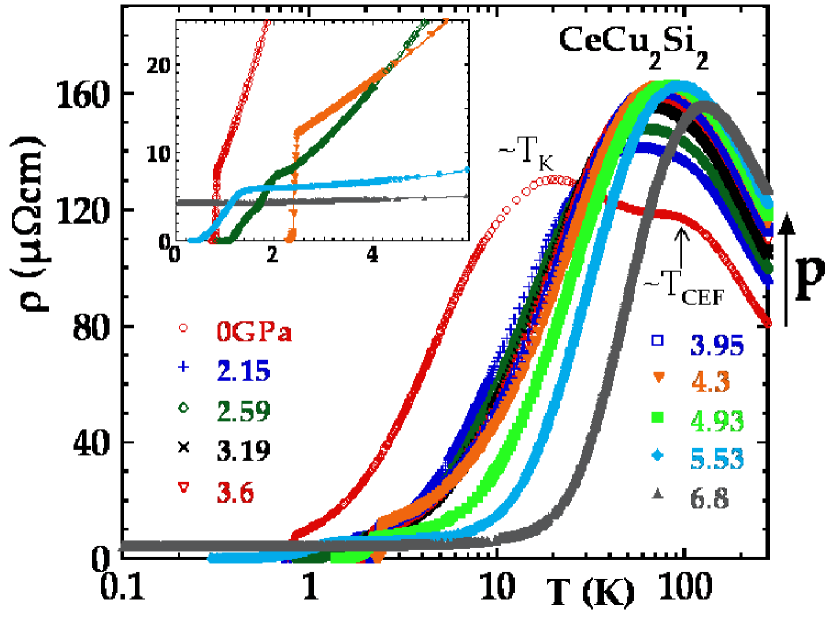
The complete set of electric transport data is shown in fig. 4. All major characteristics are in line with previous reports Jaccard et al. (1999); Holmes et al. (2004, 2007), namely the extracted -dependence of the parameters , and , obtained from simple fits to K. In particular, from the inset of fig. 4 at low , three qualitative features can already be distinguished by eye: as a function of increasing , the extrapolated residual resistivity increases before a final downturn, the coefficient drops dramatically at high and, maybe less obvious, at 4.3 GPa has a minimum. The VF theory Miyake (2007); Holmes et al. (2007) predicts for a electron delocalization realized at a maximum in the associated fluctuations at slightly lower (), coupled to and an enhancement in and . Right at , the impurity scattering cross-section should rise strongly, leading to a maximum in . Beyond the delocalization (), obviously a deep loss of correlation effects is expected. These features are all in good agreement with the experiment (fig. 5b): while and culminate around 4 GPa, the extremum in points to a slightly higher . Note that compared to previous studies, we do not only observe a sudden drop in (revealing the loss of correlations), but a preceding local maximum which coincides with that in (such a signature of enhanced correlations close to is in line with a significant increase of the initial slope of the upper critical field probed by , fig. 5b). Overall, these results corroborate the VF scenario in a general manner, but do not allow to identify the CEP and the VT or VCO line.
III.1.2 Isothermal -dependence and electron delocalization - valence cross-over line and location of the CEP
In order to progress on this issue, we take advantage of the high sample quality, and extend the previous analysis by simply plotting in fig. 5a the dependence for several K (based on our -scans from fig. 4). In the following, we want to carefully examine how the -induced electron delocalization acts on the resistivity at various . To facilitate the comparison of the different curves, it is essential to subtract the -independent “background”, i.e. the contribution from impurity scattering , even if this procedure may introduce some error bars due to the uncertainty on the determination of (of less than the symbol size in fig. 5b). Note that the -dependence of is not artificial at all, but can be well understood within the VF theory, as already pointed out above. Furthermore, it is noteworthy that up to K the phonon contribution remains negligible, as well as the influence of the higher crystal electric field (CEF) levels. However, at higher , the situation may be less straightforward, particularly under when the ground state degeneracy is affected by the crossing of the Kondo and CEF energy scales (see also fig. 4).

Let us now look in detail at fig. 5a: the initial decrease of with can be explained with the increase of the coherence (Kondo) energy scale (starting at at , see fig. 4). Preceded by a small upturn at low , due to the enhanced (fig. 5b), drops significantly above , indicating the Ce electron delocalization. This resistance loss takes place over a times wider range at 30 K compared to 3 K. For illustration purposes only we have completed the curves at higher by data above 7 GPa (isolated points in fig. 5a), originating from a previous experiment Holmes (2004) and reanalyzed in the same manner than the present one. Although the overall behavior under is very similar, we do not include these older data in the further analysis to avoid any ambiguity. The only purpose here is to document the experimentally well-established fact that the delocalization “terminates” with a low resistivity, even at 30 K. The observed broadening of with increasing is reminiscent of elementary Ce Jayaraman (1965) (see fig. 6b), where the first-order discontinuity in disappears when crossing the CEP ( Lipp et al. (2008), see inset of fig. 1) and becomes smoother and smoother within the VCO regime. However, in CeCu2Si2, the situation is less straightforward: below 30 K the scattering rate has a strong -dependence. More quantitatively, in Ce the typical magnitude of resistivity on the low side varies by only % between 450 and 600 K Jayaraman (1965) (see fig. 6b), whereas it varies by more than a factor of 10 in CeCu2Si2, considering the effect at 3 GPa for example (fig. 5a). In order to disentangle the intrinsic effect of the delocalization from that of scattering, we consider the relative -drop at each , i.e. (see fig. 6a), where designates for each the 50%-midpoint of the -drop (red squares in figs. 5a and 6a), compared to the “initial” value at 4 GPa (dashed black line in fig. 5a). Such a normalization can be regarded as a simple way to separate the -dependent contribution to the scattering rate, in order to better detect the -dependence of the Drude weight. Albeit the admittedly small number of data points, the resistance drop is clearly more pronounced at lower (fig. 6a), similar to the approach of the CEP in Ce Jayaraman (1965) (fig. 6b). Obviously, the chosen criterium of normalization may appear somehow arbitrary, and the critical reader may wonder whether it affects the aforementioned data treatment. Hence we have checked that other criteria like a normalization with respect to 3.5, 4.5 or 5 GPa do not qualitatively alter the main conclusions, i.e. a steeper drop in the normalized resistivity with lowering . The reference point at 4 GPa, just at the onset of the downturn, simply appears to be the most intuitive and reasonable one.
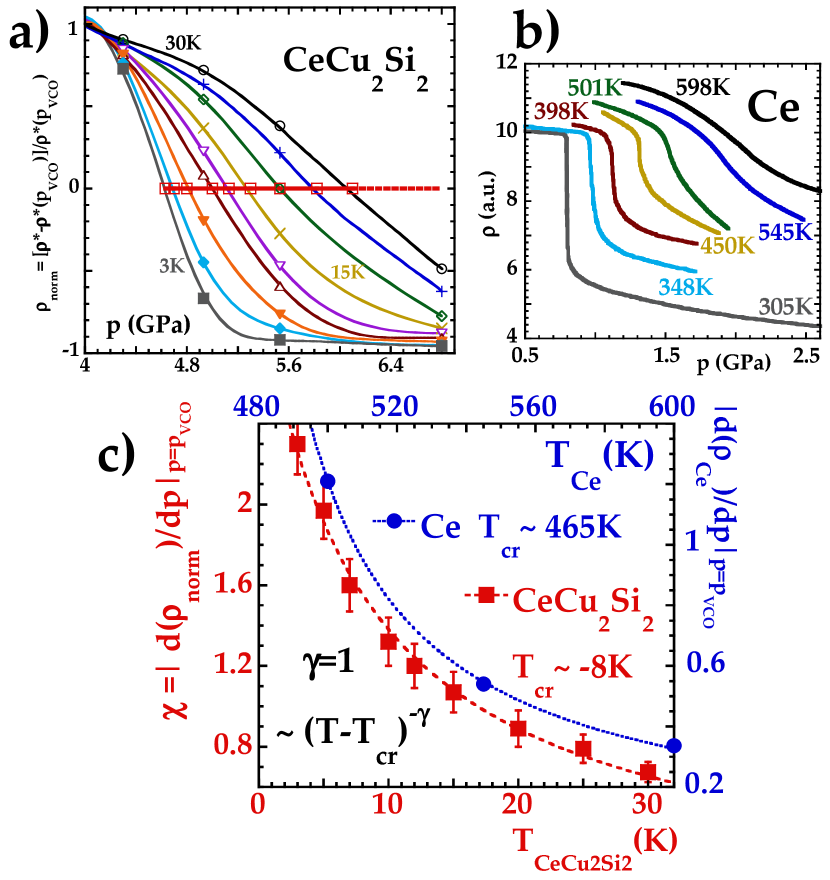
In any case, resistivity gets more sensitive to for decreasing , consistent with the approach of a CEP, at which the resistance drop should get vertical, like in elementary Ce. In order to locate the CEP, we quantified the steepness of the resistance drop through its slope at the midpoint (red squares in figs. 5a and 6a), , and analyzed its divergence , as shown in fig. 6c. The error bars take into account the uncertainty on and that introduced via (mentioned above). A simple fit of the type yields and , and a similar treatment of the Ce data Jayaraman (1965) (in agreement with more recent data Lipp et al. (2008)). Notice that experimental limitations like sample imperfections or the inevitable -gradient tend to broaden the resistivity drop, and hence the extracted may be slightly underestimated. In this respect, locally a FOVT (slightly positive ) may not be excluded, so that density fluctuations may mediate SC Monthoux and Lonzarich (2004) via a vanishing compressibility (ref. Lipp et al., 2008, Ce case).
This basic analysis of the slope establishes for the first time experimentally that the CEP of the VT line in CeCu2Si2 lies at a slightly negative . Even if some uncertainty on the precise value remains - which is almost unavoidable in such kind of high experiment - this outcome is more than just a qualitative result, in the sense that it clearly specifies the (so far unknown) magnitude of to be of the order of several degrees. It substantiates that the FOVT is just missed in CeCu2Si2, meaning that only a VCO is realized. Of course, electric transport on its own constitutes only an indirect measure of the valence change. But recent reports Rueff et al. (2011); Fujiwara et al. (2008) based on more microscopic probes of the electron count, and their qualitative conclusions on a possible VCO in CeCu2Si2 under , corroborate our results and assumptions. Furthermore, previous data on the CeCu2(Si1-x/Gex)2 system (shown in fig. 4 of ref. Yuan et al., 2006) exhibit for qualitatively similar features than those presented here. Altogether, a consistent scenario emerges, in which the key ingredient is the proximity of CeCu2Si2 at to the CEP: this constellation allows the associated critical VF to still play an important role in the low physics, such as mediating SC, in very close agreement to the already introduced VF theory (see in particular the scenario outlined in fig. 2b of ref. Watanabe and Miyake, 2011). In this respect, our results do not only specify the location of the CEP close to , but offer also a simple method to track the VCO within the plane: connecting the previously defined midpoints (red squares in figs. 5a and 6a), we obtain the red VCO line drawn in fig. 1 (equivalent to that in fig. 5a). As already mentioned, the precise pathway may slightly depend on the normalization criteria. On this footing, the minor downward curvature on the high side of the VCO line may be somehow exaggerated: at 4 GPa and 30 K, resistivity obviously saturates, approaching more or less the unitary limit. This means that the midpoint should actually be situated at a marginally lower . Regardless of this detail, and compared to the rather qualitative lines in previous phase diagrams Yuan et al. (2003); Jaccard and Holmes (2005); Yuan et al. (2006); Monthoux et al. (2007), the present one is the first signature of the electron delocalization based on experiment. Finally, extrapolating this line, can be deduced, so that both coordinates of the CEP are determined within the experimental errors. Joining figs. 5a and b, it becomes obvious that the extrapolation of the red VCO line roughly coincides with the maximum in , which is a good sign of consistency (within the framework of the critical VF), since both features are triggered precisely by the electron delocalization.
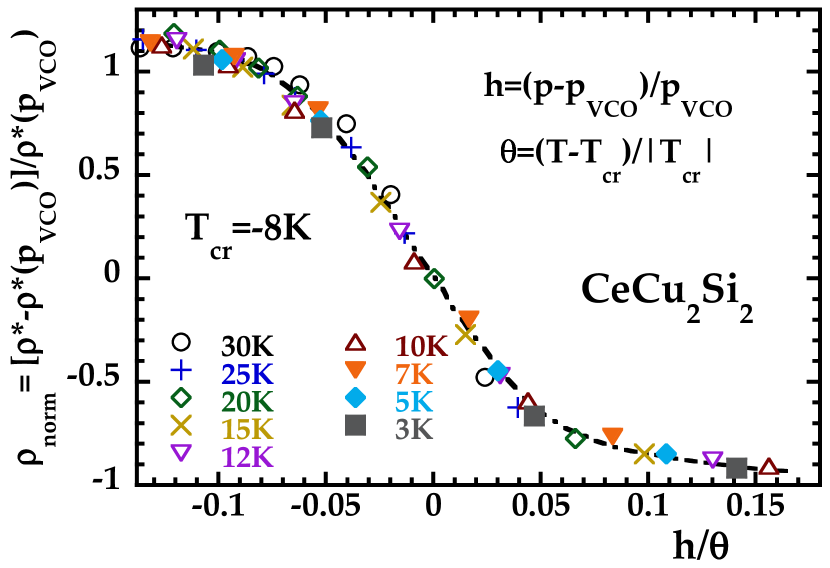
III.1.3 Uniform behavior at a generalized distance from the CEP
Next let us focus on an additional feature, revealing in a complementary manner that resistivity is governed by the existence of an underlying CEP. Strikingly, it is possible to collapse all the data on a single curve in vicinity to . Introducing the dimensionless variables and , a collapse of excellent quality is obtained according to (: scaling function) with , as shown in fig. 7 for GPa. This means that for a generalized “distance” from the CEP, the data behave in a unique manner. As indicated, the sensitivity on the chosen is limited as well as the number of data points, and the applicable range may slightly vary according to the normalization reference (see above). Nevertheless, the data collapse is quite robust and its quality noteworthy, as well as the fact that the extracted is of the same order of magnitude as previously deduced from the -divergence of . We have also tried to apply the universal scaling theory of critical phenomena, which has for example been successful in describing the Mott transition probed by in oxide materials Limelette et al. (2003) or in characterizing the valence instability in Ce1-xThx Lawrence et al. (1975). Within such a generalized framework, the expected scaling law for yields: with , : critical exponents (mean field approach: , ). In the case of CeCu2Si2 this leads empirically to and (fig. 7). Even if the collapse is not strongly sensitive on the choice of , it seems incompatible with and does hence not correspond to a simple universality class such as the liquid-gas transition. Further experiments with a higher data density, also in related compounds, may help to better understand this issue.
III.1.4 General relevancy of analysis
Altogether, the divergence of the slope and the observed data collapse strongly suggest that the resistivity around is governed by the proximity to a CEP (at slightly negative ). This outcome offers different avenues for future exploration. First, it may be interesting to study on CeCu2Si2 single crystals of different origin the involvement of critical VF in SC, i.e. the relationship between and (of course other factors that influence have to be taken into account as well). Second, even more promising, the widespread relevance of the VF scenario should be investigated by applying a similar resistivity analysis to other Ce-based compounds, especially to the more common cases where and are not well separated. Indeed, the identification of and the electron delocalization is generally more elusive than that of the breakdown of magnetism, , reflecting the competition between the Kondo effect and the RKKY interaction. Rather exceptionally, in CeCu2Si2 , and exhibits two distinct maxima/energy scales, as already noticed in fig. 4 ( and ). Strikingly, close to these maxima merge. Although the microscopic link with the VCO may not be clear-cut, phenomenologically such merging maxima in resistivity can be found in numerous other systems (like CePd2Si2/Ge2 Wilhelm and Jaccard (2002), CeRu2Ge2 Wilhelm and Jaccard (2004) and CeCu5Au Wilhelm et al. ), where the proximity to an underlying CEP may therefore be revealed. However, in contrast to CeCu2Si2, in those systems both maxima already overlap for . Hence is suspected. The latter scenario is also assumed in CeRhIn5, mainly based on the subsistence of SC in a wide region around , the maximum in and a -linear resistivity () Muramatsu et al. (2001); Knebel et al. (2008); Park et al. (2008). Using our method could be an important ingredient to probe the existence of a CEP and the relevancy of VF, notably for SC, in these compounds. Nonetheless, another dissimilarity to CeCu2Si2 may occur: the resistance drop associated with the delocalization may be less pronounced, which means experimentally less accessible, due to a lower lying CEP (more negative ). Concurrently, the impact of the critical VF on the physical properties gets reduced. Previous experimental data in other Ce systems (obtained mainly under less reliable conditions) may in some cases (for example in CeCu2Ge2 Vargoz and Jaccard (1998); Vargoz (1998)) exhibit close to features qualitatively similar to those discussed here in CeCu2Si2, but do not allow, so far, an incontrovertible quantitative analysis. New high experiments with improved accuracy will facilitate progress on this explorative route. Let us finally add that in other systems like CeIrIn5 Capan et al. (2004, 2009) or YbAg/AuCu4 Sarrao et al. (1999); Wada et al. (2008) is replaced by magnetic field as tuning parameter to induce the proximity to a CEP and critical VF.
III.1.5 Broadening of the resistive transitions
Last but not least, let us comment on the broadening of the sc transitions as seen by at intermediate and high . The inset of fig. 4 exemplifies typical shapes of dropping resistivities at 2.59 and 5.53 GPa. In the phase diagram (fig. 1), we have represented two lines delimiting the superconducting phase, one corresponding to the onset temperature () and the other to (). The resulting separation of both lines below and above (in conjunction with narrow transitions at and ) is robust and found systematically in all CeCu2Si2 (and CeCu2Ge2) samples (already mentioned in early reports Jaccard et al. (1985)), and does not depend on the conditions, since it has been observed in a variety of pressure mediaJaccard et al. (1999); Holmes et al. (2004, 2007); Jaccard and Holmes (2005); Vargoz et al. (1998), among which in highly hydrostatic 4He. One may argue that broad resistive transitions are quite common at the edges of superconducting regions, but in CeCu2Si2, at intermediate , the broadening appears precisely in a region where the -dependence of is rather weak. For fig. 1, between 0 and 2.15 GPa, older data Vargoz et al. (1998); Holmes (2004) served as a basis for a smooth interpolation. has already reached the level of the maximum at GPa, but without a cusp-like feature as in previous reports Thomas et al. (1996); Holmes et al. (2004). This rather quick increase of may point to the fact that the VF pairing mechanism needs to be considered already at low (at least in some form), as already inferred from the very weak decrease of above Lengyel et al. (2011). Around , the maximum and coincide. Above , in several samplesThomas et al. (1996); Vargoz et al. (1998); Holmes et al. (2005) the superconducting region extends to high , i.e. the decrease of is less steep than shown in fig. 1, but may exhibit a jump close to 8 GPa Thomas et al. (1996). As a general feature, the bulk as probed by coincides with . More precisely, at intermediate does neither display any signature of nor any notable broadening of the superconducting anomaly associated with (not shown, but similar to reports in refs. Holmes, 2004; Holmes et al., 2004). Remarkably, above GPa, no more anomaly in can be detected, down to the lowest reachable . In this context, it may be worthwhile to notice that the ’s from ref. Thomas et al., 1996 originate from ac susceptibility, sensitive to a surface layer. Altogether, the broadening of the resistive transition at intermediate and high in CeCu2Si2 appears as an intrinsic phenomenon, even if details may be sample dependent. However, the physical origin of this broadening remains an open question. Further investigations are needed to elucidate whether it may be related to the symmetry change of the sc order parameter (at least at intermediate ) Lengyel et al. (2009), to phenomena observed in the Ce-115 series Park et al. (2012) or more directly to the presence of critical VF. Indeed, one could imagine a non-homogeneous nucleation and spread of superconducting domains within the sample or on the surface, depending on the local distribution of and the closeness to .
III.2 Magnetoresistance
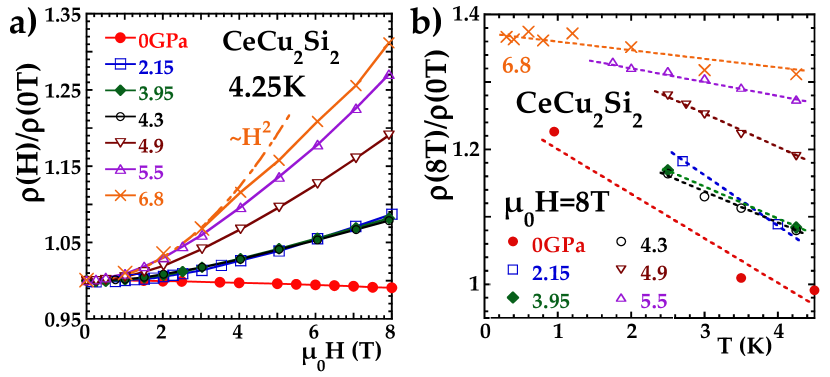
Let us now study the influence of magnetic field on resistivity, i.e. the magnetoresistance. First we stress that solely -symmetrized data are used in the following discussion, excluding any spurious contribution from Hall effect, but strongly limiting the number of available data points. Fig. 8 displays the measured - and -dependencies of the ratio for several , at 4.25 K and 8 T respectively. We preferred the representation of the relative value to the absolute value (commonly called magnetoresistance) because of the -dependence of the residual . At ambient and for decreasing changes sign from negative to positive at around 4 K, as already reported earlier Rauchschwalbe et al. (1987) (at about 2 K in ref. Aliev et al., 1984). In a simplified picture, the sign-change may be considered as a rough measure of the coherence temperature of the Ce Kondo lattice (generally ), as also indicated by the maximum in the Hall data in the same region (see sect. III.4). However, quantitatively we find a more pronounced than measured back in 1987 (ref. Rauchschwalbe et al., 1987): for example at 1.5 K a linear interpolation yields (fig. 8b), which corresponds to an increase of at least a factor of 5, despite our very low . Comparing crystals of various quality (investigated by our group over the last 15 years or soVargoz et al. (1998); Holmes (2004)), the absolute magnetoresistance depends very little on at temperatures of a few K and a magnetic field of about 8 T. It looks like as if resistivity had two contributions: one that is field independent and varies strongly from sample to sample, and another one which always gives the same order of magnitude of in magnetic field. This explains, at least phenomenologically, a considerable spread in on different samples. Next let us focus on the effect of . At 4.25K (fig. 8), first gets positive, in accordance with the increase of (and hence of ) with . Surprisingly, from GPa onward is almost constant, and continues to rise only above , before likely reaching some saturation at high . Roughly, such a behavior is reminiscent of which drops with , except in the region before (where it even gets enhanced, see fig. 5b). Conceivably, the effect of a raising (resulting in an increasing ) is superimposed by another phenomenon, of opposite effect and driven by critical VF below . Further investigations are necessary to elucidate this question. Considering the -evolution of 8 T, we find another unexpected result: the extrapolation for seems to point to an almost -independent 8 T of about 1.35: the higher values of at finite are “compensated” by a weaker -dependence for increasing . Of course, more data points at low would be needed, especially around , to confirm this trend. Less intriguingly, clearly follows the usual -dependence at low fields, as exemplified in fig. 8a for 6.8 GPa. Another standard examination is provided by the validity check of Kohler’s rule. It states that the effect of magnetic field on resistivity, , scales as a function of Pippard (1989). Deviations from this standard behavior are also observed, for example in CeRhIn5 where magnetoresistance violates Kohler’s rule in the region exhibiting prominent non-Fermi liquid properties, but satisfies a modified scaling relation Nakajima et al. (2007). From our partial analysis (not shown) on CeCu2Si2, no significant deviation from Kohler’s rule throughout the investigated range can be deduced. However, this preliminary statement still requires substantiation from supplementary data, especially at high where K hardly varies, meaning that data points above 4 K should be included in order to perform the test on a broad parameter range.
III.3 Specific heat (ac)
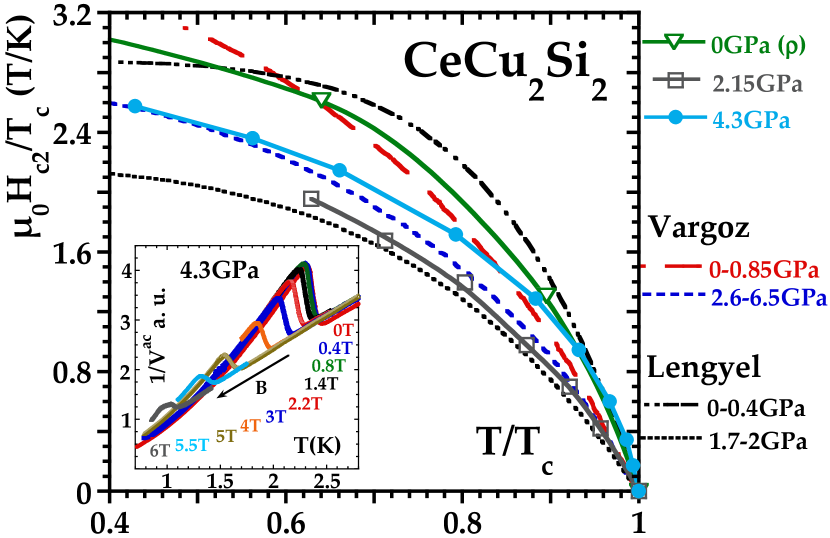
Concerning ac specific heat, its main contribution, apart from validating bulk SC, is to confirm for the first time the enhancement of correlation effects near the maximum by a bulk probe, at least when considering that the initial slope qualitatively reflects the quasiparticle velocity or effective mass as a correlation strength sensor. Indeed, an enhancement by a factor of of the initial slope at the maximum compared to 2 GPa is observed (filled triangles in fig. 5b). As mentioned earlier, such a trend had already been inferred from resistivity and a kind of “plateau” in Jaccard et al. (1999); Holmes et al. (2004, 2007), which has now grown into a clear maximum in the present high quality single crystal, fig. 5b. More specifically, one may also be interested in the -evolution of the properties of the superconducting phase itself, which is in part characterized by the curves. Without pushing the analysis too far, we just present our new data that allow an extension up to of a scaling study suggested by Lengyel et al.Lengyel et al. (2009) (restricted to GPa). Fig. 9 depicts the corresponding normalized phase diagram, including the data from ref. Lengyel et al., 2009. For ( data) and the trend of 2 distinct regimes is confirmed, i.e. a ratio of the initial slopes of roughly 1.75 (ref. Lengyel et al., 2009). However, for , the initial slope rises again (to even higher values than at , see above). It hence appears questionable whether the behavior at only GPa is representative of the critical VF regime, as implied by the presumed symmetry change of the superconducting order parameter Lengyel et al. (2009). On the present data basis, a further evolution with increasing towards can not be excluded. For sure, the robustness against is first lowered by , and then rises again for . This trend is supported by an anterior report from Vargoz et al.Vargoz et al. (1998) on a crystal of the same batch (original data represented by red and dark blue lines in fig. 9), where the initial slopes for and roughly match. Notice that the Pauli limiting field () seems slightly weakened for , pointing to an increasing -factor Vargoz et al. (1998). Finally, the evolution with of the superconducting order parameter symmetry may be easier tracked by angle-dependent measurements.
III.4 Transverse resistivity - Hall effect
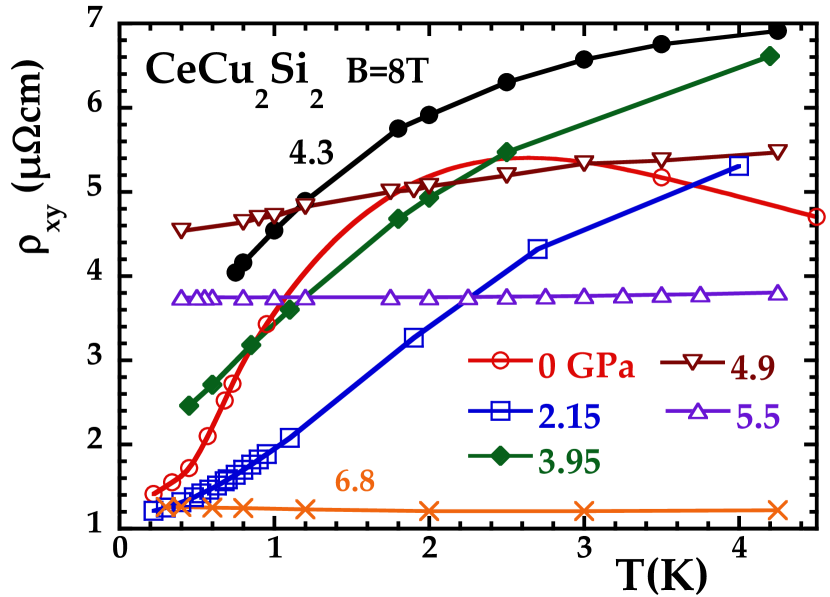
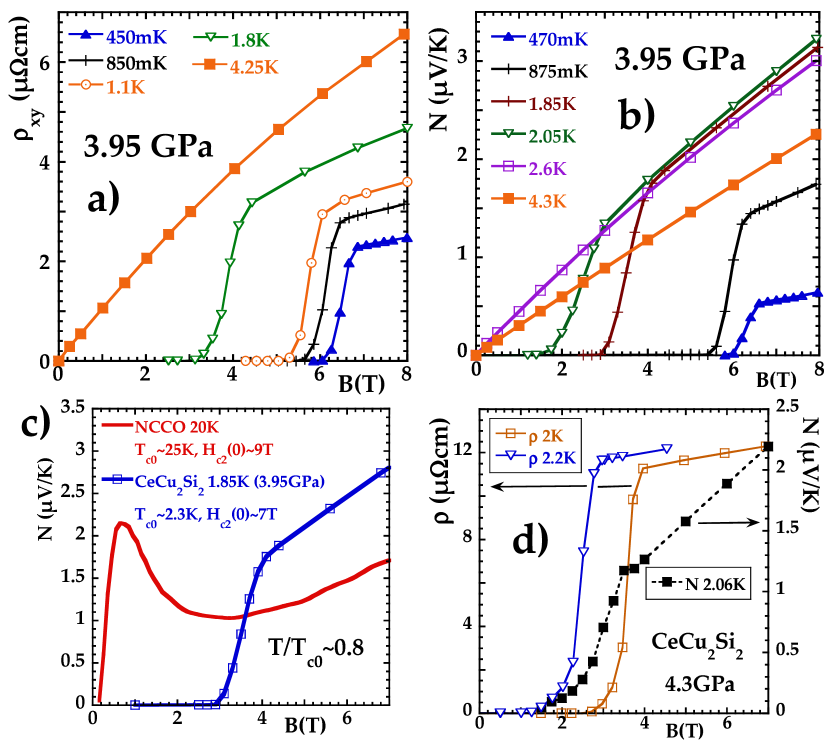
In fig. 10 we display the -dependence of the transverse resistivity (Hall effect) at 8T and for several up to 6.8 GPa (data systematically anti-symmetrized with respect to ), the -dependence is exemplified at GPa in fig. 13a for different . At the measured -dependence is roughly in line with the literature Aliev et al. (1984); Ōnuki et al. (1989); Araki et al. (2011) (except for the sign compared to ref. Aliev et al., 1984) with a maximum at K, possibly pointing to the energy scale, comparable to that inferred from magnetoresistance data (see above). For a precise analysis of the ordinary and the anomalous contribution due to skew scattering, data above 4 K would be necessary and should be compared to magnetic susceptibility measurements Fert and Levy (1987); Araki et al. (2011). This is particularly true for higher where we did not reach the maximum in , shifted to K (ref. Araki et al., 2011) and following the increase of (and hence of ) with (see the shift of the maximum in , fig. 4). Here we report for the first time on a CeCu2Si2 single crystal the -dependence of at low and across the region of the 4f electron delocalization, where it exhibits a prominent maximum (fig. 3). Its position does not depend on the extraction from high or low field data, due to an almost -linear Hall voltage (fig. 13a); its value is about one order of magnitude higher than that of LaCu2Si2 (ref. Aliev et al., 1983). As can easily be deduced from fig. 10, the strongest Hall signal corresponds to 4.3 and 4.9 GPa, depending on the range; below 1 K the maximum in clearly lies beyond that of , as shown in fig. 3 at 0.75 K and 8 T. This shift points to a Hall signal more sensitive to the valence cross-over itself, mimicking Miyake (2007). In contrast, the maxima in and rather appear for , the domain of strongest VF Miyake (2007) (see above). For , the decrease of is quite steep, like that of or , reflecting the departure from the critical region. The -dependence also clearly changes over the whole range (from positive curvature over -linear at towards almost -independent, fig. 10). Interestingly, an enhancement of at low is also reported in CeRhIn5 close to the critical pressure , and discussed in the light of the backflow effect in strongly correlated materials Nakajima et al. (2007). Further calculations within the critical VF scenario are currently carried out and may connect on a microscopic basis the observed increase of in vicinity of with the 4f electron delocalization and the proximity to the CEP in CeCu2Si2.
III.5 Thermoelectric properties I - thermopower
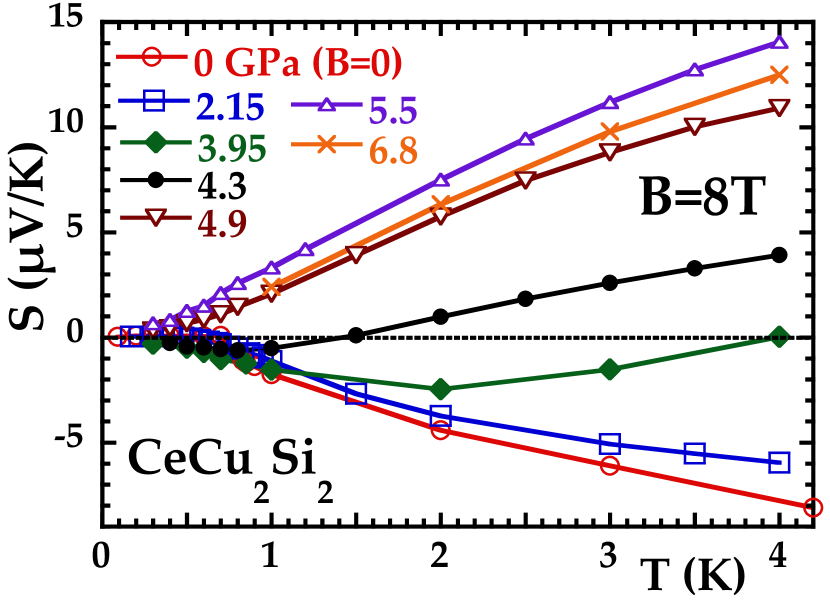
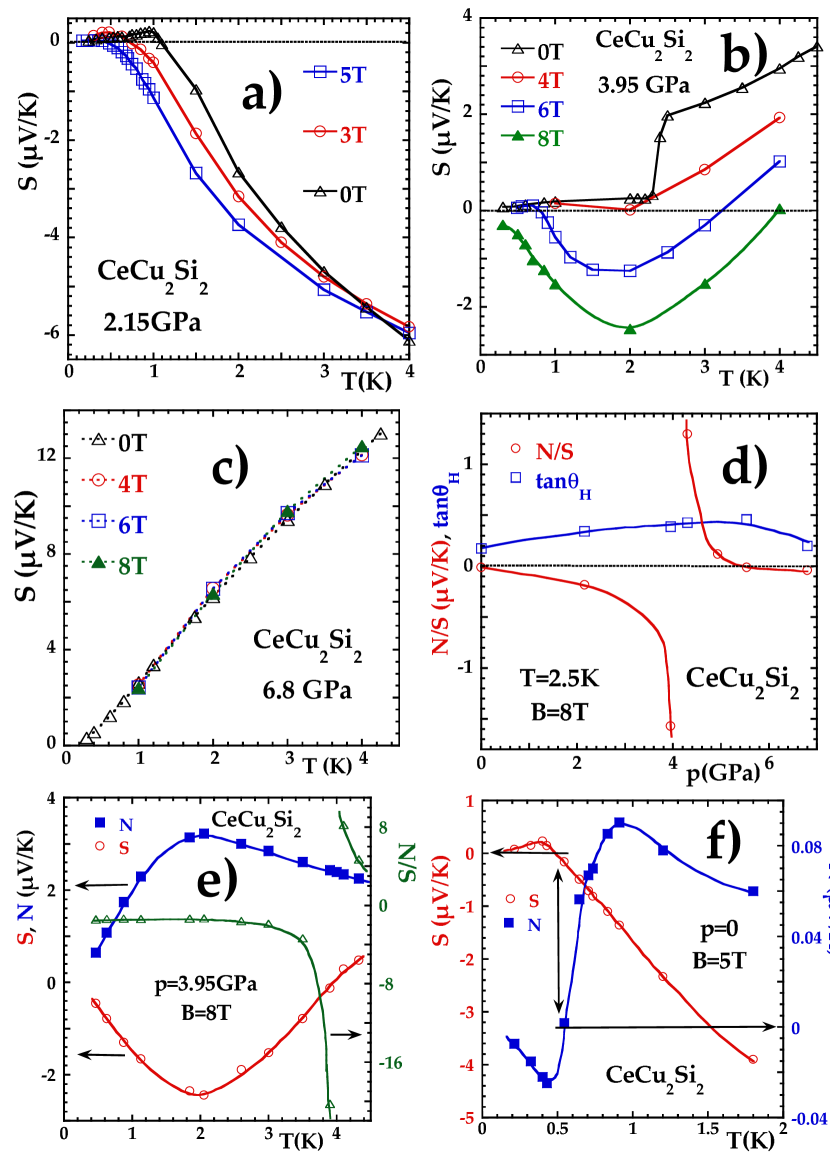
Let us now concentrate on the thermoelectric properties, and . Starting with the (longitudinal) thermopower (Seebeck coefficient), our data (figs. 3, 11 and 14a-c) generally agree with previous reports Aliev et al. (1984); Sparn et al. (1985); Jaccard et al. (1985), except that at we obtain a slightly smaller signal from the -phase (not shown) compared to ref. Sparn et al., 1985. Apart from this small positive contribution below 1 K, the thermopower signal is negative, before getting positive around 70 K with a subsequent maximum at about 150 K, ref. Jaccard et al., 1985. Even if a generic behavior is absent in the thermoelectric response of HF materials, it seems to be more or less characteristic Fischer (1989); Link et al. (1996); Zlatić et al. (2003) for Ce compounds close to the magnetic instability that at low a negative contribution competes with the more ordinary positive contribution (related to the and energy scales) to . Hence a reduction of this negative component is expected when is applied, since an increasing hybridization generally favors the non-magnetic HF Kondo lattice state (screened 4 electrons), eventually followed by a mixed valence state. This phenomenon has already been observed experimentally Jaccard et al. (1985) on a broad scale up to 300 K and 8 GPa, demonstrating the continuous decrease and subsequent vanishing of the negative component. Here we concentrate on the low region, for the first time in the presence of a magnetic field (to avoid the superconducting shunt). As a key feature, K T changes sign precisely in the region where and are maximum (see figs. 3 and 5b): like in a naive picture, seems related to the derivative of the density of states. Whether this sign-change of thermopower is intimately coupled to the 4f electron delocalization, or occurs rather accidentally in this region, is left for further studies. In particular, future band structure calculations or Fermi surface investigations under may help to better identify the role of the VCO for the intriguing behavior of . Close to 6 GPa, K T finally has a maximum itself (fig. 3), the down-turn occurring only at the highest examined . Surprisingly, our results seem not compatible with previous systematics Behnia et al. (2004), which would expect , where is the Faraday number and the Sommerfeld coefficient of specific heat. From our data in the vicinity of , remains negative down to the lowest available (for ), except for GPa. Possibly, positive values are recovered at much lower , since the characteristic energy scale of the system may be markedly reduced around . On the same footing, the Seebeck coefficient displays a strong -dependence in the vicinity of , in contrast to lower and higher , as shown in figs. 14a-c. The difference in the sensitivity on magnetic field is particularly striking between 4 GPa with at 3 K (fig. 14b) and the -independent at 6.8 GPa (fig. 14c). This is to our knowledge the first observation of such a feature in close to a valence instability, and it clearly points to a low characteristic energy scale and a peculiar behavior around , as already mentioned above; however, its physical origin may be difficult to unveil independently from other probes since it involves both transport and thermodynamic properties of the system.
III.6 Thermoelectric properties II - Nernst effect
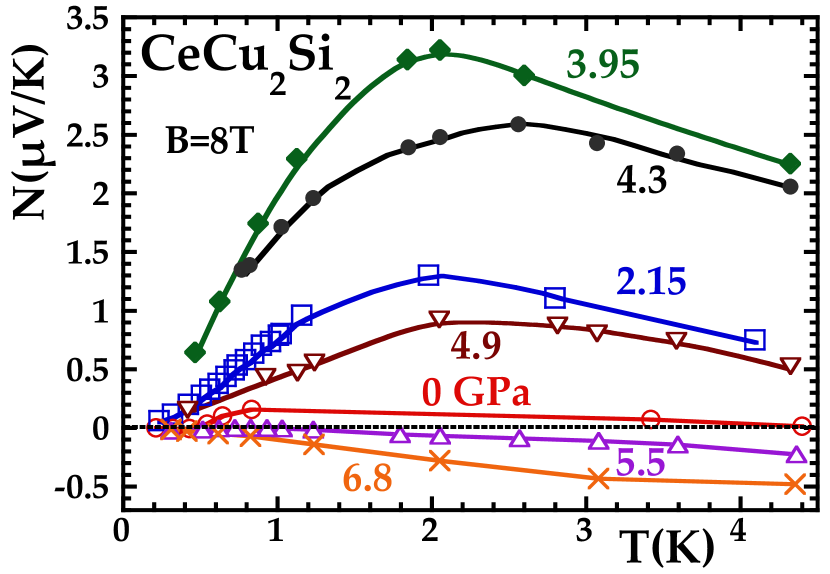
Last but not least let us comment on the transverse thermoelectric voltage in the presence of a perpendicular magnetic field, the Nernst effect (figs. 3, 12 and 13b). In a semi-classical, single-band Boltzmann picture, the quasiparticle contribution to the Nernst signal relies on the energy dependence of the relaxation time Oganesyan and Ussishkin (2004); Behnia (2009). Indeed, the appearance of a transverse electric field has its origin in the different relaxation times of the charge carriers involved in the heat current (induced by the applied gradient) and the charge carriers responsible of the compensating counter-flow. In ordinary metals, the relaxation time depends only weakly on energy, so that the Nernst signal is usually quite small (so-called Sondheimer cancelation Sondheimer (1948)). Assuming a linear energy dependence around the Fermi level, a simplified expression for the Nernst coefficient can be found Behnia (2009): (: carrier mobility). Hence a high mobility or a low Fermi energy can naturally lead to an enhanced Nernst signal, the latter case being often realized in HF compounds Behnia (2009), for example in CeCoIn5 (refs. Bel et al., 2004; Onose, Y. et al., 2007; Izawa et al., 2007). However, in CeCu2Si2 at ambient , we only observe a tiny V/K at low and under 8 T (fig. 12 and ref. Rüetschi et al., 2011). A sign-change is observed below 1 K, likely related to the -phase, and around 4 K, like in magnetoresistance. Here we are particularly interested in a possible signature of the electron delocalization around . In this respect, as a function of , the most intriguing feature is a strong enhancement towards , leading to a pronounced peak that coincides with the maximum in (figs. 3 and 12). Its value is more than one order of magnitude higher than at and roughly corresponds to half of the giant measured in CeCoIn5 Bel et al. (2004). In addition, exhibits a maximum around 2 K for GPa and independent of , most likely revealing a characteristic energy scale (fig. 12). For , this assumption is reinforced by a negative peak also around 2 K in (fig. 11). For , behaves in a more “conventional” manner (smaller values, roughly -linear), and it changes sign to negative. Let us add that generally a -linear Nernst voltage is observed, as exemplified at 4 GPa in fig. 13b. We have also investigated the above relationship between and in the low limit Behnia (2009) (note that solely rough estimations for are available): CeCu2Si2 approaches the universal curve only at , next to CeRu2Si2 (which may not be surprising since transport data show similarities Amato et al. (1989)). However, away from (especially for ), the tiny inevitably drives the corresponding data quite off the universal line, yielding a slope different from 283[V/K].
Apart from the quasi-particles, moving vortices in the mixed phase of a superconductor can also give rise to a transverse voltage Solomon and Otter (1967); Huebener and Seher (1969), which is directly related to their velocity. This phenomenon has been extensively studied in the high superconductors, known to exhibit a strong enhancement of in the vortex-liquid state Ri et al. (1994); Xu et al. (2000); Wang et al. (2003). In contrast, no sizable vortex contribution to has yet been detected in HF systems (see for example ref. Bel et al., 2004), i.e. the vortices are assumed to be immobile. CeCu2Si2 does not deviate from this trend. In fig. 13c we compare the field dependence of the Nernst signal in NCCO (from ref. Wang et al., 2003) and CeCu2Si2 at a similar ratio of (the limit of is of the same order of magnitude in both compounds). While in CeCu2Si2 simply follows the vanishing (taking into account the applied thermal gradient of responsible for the transition width, fig. 13d), the Nernst signal of NCCO increases within the mixed state, due to a significant vortex contribution.
Another interesting feature appears when comparing the magneto-thermal electric fields (longitudinal, probed by ) and (transverse, probed by ), see fig. 2a. For some specific points in the -space, particularly in vicinity to and under high magnetic field, vanishes (sign-change as already discussed above), whereas the transverse field stays finite. Such a situation is exemplified at 2.5 K and 8 T in fig. 14d, where the ratio “diverges” as a function of around 4 GPa, and it is also seen in the -dependence of , shown at 4 GPa in fig. 14e. In other words, the electric field produced by a longitudinal heat current becomes exclusively transverse. Whether this happens accidentally and is simply related to the fact that and probe quite different phenomena in a complex multiband system evolving under , or whether the orthogonal electric field occurs for more profound reasons, possibly linked to the electron delocalization at , is left for further studies. At this stage, we can only make the following comments: a similar trend has been reported in CeCoIn5 in the low and limit Bel et al. (2004) (but it is partly masked by SC). There a strongly energy-dependent elastic scattering rate had been invoked to explain the low Seebeck and large Nernst coefficients. Returning back to CeCu2Si2, in contrast to the “divergence” in , no anomaly is detected in the -dependence of the purely electric analogue , as also shown in fig. 14d and which may be trivial since can not change sign. Simultaneous measurements of and are not yet common in Ce compounds, and in the rare other reported cases (see for example refs. Pourret et al., 2006 and Johannsen et al., 2008), or like in CeCu2Si2 at , T and mK (conditions corresponding to the transition into the phase), the signchange of coincides with a vanishing (illustrated in fig. 14f), so that no “divergence” occurs.
IV Conclusion
In conclusion, we have performed for the first time a multiprobe study under high pressure on a CeCu2Si2 single crystal with a unprecedented high superconducting and low in order to deepen the understanding of the expected Ce electron delocalization at 4 GPa. A careful resistivity analysis unveils the proximity of CeCu2Si2 to the critical end point of the valence transition line, located at GPa and a slightly negative temperature. This means that CeCu2Si2 lies entirely in the valence cross-over regime and does not exhibit a first-order valence transition down to lowest temperatures. However, around and below about 30 K the complete data set is governed by this adjacent critical end point, leading to a noteworthy data collapse. In addition to the critical end point, the experimentally determined valence cross-over line has been added as an important feature to the phase diagram of CeCu2Si2 (fig. 1).
As an extraordinary tool, the new multiprobe setup (fig. 2a) gives access to a huge parameter space, in which diverse physical quantities like , , , and can be simultaneously compared on a single sample and under extreme conditions (low temperatures, high pressures and magnetic field). It should stimulate the detailed exploration of a variety of systems in strongly correlated matter. In CeCu2Si2, apart from resistivity, , and may also be considerably affected by the underlying critical end point since they reveal pronounced anomalies close to (fig. 3), highlighting an important change in the ground state properties of the system. It still needs to be elucidated whether these features are solely linked to the Ce electron delocalization, or rather specific to the case where valence fluctuation-mediated superconductivity is present, like in CeCu2Si2. An extended theoretical framework and more experimental data under pressure from different probes will help to better identify these complex signatures and their relationship to the electron delocalization.
Overall, this study brings the scenario of superconductivity mediated by valence fluctuations to the front in heavy fermion physics, and further studies may reveal its wide-spread relevance, even in the more common case where and are not well separated.
Acknowledgements.
We acknowledge fruitful discussions with K. Behnia and J. Flouquet, technical assistance from M. Lopes and financial support from the Swiss National Science Foundation.References
- Steglich et al. (1979) F. Steglich, J. Aarts, C. D. Bredl, W. Lieke, D. Meschede, W. Franz, and H. Schäfer, Phys. Rev. Lett. 43, 1892 (1979).
- Jaccard et al. (1985) D. Jaccard, J. Mignot, B. Bellarbi, A. Benoit, H. Braun, and J. Sierro, J. Magn. Magn. Mat. 47&48, 23 (1985).
- Jaccard et al. (1999) D. Jaccard, H. Wilhelm, K. Alami-Yadri, and E. Vargoz, Physica B 259-261, 1 (1999).
- Holmes et al. (2004) A. T. Holmes, D. Jaccard, and K. Miyake, Phys. Rev. B 69, 024508 (2004).
- Holmes et al. (2007) A. T. Holmes, D. Jaccard, and K. Miyake, J. Phys. Soc. Jpn. 76, 051002 (2007).
- Miyake (2007) K. Miyake, J. Phys.: Condens. Matter 19, 125201 (2007).
- Watanabe and Miyake (2011) S. Watanabe and K. Miyake, J. Phys.: Condens. Matter 23, 094217 (2011).
- Jayaraman (1965) A. Jayaraman, Phys. Rev. 137, A179 (1965).
- Lipp et al. (2008) M. J. Lipp, D. Jackson, H. Cynn, C. Aracne, W. J. Evans, and A. K. McMahan, Phys. Rev. Lett. 101, 165703 (2008).
- Vargoz et al. (1998) E. Vargoz, D. Jaccard, J. Genoud, J.-P. Brison, and J. Flouquet, Solid State Commun. 106, 631 (1998).
- Holmes (2004) A. T. Holmes, Exotic Superconducting Mechanisms in Fe and CeCu2Si2 under Pressure, Ph.D. thesis, Université de Genève (2004), http://archive-ouverte.unige.ch/unige:284 .
- Rüetschi et al. (2011) A.-S. Rüetschi, K. Sengupta, G. Seyfarth, and D. Jaccard, J. Phys.: Conf. Ser. 273, 012052 (2011).
- Rüetschi and Jaccard (2007) A.-S. Rüetschi and D. Jaccard, Rev. Sci. Instrum. 78, 123901 (2007).
- Wang et al. (2003) Y. Wang, S. Ono, Y. Onose, G. Gu, Y. Ando, Y. Tokura, S. Uchida, and N. P. Ong, Science 299, 86 (2003).
- Wang et al. (2006) Y. Wang, L. Li, and N. P. Ong, Phys. Rev. B 73, 024510 (2006).
- Blatt (1957) F. J. Blatt, Solid State Physics, 4, 199 (1957).
- Steglich et al. (1996) F. Steglich, P. Gegenwart, C. Geibel, R. Helfrich, P. Hellmann, M. Lang, A. Link, R. Modler, G. Sparn, N. Büttgen, and A. Loidl, Physica B 223&224, 1 (1996).
- Lengyel et al. (2009) E. Lengyel, M. Nicklas, H. S. Jeevan, G. Sparn, C. Geibel, F. Steglich, Y. Yoshioka, and K. Miyake, Phys. Rev. B 80, 140513 (2009).
- Bruls et al. (1994) G. Bruls, B. Wolf, D. Finsterbusch, P. Thalmeier, I. Kouroudis, W. Sun, W. Assmus, B. Lüthi, M. Lang, K. Gloos, F. Steglich, and R. Modler, Phys. Rev. Lett. 72, 1754 (1994).
- Monthoux and Lonzarich (2004) P. Monthoux and G. G. Lonzarich, Phys. Rev. B 69, 064517 (2004).
- Rueff et al. (2011) J.-P. Rueff, S. Raymond, M. Taguchi, M. Sikora, J.-P. Itié, F. Baudelet, D. Braithwaite, G. Knebel, and D. Jaccard, Phys. Rev. Lett. 106, 186405 (2011).
- Fujiwara et al. (2008) K. Fujiwara, Y. Hata, K. Kobayashi, K. Miyoshi, J. Takeuchi, Y. Shimaoka, H. Kotegawa, T. C. Kobayashi, C. Geibel, and F. Steglich, J. Phys. Soc. Jpn. 77, 123711 (2008).
- Yuan et al. (2006) H. Q. Yuan, F. M. Grosche, M. Deppe, G. Sparn, C. Geibel, and F. Steglich, Phys. Rev. Lett. 96, 047008 (2006).
- Yuan et al. (2003) H. Q. Yuan, F. M. Grosche, M. Deppe, C. Geibel, G. Sparn, and F. Steglich, Science 302, 2104 (2003).
- Jaccard and Holmes (2005) D. Jaccard and A. T. Holmes, Physica B 359-361, 333 (2005).
- Monthoux et al. (2007) P. Monthoux, D. Pines, and G. G. Lonzarich, Nature 450, 1177 (2007).
- Limelette et al. (2003) P. Limelette, A. Georges, D. Jérome, P. Wzietek, P. Metcalf, and J. M. Honig, Science 302, 89 (2003).
- Lawrence et al. (1975) J. M. Lawrence, M. C. Croft, and R. D. Parks, Phys. Rev. Lett. 35, 289 (1975).
- Wilhelm and Jaccard (2002) H. Wilhelm and D. Jaccard, Phys. Rev. B 66, 064428 (2002).
- Wilhelm and Jaccard (2004) H. Wilhelm and D. Jaccard, Phys. Rev. B 69, 214408 (2004).
- (31) H. Wilhelm, S. Raymond, D. Jaccard, O. Stockert, and H. v. Löhneysen, arXiv:cond-mat/9908442 .
- Muramatsu et al. (2001) T. Muramatsu, N. Tateiwa, T. C. Kobayashi, K. Shimizu, K. Amaya, D. Aoki, H. Shishido, Y. Haga, and Y. Ōnuki, J. Phys. Soc. Jpn. 70, 3362 (2001).
- Knebel et al. (2008) G. Knebel, D. Aoki, J.-P. Brison, and J. Flouquet, J. Phys. Soc. Jpn. 77, 114704 (2008).
- Park et al. (2008) T. Park, V. A. Sidorov, F. Ronning, J.-X. Zhu, Y. Tokiwa, H. Lee, E. D. Bauer, R. Movshovich, J. L. Sarrao, and J. D. Thompson, Nature 456, 366 (2008).
- Vargoz and Jaccard (1998) E. Vargoz and D. Jaccard, J. Magn. Magn. Mat. 177-181, 294 (1998).
- Vargoz (1998) E. Vargoz, Propriétés de transport sous pression de composés à fermions lourds supraconducteurs: CeCu2, CeCu2Ge2 et CeCu2Si2., Ph.D. thesis, Université de Genève (1998).
- Capan et al. (2004) C. Capan, A. Bianchi, F. Ronning, A. Lacerda, J. D. Thompson, M. F. Hundley, P. G. Pagliuso, J. L. Sarrao, and R. Movshovich, Phys. Rev. B 70, 180502 (2004).
- Capan et al. (2009) C. Capan, L. Balicas, T. P. Murphy, E. C. Palm, R. Movshovich, D. Hall, S. W. Tozer, M. F. Hundley, E. D. Bauer, J. D. Thompson, J. L. Sarrao, J. F. DiTusa, R. G. Goodrich, and Z. Fisk, Phys. Rev. B 80, 094518 (2009).
- Sarrao et al. (1999) J. L. Sarrao, C. D. Immer, Z. Fisk, C. H. Booth, E. Figueroa, J. M. Lawrence, R. Modler, A. L. Cornelius, M. F. Hundley, G. H. Kwei, J. D. Thompson, and F. Bridges, Phys. Rev. B 59, 6855 (1999).
- Wada et al. (2008) S. Wada, A. Yamamoto, K. Ishida, and J. L. Sarrao, J. Phys.: Condens. Matter 20, 175201 (2008).
- Thomas et al. (1996) F. Thomas, C. Ayache, I. A. Fomine, J. Thomasson, and C. Geibel, J. Phys.: Condens. Matter 8, L51 (1996).
- Lengyel et al. (2011) E. Lengyel, M. Nicklas, H. S. Jeevan, C. Geibel, and F. Steglich, Phys. Rev. Lett. 107, 057001 (2011).
- Holmes et al. (2005) A. T. Holmes, D. Jaccard, H. S. Jeevan, C. Geibel, and M. Ishikawa, J. Phys.: Condens. Matter 17, 5423 (2005).
- Park et al. (2012) T. Park, H. Lee, I. Martin, X. Lu, V. A. Sidorov, K. Gofryk, F. Ronning, E. D. Bauer, and J. D. Thompson, Phys. Rev. Lett. 108, 077003 (2012).
- Rauchschwalbe et al. (1987) U. Rauchschwalbe, F. Steglich, A. de Visser, and J. Franse, J. Magn. Magn. Mat. 63&64, 347 (1987).
- Aliev et al. (1984) F. G. Aliev, N. B. Brandt, V. V. Moshchalkov, and S. M. Chudinov, J. Low Temp. Phys. 57, 61 (1984), 10.1007/BF00681517.
- Pippard (1989) A. Pippard, Magnetoresistance in Metals (Cambridge University Press, Cambridge, 1989).
- Nakajima et al. (2007) Y. Nakajima, H. Shishido, H. Nakai, T. Shibauchi, K. Behnia, K. Izawa, M. Hedo, Y. Uwatoko, T. Matsumoto, R. Settai, Y. Ōnuki, H. Kontani, and Y. Matsuda, J. Phys. Soc. Jpn. 76, 024703 (2007).
- Ōnuki et al. (1989) Y. Ōnuki, T. Yamazaki, T. Omi, I. Ukon, A. Kobori, and T. Komatsubara, J. Phys. Soc. Jpn. 58, 2126 (1989).
- Araki et al. (2011) S. Araki, Y. Shiroyama, Y. Ikeda, T. C. Kobayashi, S. Seiro, C. Geibel, and F. Steglich, J. Phys. Soc. Jpn. 80, SA061 (2011).
- Fert and Levy (1987) A. Fert and P. M. Levy, Phys. Rev. B 36, 1907 (1987).
- Aliev et al. (1983) F. Aliev, N. Brandt, V. Moshchalkov, and S. Chudinov, Solid State Commun. 47, 693 (1983).
- Sparn et al. (1985) G. Sparn, W. Lieke, U. Gottwick, F. Steglich, and N. Grewe, J. Magn. Magn. Mat. 47&48, 521 (1985).
- Fischer (1989) K. H. Fischer, Z. Phys. B Con. Mat. 76, 315 (1989).
- Link et al. (1996) P. Link, D. Jaccard, and P. Lejay, Physica B 225, 207 (1996).
- Zlatić et al. (2003) V. Zlatić, B. Horvatić, I. Milat, B. Coqblin, G. Czycholl, and C. Grenzebach, Phys. Rev. B 68, 104432 (2003).
- Behnia et al. (2004) K. Behnia, D. Jaccard, and J. Flouquet, J. Phys.: Condens. Matter 16, 5187 (2004).
- Oganesyan and Ussishkin (2004) V. Oganesyan and I. Ussishkin, Phys. Rev. B 70, 054503 (2004).
- Behnia (2009) K. Behnia, J. Phys.: Condens. Matter 21, 113101 (2009).
- Sondheimer (1948) E. H. Sondheimer, P. Roy. Soc. Lond. A Mat. 193, 484 (1948).
- Bel et al. (2004) R. Bel, K. Behnia, Y. Nakajima, K. Izawa, Y. Matsuda, H. Shishido, R. Settai, and Y. Onuki, Phys. Rev. Lett. 92, 217002 (2004).
- Onose, Y. et al. (2007) Onose, Y., Li, Lu, Petrovic, C., and Ong, N. P., Europhys. Lett. 79, 17006 (2007).
- Izawa et al. (2007) K. Izawa, K. Behnia, Y. Matsuda, H. Shishido, R. Settai, Y. Onuki, and J. Flouquet, Phys. Rev. Lett. 99, 147005 (2007).
- Amato et al. (1989) A. Amato, D. Jaccard, J. Sierro, P. Haen, P. Lejay, and J. Flouquet, J. Low Temp. Phys. 77, 195 (1989).
- Solomon and Otter (1967) P. R. Solomon and F. A. Otter, Phys. Rev. 164, 608 (1967).
- Huebener and Seher (1969) R. P. Huebener and A. Seher, Phys. Rev. 181, 701 (1969).
- Ri et al. (1994) H.-C. Ri, R. Gross, F. Gollnik, A. Beck, R. P. Huebener, P. Wagner, and H. Adrian, Phys. Rev. B 50, 3312 (1994).
- Xu et al. (2000) Z. A. Xu, N. P. Ong, Y. Wang, T. Kakeshita, and S. Uchida, Nature 406, 486 (2000).
- Pourret et al. (2006) A. Pourret, K. Behnia, D. Kikuchi, Y. Aoki, H. Sugawara, and H. Sato, Phys. Rev. Lett. 96, 176402 (2006).
- Johannsen et al. (2008) N. Johannsen, S. Süllow, A. V. Sologubenko, T. Lorenz, and J. A. Mydosh, Phys. Rev. B 78, 121103 (2008).