The Star Formation History of M32 111Based on observations made with the NASA/ESA Hubble Space Telescope, obtained at the Space Telescope Science Institute, which is operated by the Association of Universities for Research in Astronomy, Inc., under NASA contract NAS 5-26555. These observations are associated with GO proposal 10572.
Abstract
We use deep HST ACS/HRC observations of a field within M32 (F1) and an M31 background field (F2) to determine the star formation history (SFH) of M32 from its resolved stellar population. We find that 2–5 Gyr old stars contribute of M32’s mass, while of M32’s mass comes from stars older than 5 Gyr. The mass-weighted mean age and metallicity of M32 at F1 are and The SFH additionally indicates the presence of young ( Gyr old), metal-poor () stars, suggesting that blue straggler stars (BSS) contribute % of the mass at F1; the remaining % of the mass is in young metal-rich stars. Line-strength indices computed from the SFH imply a light-weighted mean age and metallicity of 4.9 Gyr and dex, and single-stellar-population-equivalent parameters of Gyr and dex at F1 (). This contradicts spectroscopic studies that show a steep age gradient from M32’s center to .
The inferred SFH of the M31 background field F2 reveals that the majority of its stars are old, with of its mass already acquired 5–14 Gyr ago. It is composed of two dominant populations; of its mass is in a 5–8 Gyr old population, and of the mass is in a 8–14 Gyr old population. The mass-weighted mean age and metallicity of F2 are and , respectively. Our results suggest that the inner disk and spheroid populations of M31 are indistinguishable from those of the outer disk and spheroid. Assuming that the mean age of M31’s disk at F2 ( disk scale length) to be –9 Gyr, our results agree with an inside-out disk formation scenario for M31’s disk.
Subject headings:
Local Group — galaxies: individual: M32, M31 — galaxies: elliptical and lenticular, cD — galaxies: star formation history, stellar content1. A Brief History of Star Formation in M32
M32 (NGC 221) is a compact, low-luminosity elliptical galaxy, satellite of our neighbor M31. Due to its proximity, we can study M32 with great detail not only from its integrated light but also from its individual, resolved stars in a way that is impossible for most of the elliptical galaxies, given their greater distances and high densities. Thus, M32 is a very important galaxy to understand the formation and evolution of low-luminosity spheroidal star systems. However, M32’s SFH, and therefore its origin, is still controversial. The different scenarios proposed to explain its origins extend from a true elliptical galaxy at the lower extreme of the mass sequence (e.g., Faber, 1973; Nieto & Prugniel, 1987; Kormendy et al., 2009) to a threshed spiral galaxy (e.g., Bekki et al., 2001; Chilingarian et al., 2009).
The only way to accurately determine the age, and thus the SFH, of a galaxy is by directly observing its oldest main-sequence turnoff (MSTO). With this goal in mind, we were awarded 64 orbits with HST ACS/HRC to observe two fields near M32, F1 and F2 (Fig. 1), in order to detect the oldest MSTOs of this galaxy.

1.1. The deepest HST CMD of M32
In Monachesi et al. (2011, hereafter Paper I) we introduced our observations and presented the deepest HST color-magnitude diagram (CMD) of M32 yet obtained, reaching more than 2 mag fainter than the RC and fully resolving the RGB and the AGB. Paper I significantly improved our knowledge on the stellar populations of M32. We have found that M32 is dominated by intermediate-age (2–8 Gyr old) and old (8–10 Gyr old), metal-rich () stars and it contains some ancient ( Gyr), metal-poor stars () as well as possible young populations (0.5 – 2 Gyr old stars).
These conclusions were provided by our qualitative analysis of the CMD of M32, which shows a red clump (RC), a red giant branch (RGB), a RGB bump (RGBb), an AGB bump (AGBb), and a blue plume (BP). Figure 12 of Paper I, reproduced here as Figure 2, shows a Hess representation of the CMD of M32 decontaminated of M31 stars, where the different evolutionary features are highlighted. We summarize here the main findings and conclusions of Paper I.

-
•
The core-helium burning stars are concentrated in a RC and its mean color and magnitude suggest a mean age of 8–10 Gyr for a metallicity of in M32.
-
•
The first detection of the RGB bump and the AGB bump in M32 permits a constraint on the mean age and metallicity of the population. This gives a mean metallicity of M32 higher than dex and a mean age between 5 and 10 Gyr.
-
•
The metallicity distribution of M32 inferred from the CMD has a peak at . Overall, the metallicity distribution function implies that there are more metal-rich stars than metal-poor ones. Metal-poor stars with contribute very little, at most 6% of the total -light or 4.5% of the total mass, to M32 in F1, implying that the enrichment process largely avoided the metal-poor stage.
-
•
Bright AGB stars at , i.e. above the TRGB, confirm the presence of an intermediate-age population in M32 (ages of 1–7 Gyr).
-
•
The observed blue plume is genuine, not an artifact of crowding, and contains stars as young as Gyr. The detected blue loop, with stars having masses of – and ages between and Gyr, and the possible presence of a bright SGB are different manifestations of the presence of a young population. However, in Paper I we suggest that it is likely that this young population belongs to the disk of M31 rather than to M32. The fainter portion of the blue plume () does belong to M32 and indicates the presence of stars with ages 1–2 Gyr and/or the first direct evidence of blue straggler stars (BSS) in M32.
-
•
The oldest MSTOs were out of reach, given the severe crowding in F1, and there is no significant BHB observed in F1, so an ancient, metal-poor population cannot be seen directly in our CMD. We have, however, a hint of the presence of such a population from a 2– detection of RR Lyrae stars found in F1 and associated with M32 using our data (Fiorentino et al., 2010).
-
•
In general the CMDs of both fields F1 and F2 show an unexpectedly similar morphology. By subtracting the normalized F1 CMD from the F2 one (see Figure 21 in Paper I), one can detect subtle differences. M31 has a younger and more metal-poor population than M32, and M32 has a more conspicuous intermediate-age population (Fig. 4).
-
•
The CMD of our M31 background field F2 exhibits a wide RGB, indicative of a metallicity spread with its peak at . The presence of a blue plume indicates the presence of stars as young as 0.3 Gyr. Bright AGB stars in F2 reveal the presence of an intermediate-age population in M31.
1.2. Completing the picture of M32’s SFH
The analysis presented in Paper I provided initial constraints on the ages and metallicities of the stellar populations of M32 at F1 and M31 at F2. That work was based on traditional methods of isochrone analysis, and was heavily based on the brighter evolved portions of the CMDs, such as the RC, RGB, and bump (RGBb and AGBb) features.
The approach in this paper is independent. Here we use a sophisticated method of CMD analysis and decomposition that digs into the fainter, severely-crowded portions of the CMDs near the MSTO and sub-giant branches. We recover information from the brighter MSTOs present in the CMDs, thus providing quantitative information about the younger populations of M32. In this paper, we derive the detailed young and intermediate-age SFH of M32 at from its center and of M31 at our background field’s location, which was not possible from the analysis in Paper I. We find that our field in M32 has a substantial population of 2–5 Gyr old stars contributing to of its mass, an unexpectedly large population of young stars at such a large distance from the center of an elliptical galaxy.
The paper is organized as follows. In Section 2 we briefly describe our observations and photometry. Section 3 describes the method used to derive the SFH. We present the results of the SFH analysis obtained for F1, F2 and M32 in Section 4. In Section 5 we provide a detailed and complete SFH of M32 and discuss its implications on M32’s origins, synthesizing a complete picture based on both the present and Paper I analyses. In Section 6 we discuss the SFH of the inner regions of M31. Finally, we summarize our results and present our conclusions in Section 7.
2. Observations and Photometry
The field selection and observational strategy as well as the image reduction are described in Paper I and we refer the reader to that paper for details. Briefly, HST ACS/HRC images of two fields near M32 were observed during Cycle 14 (Program GO-10572, PI: Lauer). The M32 HRC field (F1) was centered on a location south (the anti-M31 direction) of the M32 nucleus. The background field (F2) was located from the M32 nucleus, roughly along its minor axis, at the same isophotal level in M31 as F1. The field locations are shown in Figure 1.
Each field was observed for 16 orbits in each of the () and () filters. All of the images were combined in an iterative procedure designed to detect and repair cosmic-ray events, hot pixels, and other defects, with a Nyquist-sampled summed image as the final product (Lauer, 1999). Color images of F1 and F2 are shown in the left and right panels of Figure 3, respectively, where the strong crowding in these fields is clearly visible. There is however a difference between the stellar density in F1 and F2: the crowding is more severe in F1 than in F2. This can also be seen from the bottom panels of Figure 3, where zoomed-in images of the top panels are shown.


Stellar photometry was performed on deconvolved combined images. A detailed description of the deconvolution process is explained in Paper I. In short, deconvolution was performed on the final images using the Lucy-Richardson algorithm (Lucy, 1974; Richardson, 1972) and empirically constructed PSFs, one for each image. Stars were identified in the deconvolved images and their fluxes were measured. Change transfer efficiency (CTE) and aperture corrections were applied to the magnitudes, which transform the instrumental magnitudes into calibrated, apparent magnitudes.
Figure 4 shows the CMDs derived for F1 (left panel) and F2 (right panel) from the deconvolved photometry, calibrated onto the VEGAmag system. They contain 58143 and 27963 stars, respectively, as indicated in Table 1. A qualitative analysis of these CMDs allowed us to gain some insights into its stellar populations. This was discussed in detail in Paper I and we have summarized our conclusions above.
Note the difference between the CMD of F1 and F2 at magnitudes between and 28 (cyan boxes in Figure 4) . The number of stars in this region, where the brighter MSTOs are located, is larger in F1 than F2. This suggests that there is a bigger contribution of intermediate-age stars in F1 than in F2. We can better appreciate this difference in Figure 21 of Paper I, where we showed a Hess subtraction of the normalized F1 CMD to the F2 CMD.
| Field | DetectionsaaFinal number of stars detected and used to derive CMDs | bbPSF radius in HRC original pixels | bbPSF radius in HRC original pixels | ACF435WccAperture correction | ACF555WccAperture correction |
|---|---|---|---|---|---|
| F1 | 58,143 | 5 | 5 | ||
| F2 | 27,963 | 6 | 16 |
2.1. Crowding tests
We performed artificial star tests (ASTs) to assess the completeness level and quantify the photometric errors of our data. This is a crucial step for the derivation of the SFH. The distribution of stars in the observed CMD is modified from the actual distribution due to the observational effects, particularly at the fainter magnitudes where most of the information from the older star formation is encoded. The ASTs are used to simulate the observational effects in the synthetic CMDs that are then compared with the observed CMDs in the analysis described below.
The procedure and results of the ASTs are presented in Paper I and we refer to that paper for further details; we give a brief description here in order to provide guidance for later sections of this paper. We used IAC-STAR (Aparicio & Gallart, 2004) to generate artificial stars with realistic colors and magnitudes covering not only the entire color and magnitude range of the observed stars but also magnitudes fainter. We injected the artificial stars into the real images after transforming their magnitudes into instrumental ACS/HRC fluxes. The number of stars injected per experiment is 2000, to avoid increasing the already severe crowding of the real images. We performed 250 ASTs per field/filter combination for a total of 1000 ASTs. The images containing real and artificial stars are photometered exactly in the same way as the original images. A comparison of the known injected magnitudes and colors of the artificial stars to those obtained from their photometry allows us to quantify the photometric errors. The completeness of our data at a given color and magnitude is calculated as the ratio of recovered-to-injected artificial stars on that color and magnitude bin.
The results obtained from these ASTs indicate that the limiting magnitudes of the F1 and F2 CMDs are and , respectively, nearly independent of color. The CMD of F2 is therefore slightly deeper than that of F1 (cf. Figs. 8 and 9 of Paper I). The 50% completeness level as well as the photometric errors derived from the ASTs for F1 and F2 are indicated in Figure 4.

3. The IAC Method to resolve the SFH
To extract the detailed SFH of F1 and F2 we use the well-known method of fitting synthetic CMDs to the data (see e.g., Tosi et al., 1991; Bertelli et al., 1992; Tolstoy & Saha, 1996; Aparicio et al., 1997). There are currently many approaches to derive detailed SFH of galaxies (e.g., StarFISH: Harris & Zaritsky 2001, MATCH: Dolphin 2002, IAC-pop/MinnIAC: Aparicio & Hidalgo 2009; Hidalgo et al. 2011) as well as several different stellar libraries (e.g., BaSTI: Pietrinferni et al. 2004, Padova/Girardi: Girardi et al. 2000; Marigo et al. 2008) available to compute the required synthetic CMDs. We use the IAC-pop/MinnIAC method and adopt the BaSTI and Padova stellar libraries. The IAC-pop code (Aparicio & Hidalgo, 2009) uses a modified merit-function (Mighell, 1999) to compare the observed and synthetic star counts in different boxes (see below) of the CMDs. A genetic algorithm (Charbonneau, 1995) is adopted to minimize . An important characteristic of the code is that it solves the SFH simultaneously for age and metallicity distributions. It thus provides the SFH of a stellar system as a linear combination of simple populations, i.e. within small ranges of age and metallicity. We refer the reader to Aparicio & Hidalgo (2009) and Hidalgo et al. (2011) for more details.
It is important to emphasize that, for the current analysis, we have mainly used information from the extended MS, MSTO and SGB regions of the CMDs, as we will see below. We have excluded the RC and most of the RGB regions, which were the main features analyzed in Paper I and from which we obtained estimates on the age and metallicity of M32. This is because the physics governing these phases are more uncertain than those on the MS and SGB, and differences between stellar libraries are more severe (Gallart et al., 2005). For instance, the morphology and number of stars occupying the HB/RC evolutionary phases depend on unknown issues, like mass loss on the RGB or He-core mass. Small differences in the adopted physics can significantly alter the number of stars and morphology of these CMD regions. The CMD regions that we probe in this paper allow us to obtain detailed information about the young and intermediate-age populations of M32, something that was not possible in Paper I, but conversely, we cannot make a quantitative analysis of the older populations and so we must rely on the qualitative results of Paper I.


3.1. Steps carried out to obtain the SFH
1) Synthetic CMD. We first generate a synthetic CMD using IAC-STAR (Aparicio & Gallart, 2004). The bolometric corrections applied to both libraries are those of Origlia & Leitherer (2000) which transform the theoretical tracks into the ACS/HRC photometric system. We assume a constant star formation rate (SFR) from 0 to 14 Gyr, and metallicities from () to () uniformly distributed at all ages. Note that there is no assumed age–metallicity relation as input, and the selected age and ranges are broader than those expected for the solution. This allows the code to find the SFH solution with minimum constraints and ensures no lost information. We adopted a Kroupa (2002) initial mass function (IMF)111Given that the range of masses we have in our observed CMD is rather small and centered around , where the IMF is not especially sensitive to changes, we do not expect the effective SFH solution to significantly change if we assume another IMF. However, since the large number of lower mass stars are not well constrained by the data, different assumptions of the IMF will affect the normalization of the SFH, i.e. the total mass of the system. from 0.1 to . The IMF has a slope of 1.3 for stars with masses lower than and 2.3 for stars with higher masses. We assume a 35% binary fraction with a relative mass ratio randomly distributed between 0.5 and 1 (the impact of different binary fractions on the solution is discussed in the Appendix). The synthesized CMD, shown in the left panel of Figure 5, contains stars and its faintest magnitude is 2 magnitudes fainter than the 50% completeness level of our data. Observational effects (incompleteness and photometric errors) are simulated using information obtained from the ASTs described above (see Hidalgo et al., 2011, and references therein for a detailed description of this procedure). The right panel of Figure 5 shows the synthetic CMD after observational effects are simulated. We call it a “model CMD” following Aparicio et al. (1997)’s notation. The model CMD is the one to be compared with the observed CMD for the derivation of the SFH of our fields.
2) Parametrization of the CMDs. This is the main input of the IAC-pop code and was performed using MinnIAC (Hidalgo et al., 2011), a set of routines specially designed for this purpose. We first define the “simple populations”, the age and metallicity bins in which the model CMD is to be divided. These simple populations represent the bins in which the SFH is to be determined. The boundaries of the bins that we used are [0, 0.5, 1, 2, 5, 14] years in age and [0.02, 0.40, 0.80, 1.00, 2.00, 4.00] in , corresponding to , , , , , ], assuming . These constitute simple populations. The resolution in age and metallicity was selected, after several experiments on mock stellar populations, as the optimal choice for our data given the observational uncertainties222Experiments on mock stellar populations were conducted as follows: we generated synthetic CMDs from arbitrary SFHs to which we apply the observational effects of our observed CMDs obtained from the ASTs. We then solved for their SFHs using the IAC-POP/MinnIAC method as if they were real data, adopting different age and metallicity resolutions as first reasonable guesses according to the limiting magnitude of our data. The SFH solutions were compared with the input SFHs, and when these agreed to within , we assumed the corresponding age and metallicity resolutions were optimal.. Note that the bin width in age increases significantly for older populations. This is due to the limits imposed by the crowding; we cannot extract more detailed information about the oldest stars.


We then define five “bundles”, macro-regions of the CMDs used for the fitting. We show the CMDs of F1 and F2 with the selected bundles superimposed in Figure 6. The bundles are subdivided into boxes, whose sizes vary from bundle to bundle. The bundles and boxes are equally sampled in the observed and model CMDs. Since the number of stars in each box is the information provided to the IAC-pop code, the different bundle subdivisions provide the weights that a given CMD region has on the derived SFH. For instance, CMD regions well-populated and/or where the input physics is better understood (e.g., bundle 1) have smaller boxes than CMD regions where either the number of stars is smaller or the uncertainties in the input physics significantly impact stellar interior models (e.g., bundle 5). The properties of the boxes for each bundle are specified in Table 2 and both the observed and model CMDs with one sample of the boxes superimposed are shown in Figure 7. Note that the boxes inside the bundles are shifted during the dithering process, as explained below, and only stars inside a bundle are considered in the analysis, no matter how big the box is. Also note that only stars brighter than the 50% completeness level were used to extract the SFH (cf. Fig. 6). Below this region, most of the information is lost and results obtained from lower-completeness regions are unreliable (see also the right panel of Fig. 5). Also, as mentioned above, we did not use most of the RGB and RC. Adding bundles in those regions significantly increased from to . Bundles 4 (bluer than the observed MS) and 5 (redder than the observed RGB) were adopted to mainly constrain the lowest and highest metallicity, respectively, in the observed CMD. There are nearly no observed stars in these regions (see Fig. 6), whereas there are stars in the model CMD (see right panel of Fig. 5). The fact that stars of certain ages and metallicities appear in the model CMD but not in the observed one, indicates that those simple populations are not present in M32.

3) Solution. For a given parametrization, i.e., box sizes and simple population boundaries, MinnIAC counts the stars in each of the boxes for both the observed and model CMDs. The number of stars in each box is the input information to run IAC-pop. IAC-pop compares the observed and model star counts in each box using a modified merit-function (Mighell, 1999), calculating which combination of simple populations best reproduces the observed CMD. A SFH solution is obtained as a linear combination of the simple populations. Thus, IAC-pop solves the SFH considering the age and metallicity as independent variables.
| Bundle | # of boxes | Size of boxes (color, mag) | CMD region sampled |
|---|---|---|---|
| 1 | 500 | (0.01, 0.20) | lower MS |
| 2 | 150 | (0.03, 0.30) | upper MS |
| 3 | 3 | (0.50, 0.40) | SGB |
| 4 | 7 | (0.50, 0.50) | left of the MS |
| 5 | 5 | (0.50, 0.90) | Right of the RGB |
4) Uncertainties and stability of the solution. To minimize biases in the solution due to the sampling of the CMD, MinnIAC allows slight changes in the input parameters. The simple populations (i.e. the age and metallicity bins) are shifted three times a 30% of their corresponding bin sizes for each of the following four different configurations: (1) shifting the age bin toward increasing age at fixed metallicity, (2) shifting the metallicity bin toward increasing metallicity at fixed age, (3) shifting both age and metallicity bins toward increasing values, and (4) shifting both age and metallicity bins toward decreasing age and increasing metallicity. Furthermore, for each of these 12 shifts, the boxes are shifted a fraction of their [color, magnitude] sizes three times: [80%, 20%], [20%, 80%] and [20%, 0%], respectively. These 36 sets of parameters are used to generate 36 individual solutions. The final SFH solution is the average of these. This “dithering” process significantly reduces fluctuations in the solution associated with the sampling (Hidalgo et al., 2011). The standard deviation of the “dithers” provides a measurement of the uncertainties on the solution (see Aparicio & Hidalgo, 2009, for further discussion of uncertainties in the solution).
To account for uncertainties in the distance modulus (: Paper I), reddening (: Burstein & Heiles 1982), aperture corrections (Paper I), and other systematics possibly affecting the zero points of our photometry, we allow the observed CMD (not the model) to shift in both color and magnitude. The observed CMD is shifted four times in magnitude and six times in color. The bundles are correspondingly shifted. MinnIAC repeats the entire process of generating the input information and averages the 36 individual solutions generated by IAC-pop, for each of the positions in a magnitude–color grid. The grid has 35 nodes, where the shifts in magnitude are (, , , , ), and the shifts in color are (, , , , , , ). In total we generate individual solutions for each field (F1 and F2) and library (BaSTI and Padova/Girardi) combination.
5) Final best solution. After the observed CMD-shifting and “dithering” process, we have 35 averaged solutions, one for each color-magnitude node. Among the 35 mean solutions, the one with the lowest is chosen to be the final solution that best reproduces our observed CMD.
3.2. Best SFH solutions for F1 and F2
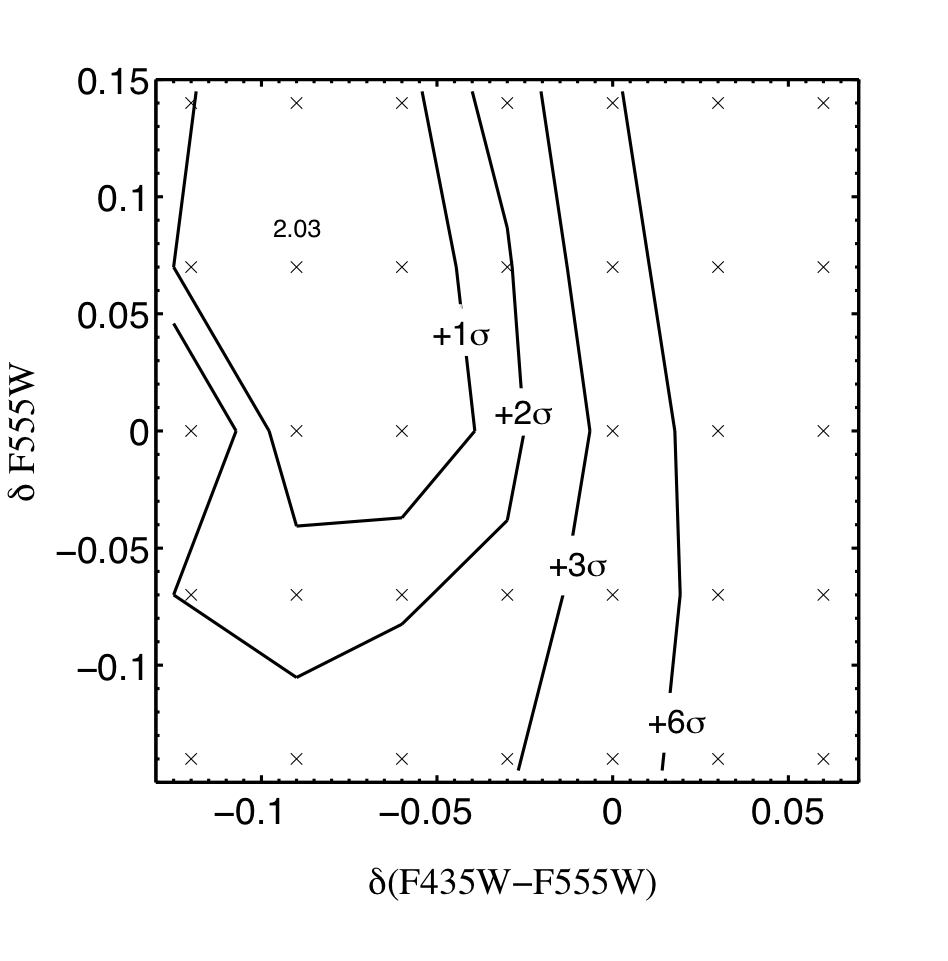
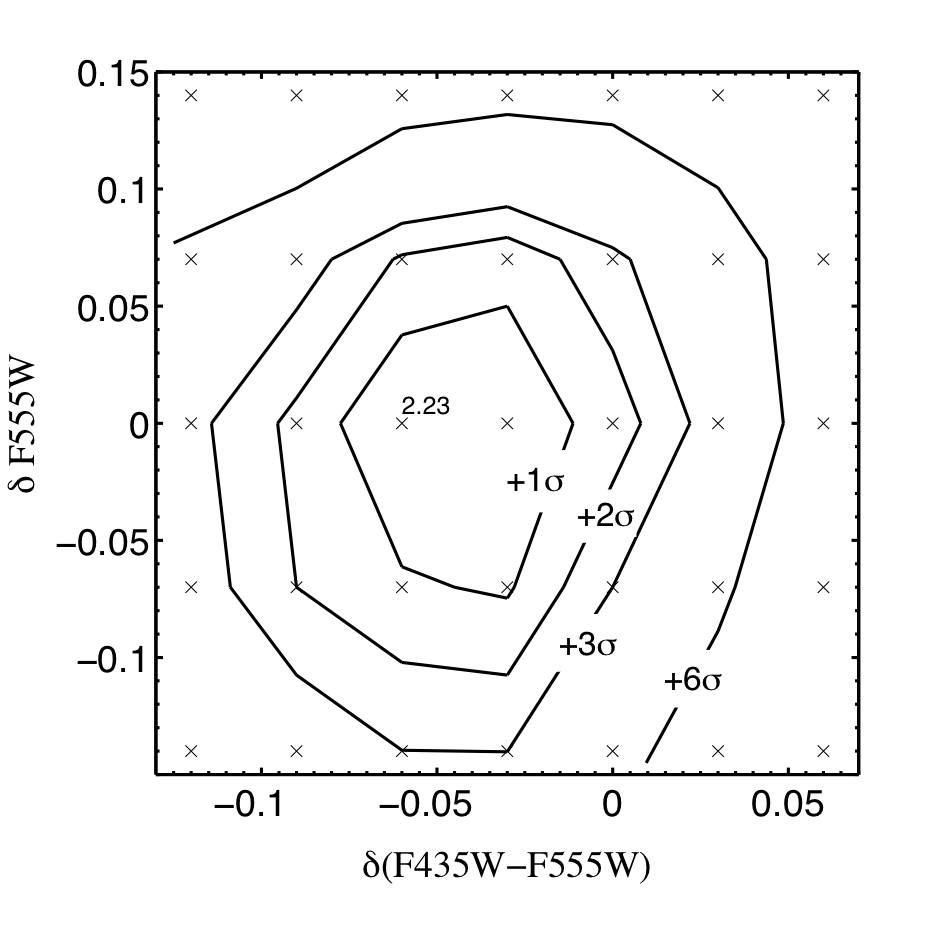
As previously mentioned, for each shift in color and magnitude of the observed CMD, we average the 36 individual solutions as well as its corresponding . For a 35% binary fraction, the nodes at which the mean minimum , i.e. was reached were found at for F1 with , and at for F2 with . We consider the averaged solution corresponding to as the one that best reproduces our observations. Figure 8 shows how the mean varies as a function of the color and magnitude shifts applied to the observed CMD in F1 (left panel) and F2 (right panel), using the BaSTI library and 35% of binary fraction. The crosses indicate the 35 nodes at which we calculated a mean , average of the 36 from the individual solutions. The contours around the minimum (whose value is indicated in the figure at the position where it was found) show the 1–, 2–, 3– and 6– confidence regions, with defined as the standard deviation of the mean . We emphasize here that the shifts in the observed CMD at which we obtained the best solution do not necessarily represent corrections to the distance or reddening estimates, since photometric corrections and model systematics are also present.
The values suggest that the BaSTI library fits the data better than the Padova/Girardi isochrones for both fields (see Table 4 in the Appendix). Nevertheless, the solutions obtained with both libraries are very similar, with the Padova/Girardi isochrones generating a best-fit mean solution slightly more metal-rich than BaSTI. For simplicity, we consider the solutions obtained using the BaSTI library for most of the following analysis.
4. Results of the SFH Analysis
4.1. The SFH of F1 and F2
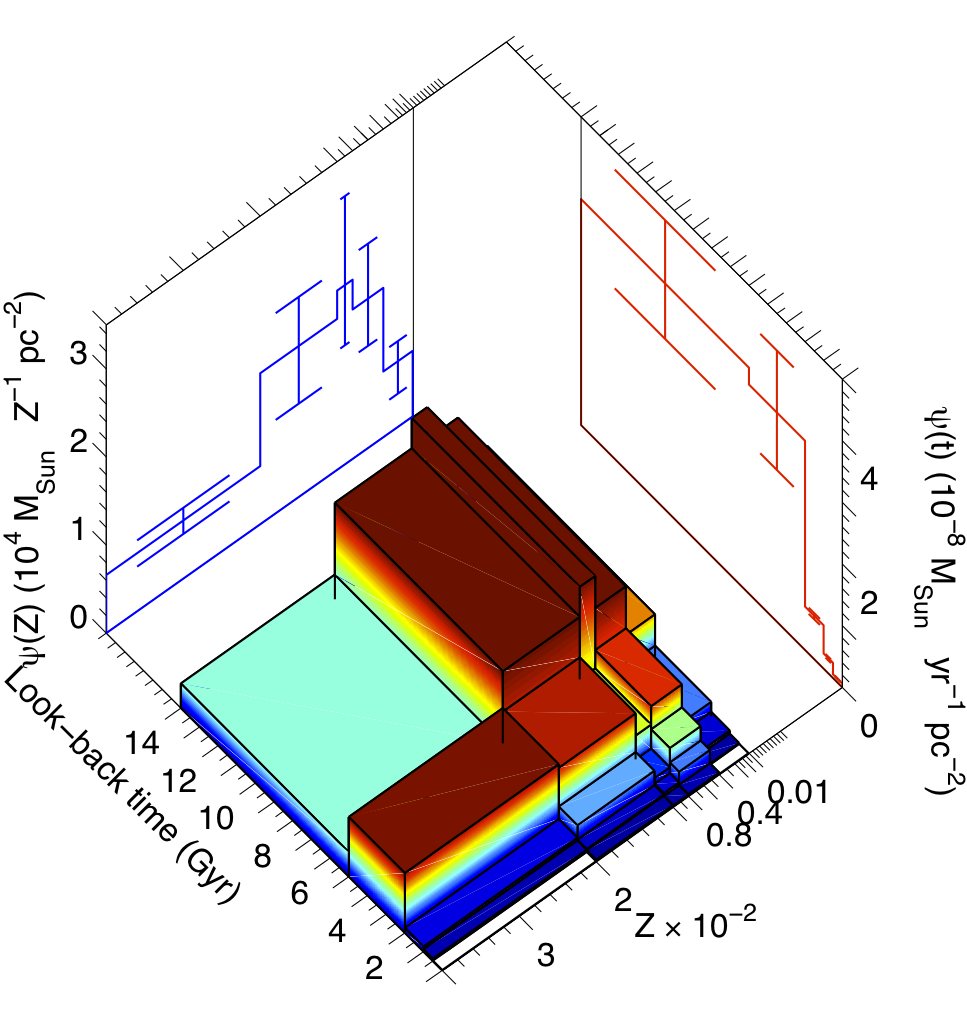
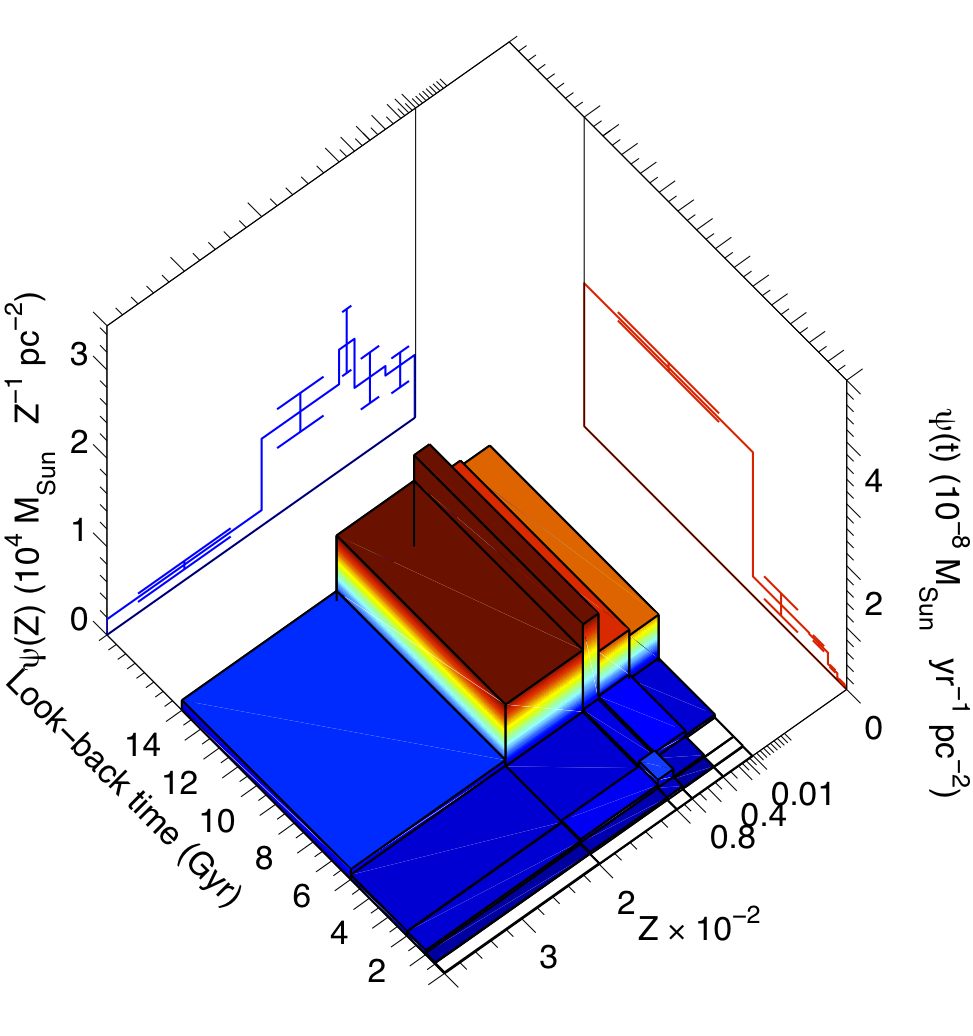
In Figure 9 we show the best-fit mean SFH solution for F1 (top panel) and F2 (bottom panel) in a 3D-histogram representation, as well as the two projections (red line) and (blue line). is the SFR as a function of time or age distribution, i.e. integrated over metallicity, and is the metallicity distribution function, i.e. integrated over time. Both distributions are normalized by the area in . Recall that field F2 has the number of stars as in F1.
The most striking feature of Figure 9 is the significant star formation in F1 that occurred 2–5 Gyr ago. F2 is predominantly old, with some contribution of young and intermediate-age stars from 0.5 to 5 Gyr ago, but its 2–5 Gyr old population is clearly not as prominent as that of F1. We emphasize here that differences in the intermediate-age population between the fields were expected (see Paper I and Fig. 4). However, the significant SFR in the 2–5 Gyr bin in F1 compared with F2 is rather surprising. As F1 has contributions from both M32 and M31 stars and F2 is expected to have a negligible contribution from M32, the derived SFHs suggest that the 2–5 Gyr old population in F1 is associated almost entirely with M32. We discuss this further in the next section. To obtain the mean age and metallicity of the system, we weight such quantities by the mass of each bin in age or metallicity, respectively. We call them hereafter mass-weighted mean age and mass-weighted mean metallicity.
| Field | (Gyr) | (dex) | int(SFH) () |
|---|---|---|---|
| BaSTI library | |||
| F1 | |||
| F2 | |||
| M32 (F1-F2) | |||
| F2aaSFH of F2 was derived using BaSTI library with an extra age bin, from 5–8 Gyr. | |||
| Padova/Girardi | |||
| F1 | |||
| F2 | |||
| M32 (F1-F2) | |||
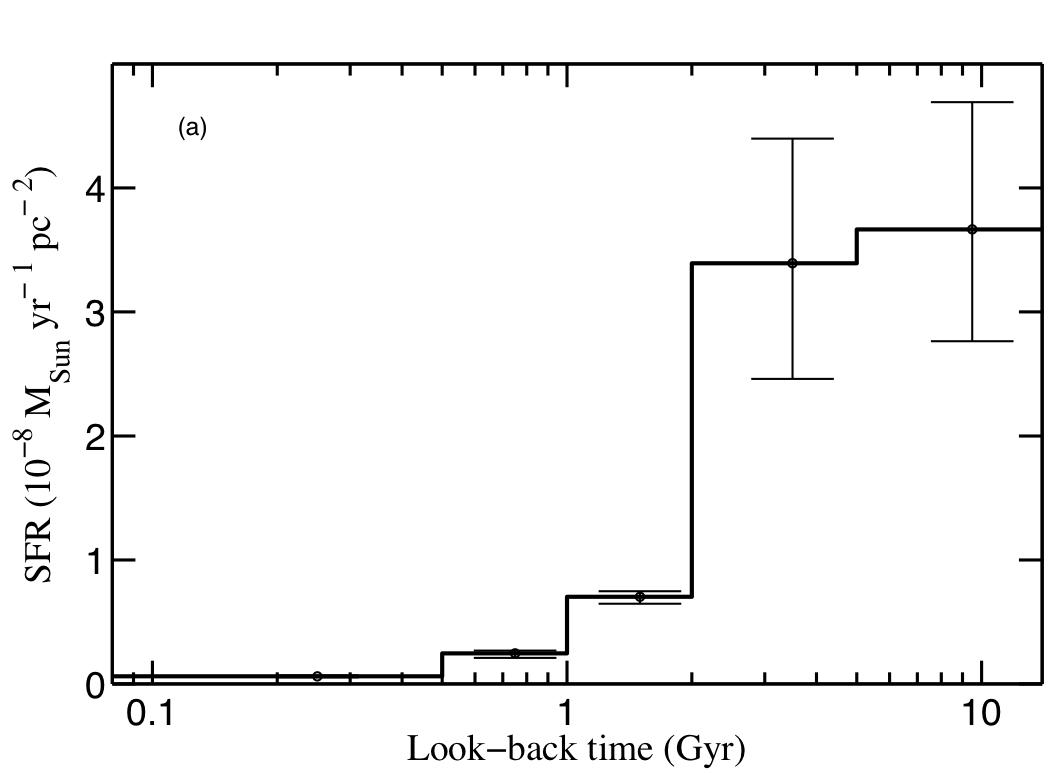
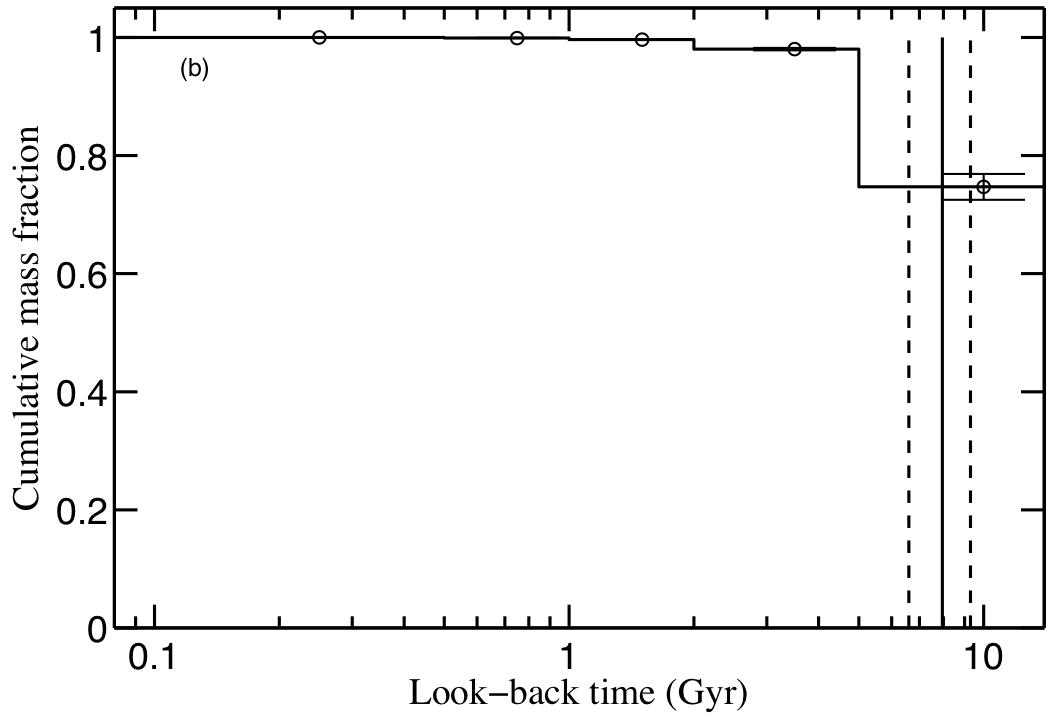
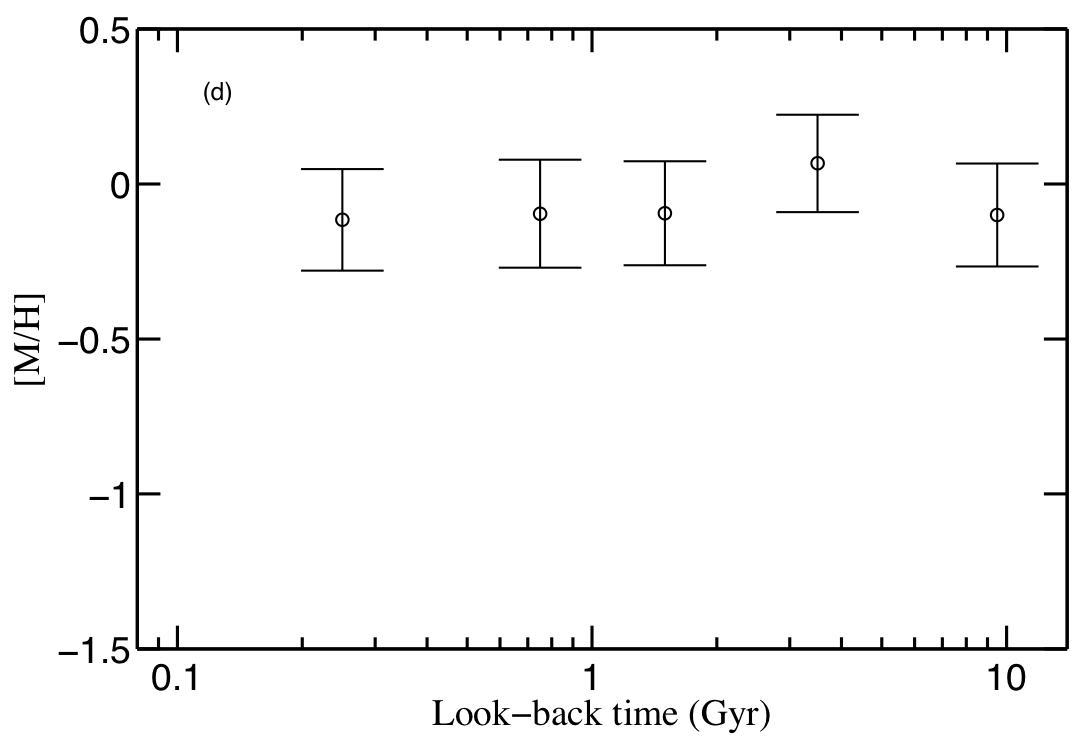
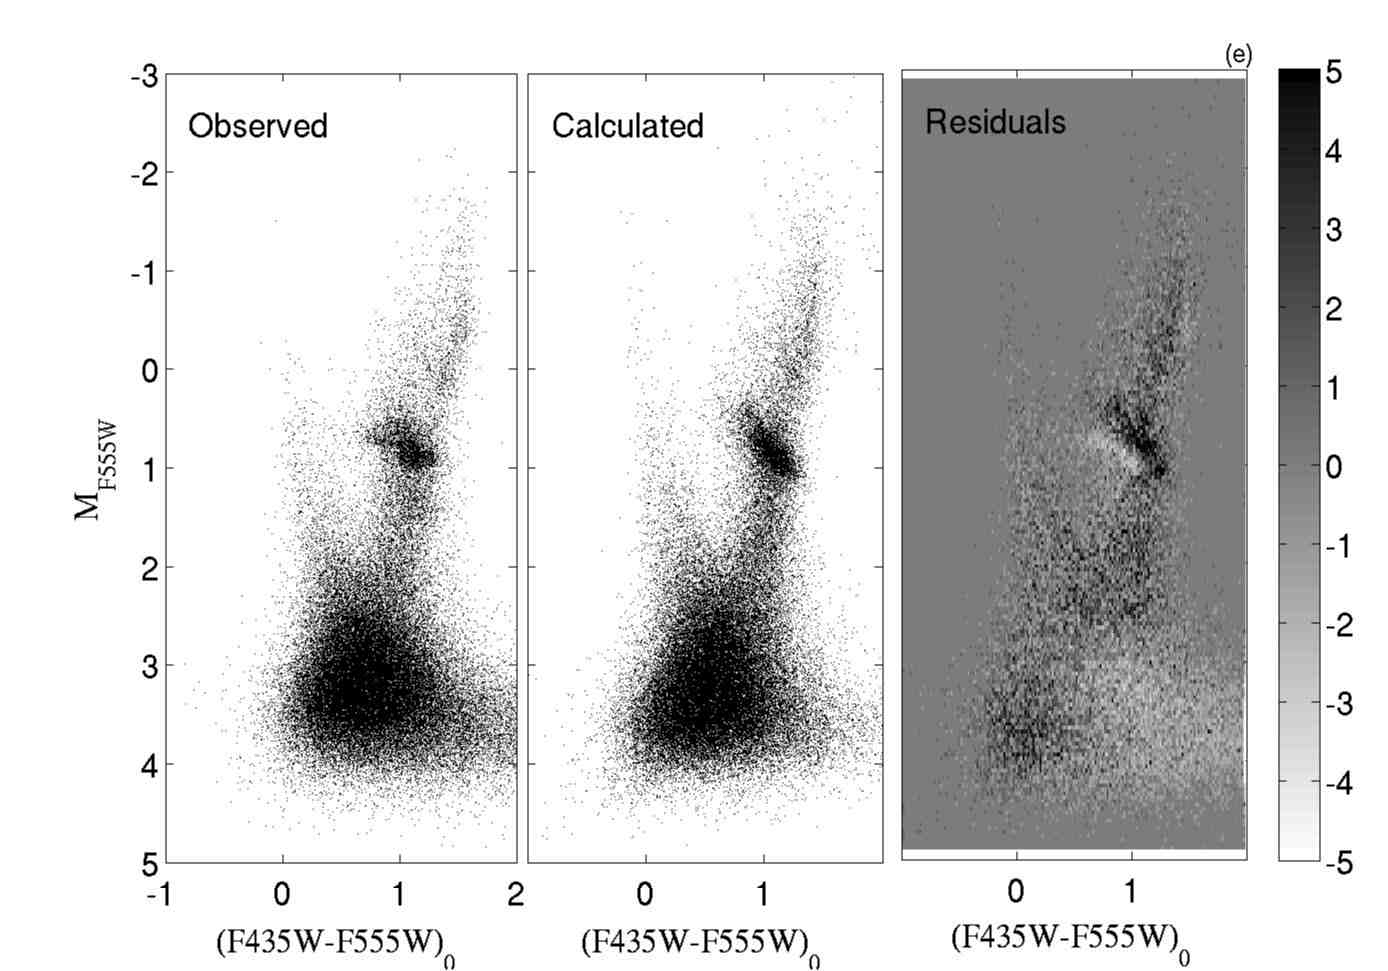
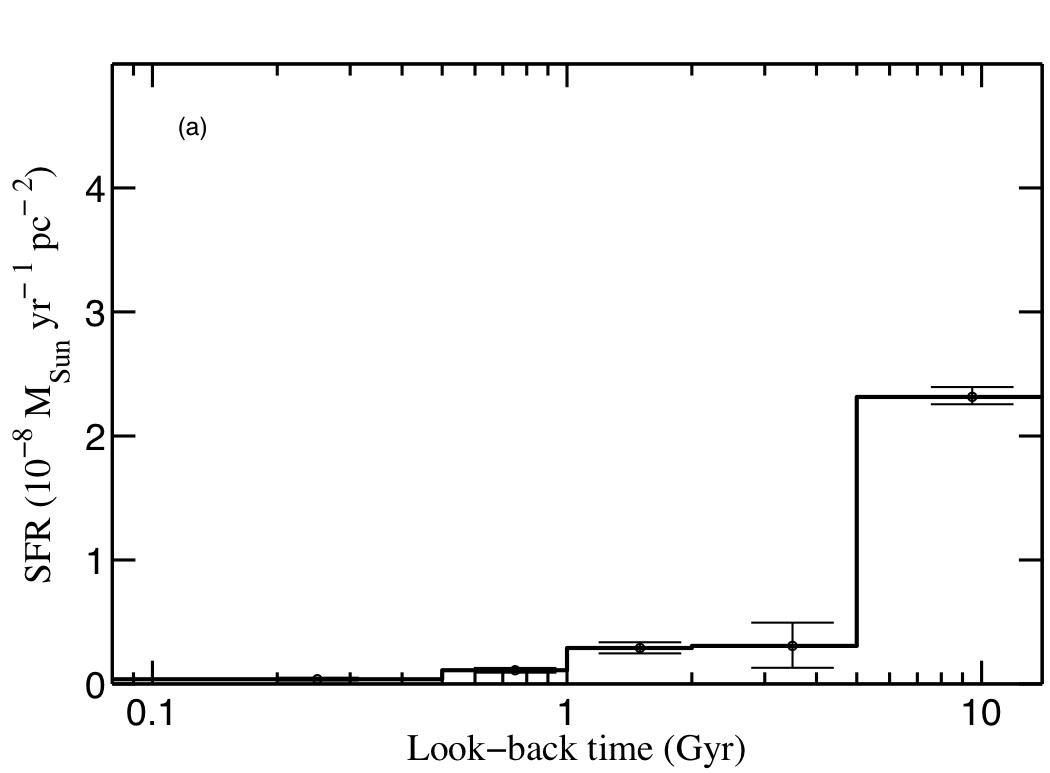
Figures 10 and 11 display the main results projected from the extracted SFHs of F1 and F2, respectively. We find that:
-
•
F1 acquired 75% of its stellar mass between 5 and 14 Gyr ago. Stars with ages of 2–5 Gyr contribute 23% of the mass in F1. The remaining 2% of mass in F1 is constituted by stars younger than 2 Gyr.
-
•
F1 is metal-rich with an almost constant age–metallicity relation, to the limits of the age resolution of the CMD.
-
•
F1’s mass-weighted mean age is Gyr and its mass-weighted mean metallicity is (Table 3).
-
•
F2 is predominantly old, with 95% of its mass already formed 5–14 Gyr ago. There is a small contribution of mass to the system after that, and it stopped forming stars 0.5 Gyr ago.
-
•
F2 is also quite metal-rich, but is marginally more metal-poor than F1, with a slight age–metallicity relation showing a small increase in metallicity at younger ages.
-
•
F2’s mass-weighted mean age is Gyr and its mass-weighted mean metallicity is (Table 3).
The integrated quantities derived for the SFHs of F1 and F2 using Padova/Girardi Library are also indicated in Table 3.
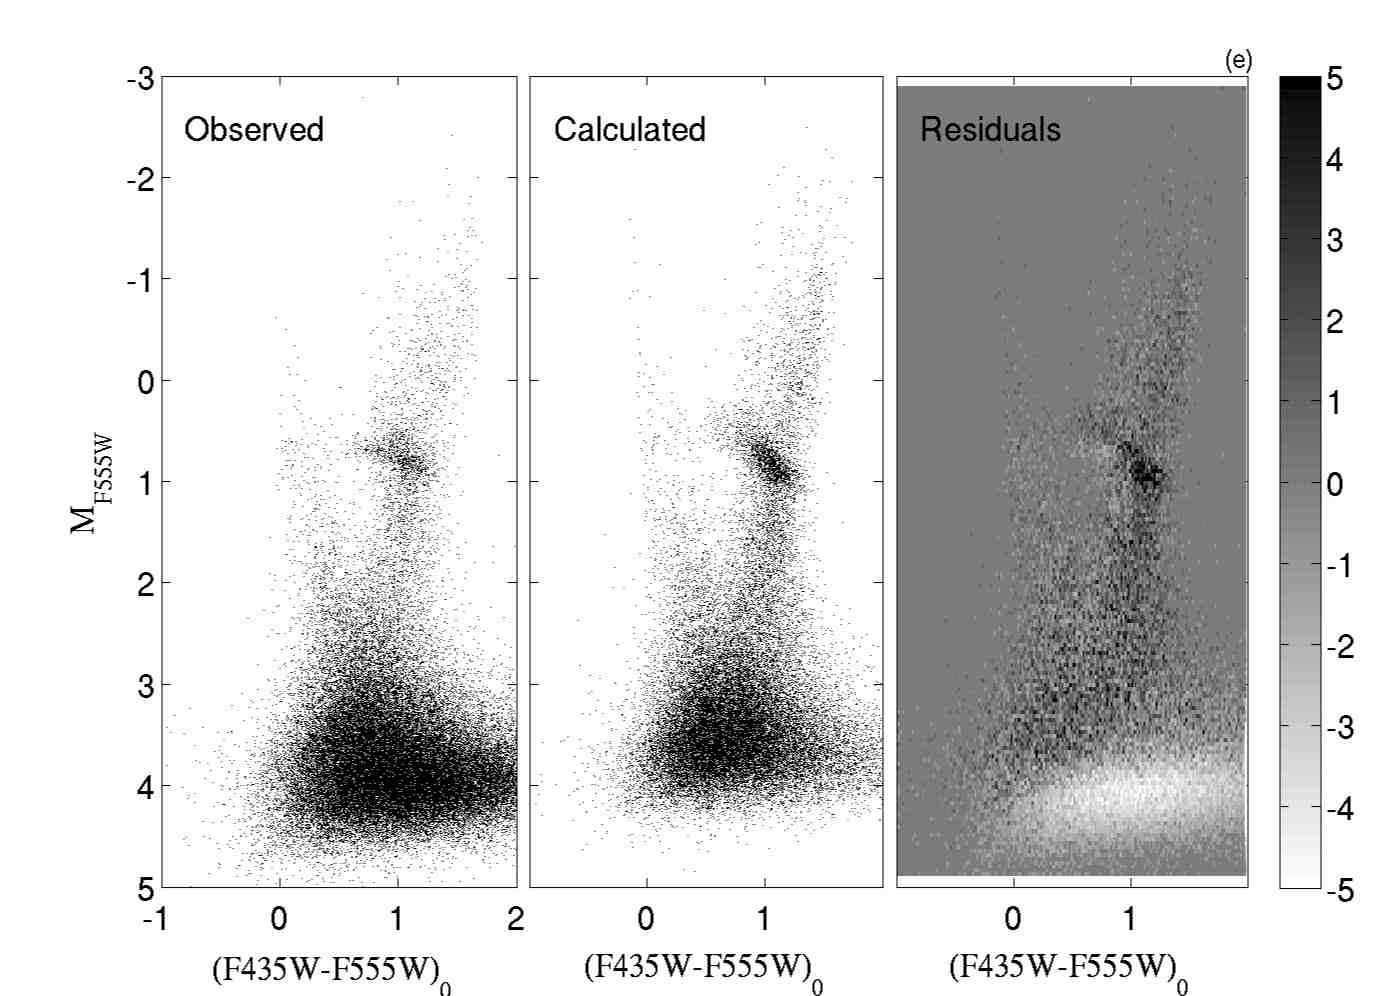
Figures 10e and 11e show comparisons between the observed (left) and calculated CMD (middle) as well as the Hess diagram of the residuals in units of the Poisson uncertainties (right), for F1 and F2 respectively. The calculated CMDs have been obtained by randomly extracting stars from the synthetic CMDs in such a way that the resulting star distribution follows the best calculated SFHs. For both F1 and F2, the model CMD shows reasonable agreement with the observed CMD throughout most evolutionary phases, which is also reflected in the residual Hess diagrams. The RC regions, however, show significant discrepancies. This is not surprising; due to uncertainties in, e.g., the mass loss during the RGB or the He content of the stars, that particular evolutionary stage is not well-modeled (Gallart et al., 2005)—but we have not used this region in deriving the solutions. There is also some discrepancies for magnitudes fainter than the 50% completeness level, but this region was also not used for the derivation of the SFHs.
4.2. The SFH of M32 as revealed by the IAC method
To calculate the SFH of M32, we make use of the derived SFHs of F1 and F2333We would ideally need a deep CMD composed solely of M32 stars to derive the SFH of M32, which we attempted to derive in Paper I. Under the assumption that the M31 stellar populations in F1 and F2 are statistically the same, we subtracted the stars of the F2 CMD from the CMD of F1 taking into account the difference in crowding of the fields. This produced the deepest CMD of M32 yet obtained. However, the use of such CMD to extract the SFH of M32 would introduce uncertainties associated with the decontamination process.. Given the fact that both SFHs have been obtained using the same stellar population sampling, and assuming that the SFH of M31 in F1 and in F2 is identical and that M32 is not present in F2, calculating the SFH of M32 is straightforward: we simply subtract the SFH of F2 from that of F1.

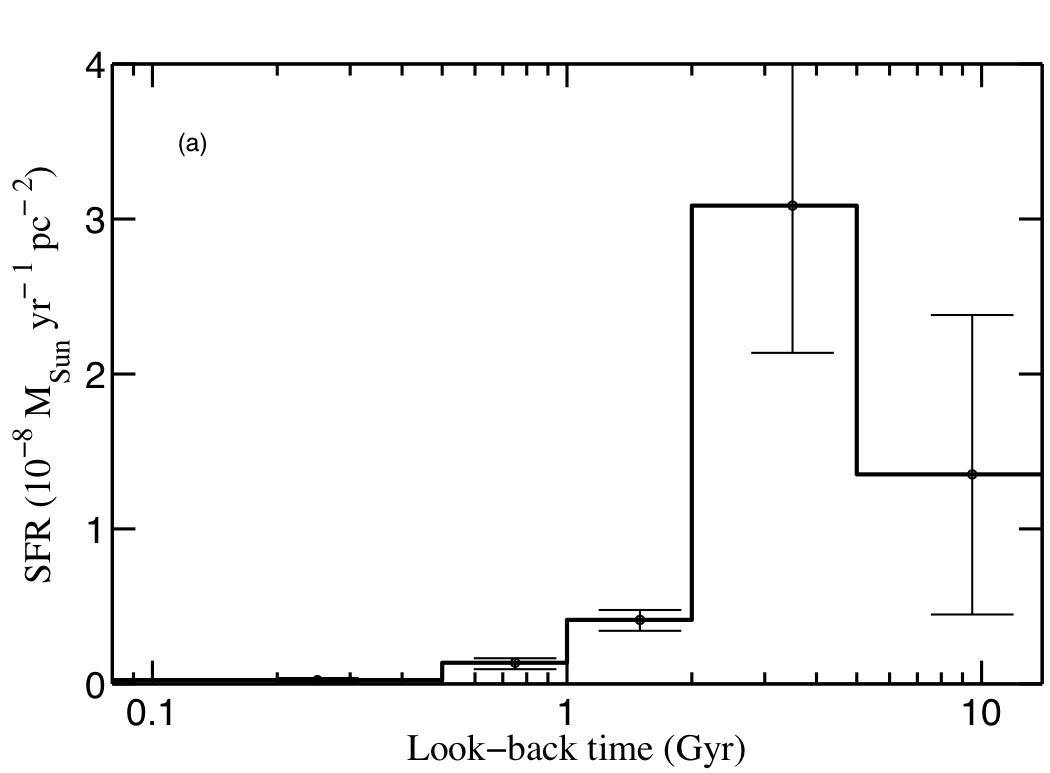
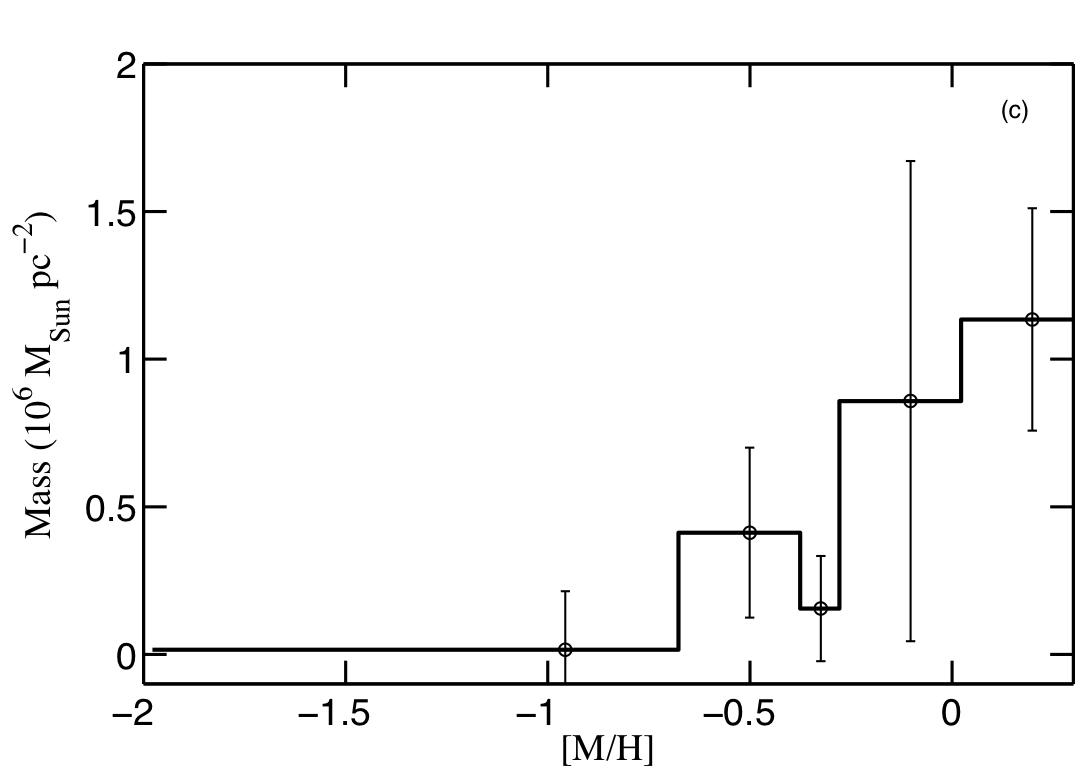
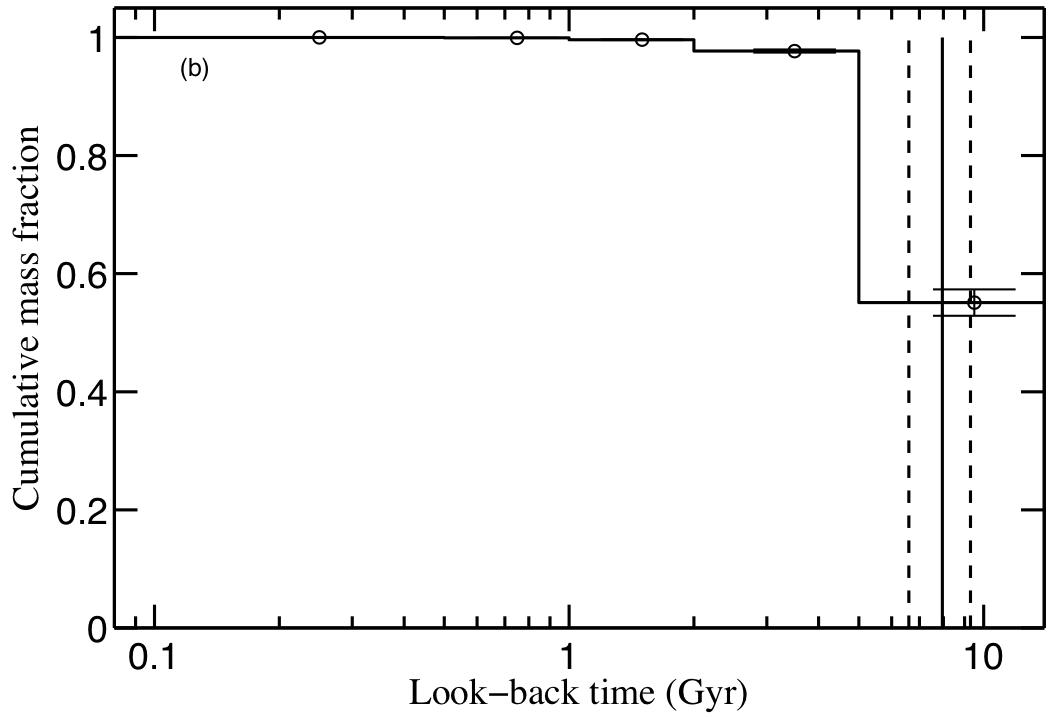
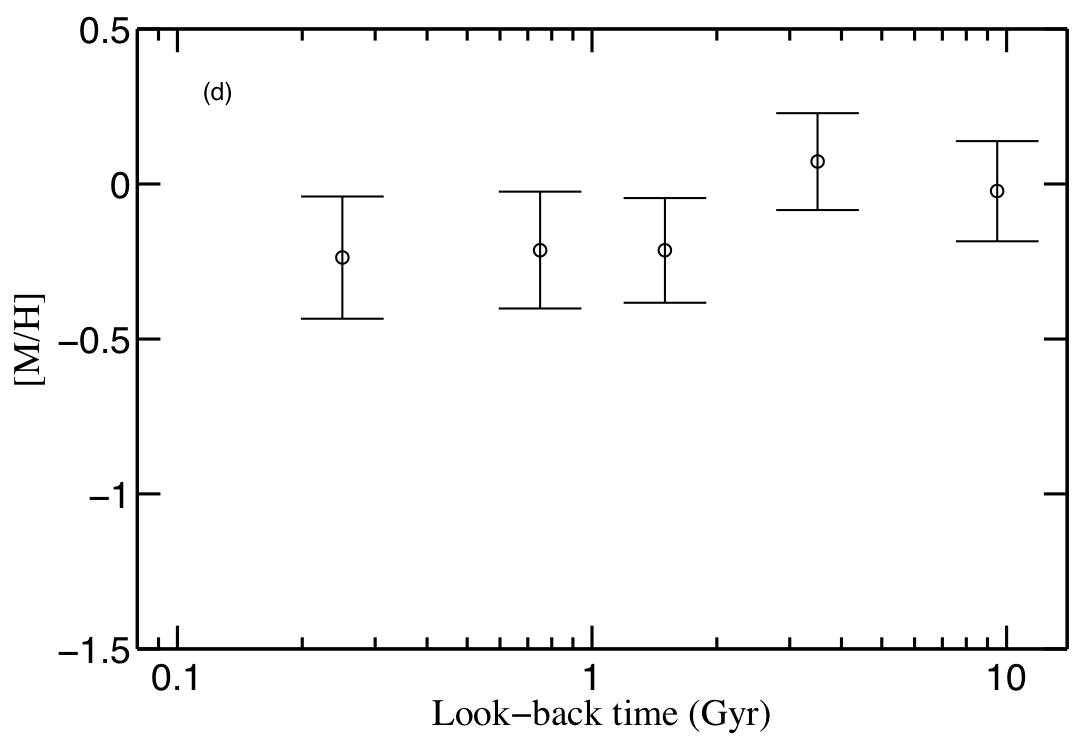
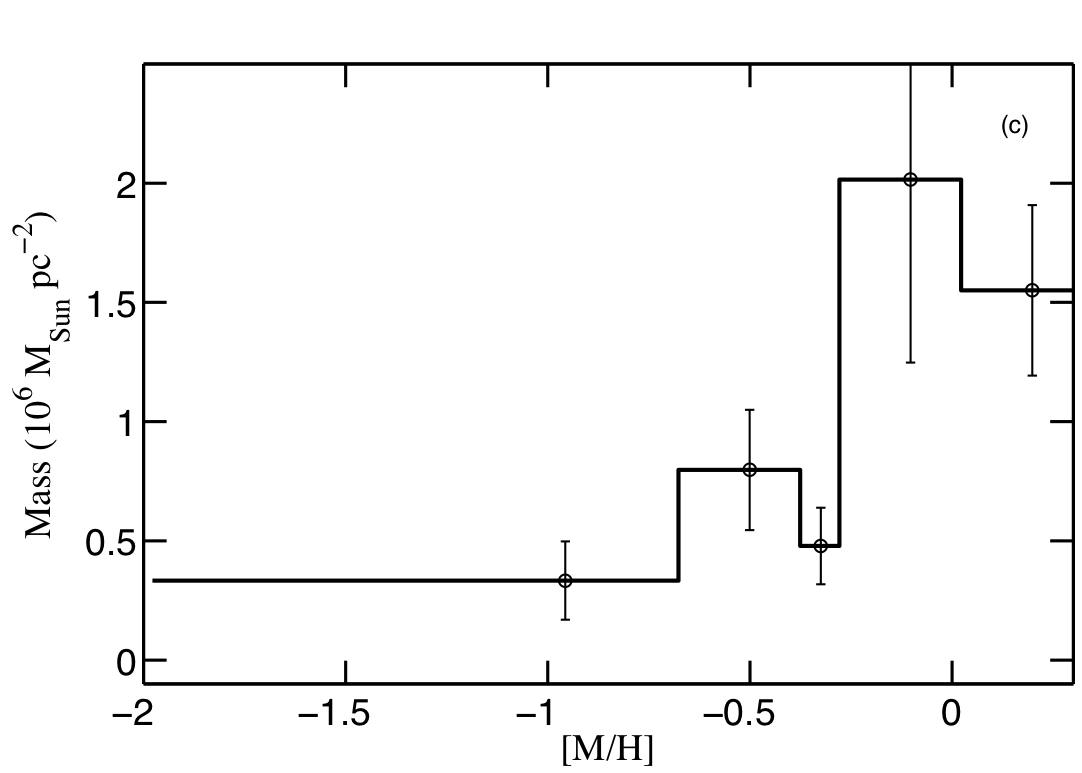
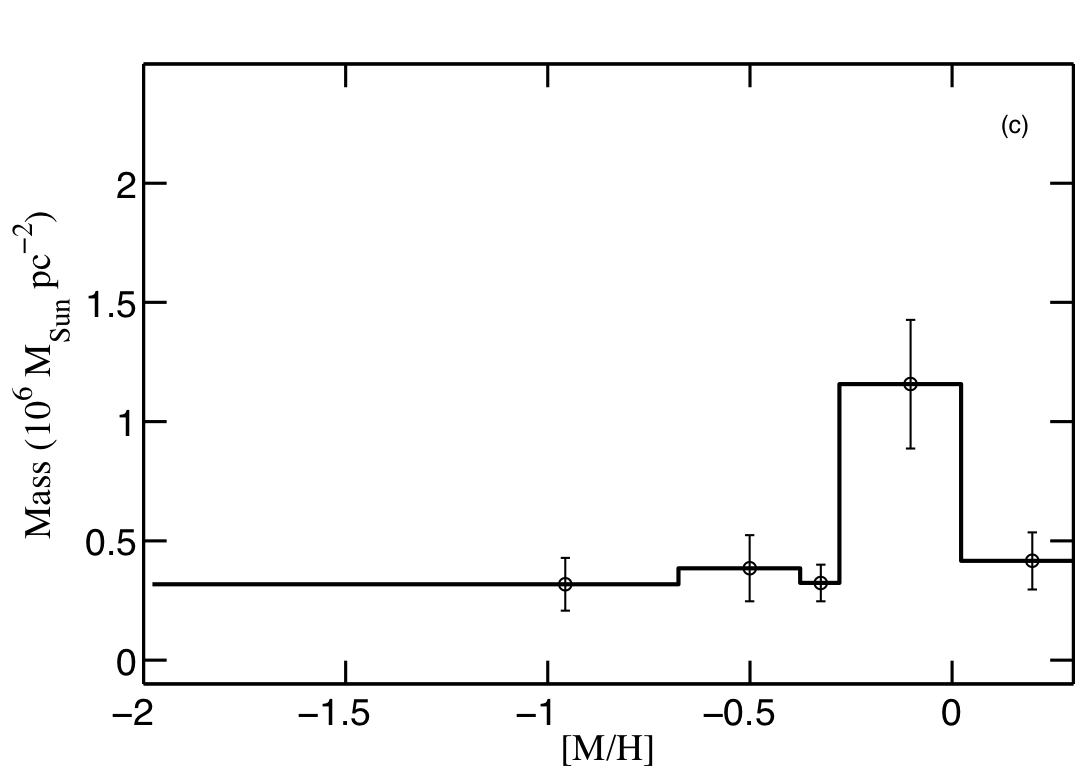
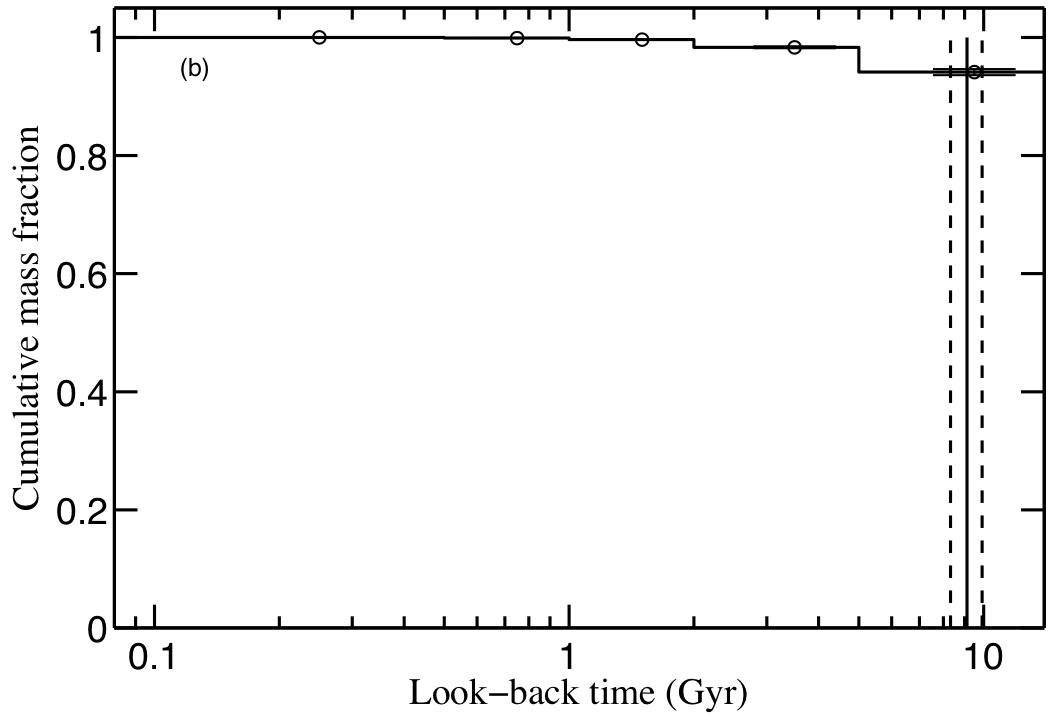
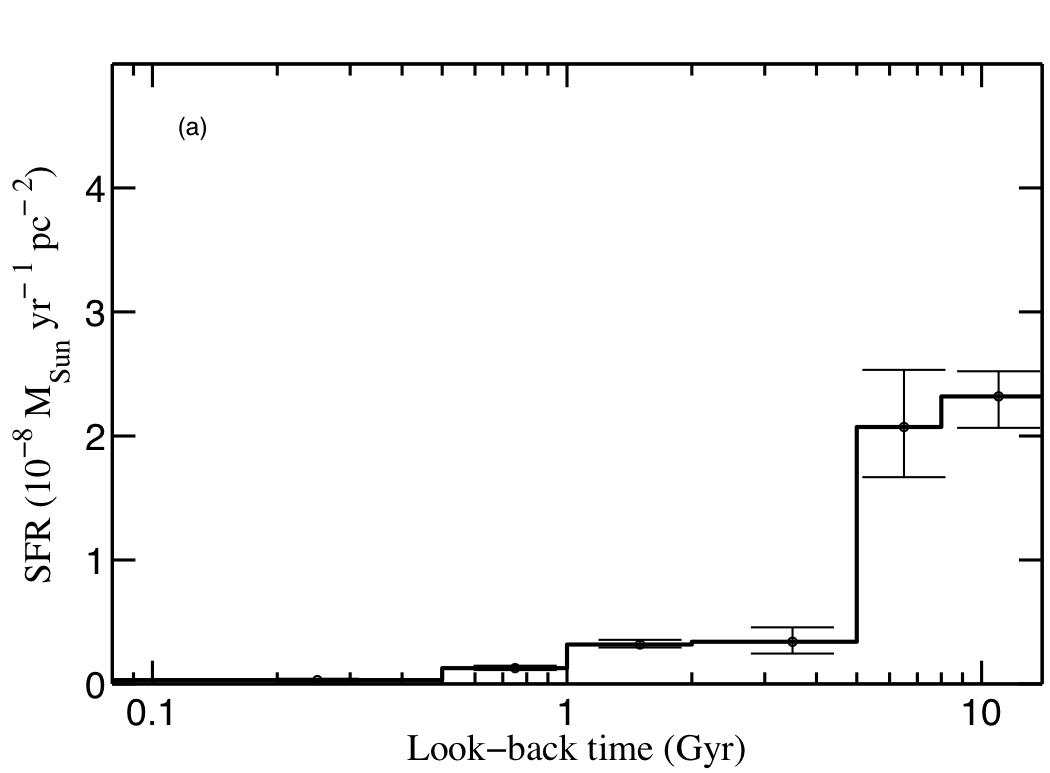
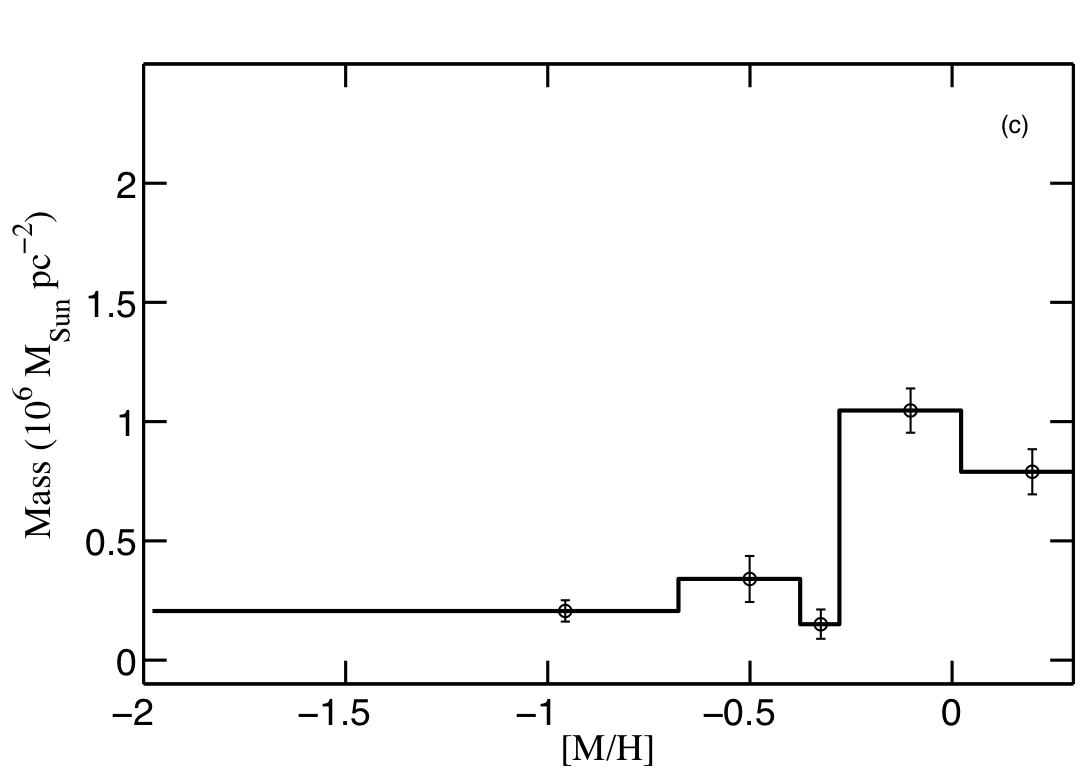
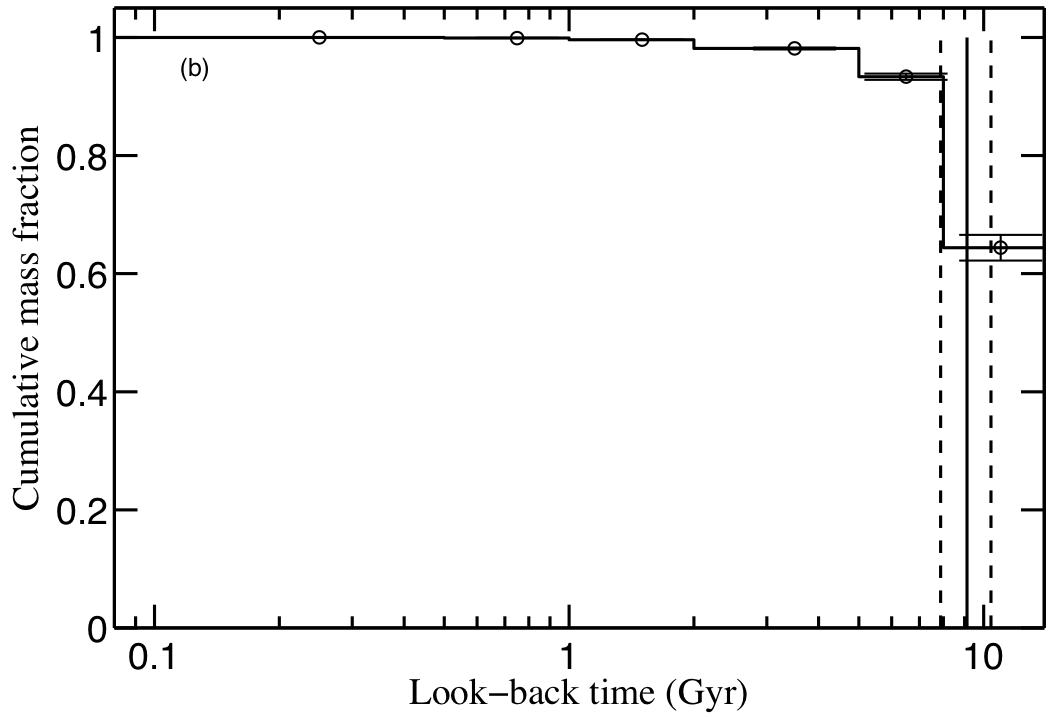
Figure 12 shows the inferred SFH of M32 for the first time calculated from its resolved stellar population. We used the F1 and F2 SFHs shown in Figure 9, inferred using the BaSTI library and a 35% binary fraction. We can see that a major burst of star formation occurred in M32 2–5 Gyr ago, responsible for 40% of M32’s current mass at F1’s location. This can be seen from the cumulative mass function, shown in panel (b) of Figure 13. Stars older than 5 Gyr contribute 55% of the total mass of M32 in this field. From this CMD-fitting analysis, however, due to the limitations imposed by the crowding of our fields, we cannot specify when the star formation started, whether it was constant over the 5–14 Gyr period, or if it peaked at some age. Integrated quantities derived from the calculated M32 SFH are indicated in Table 3. Note that the estimated mean age and metallicity of M32, Gyr and , respectively, are younger and more metal-rich that the mean age and metallicity of F1, because M31’s mean age and metallicity in F2 is older and more metal-poor than M32 in F1.
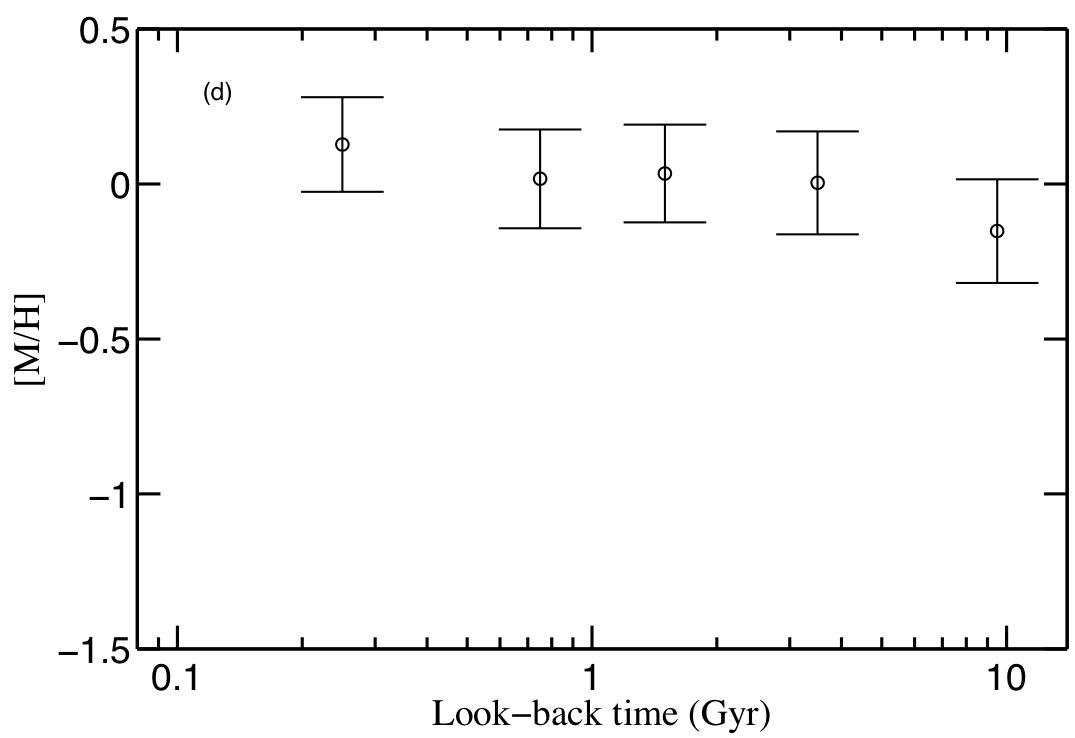
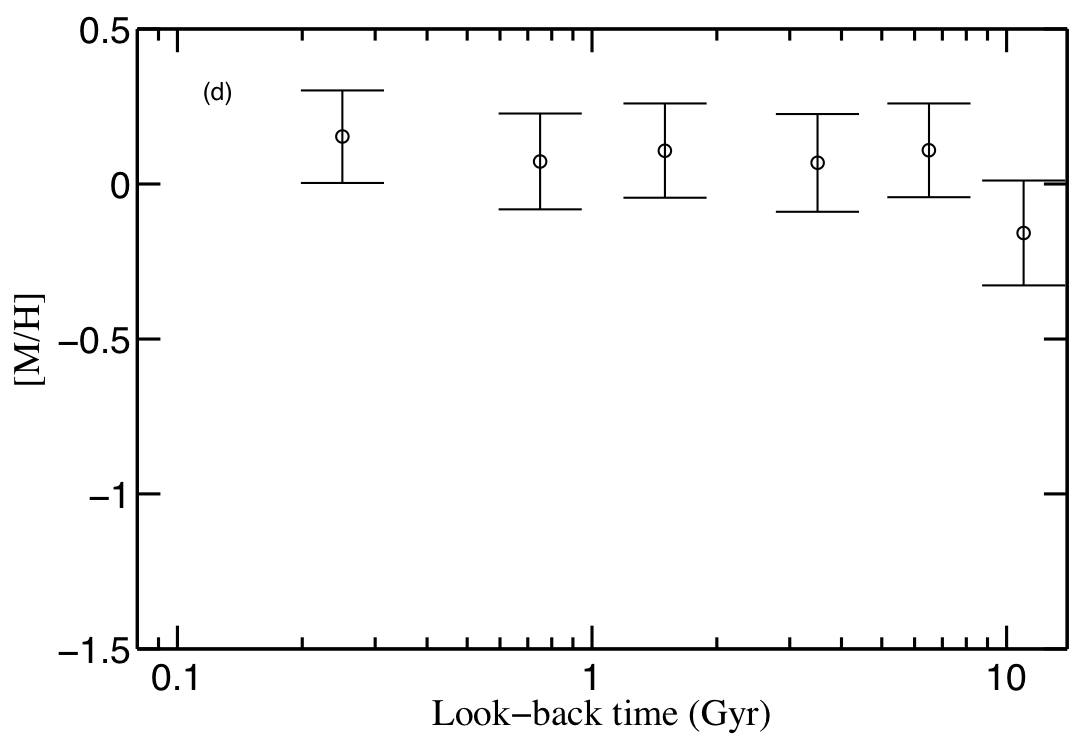
The age–metallicity relation for M32 is nearly constant (Fig. 13d) although there is apparently a mild increase at 5 Gyr followed by a small decrease at 2 Gyr. We note that an almost constant age–metallicity relation appears to suggest that M32 has not experienced any metal enrichment. However, the lack of resolution in age means that we cannot extract detailed information on stars older than 5 Gyr. Most of the chemical evolution of the system has likely occurred during that 5–14 Gyr period. M32’s mass-weighted peak in metallicity is at dex (Fig. 13c).
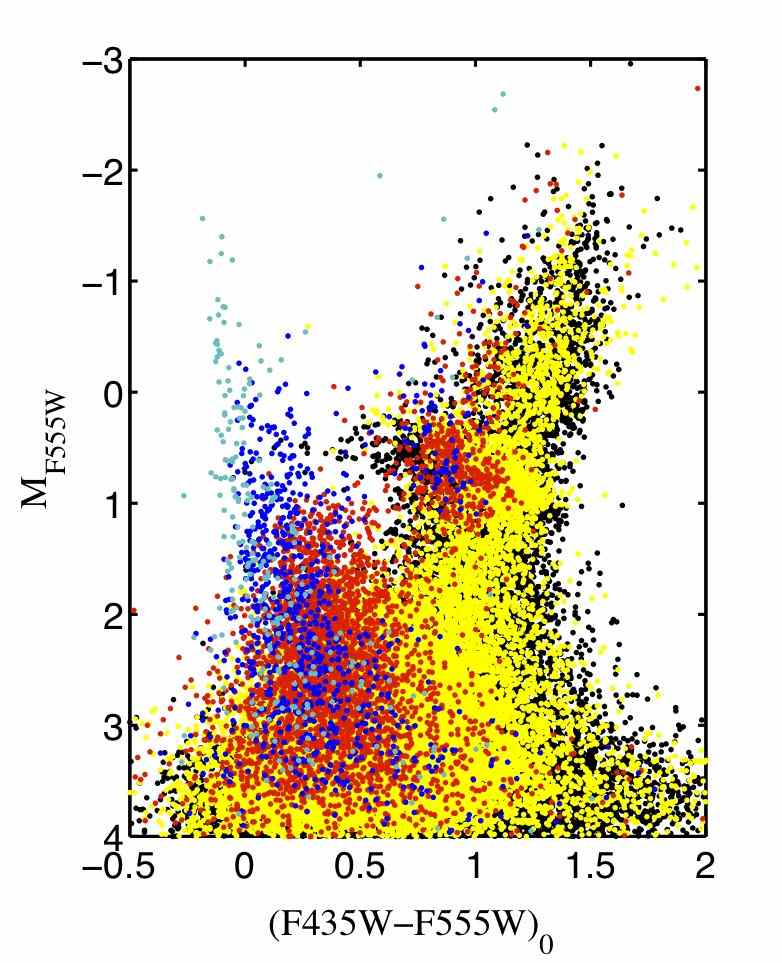
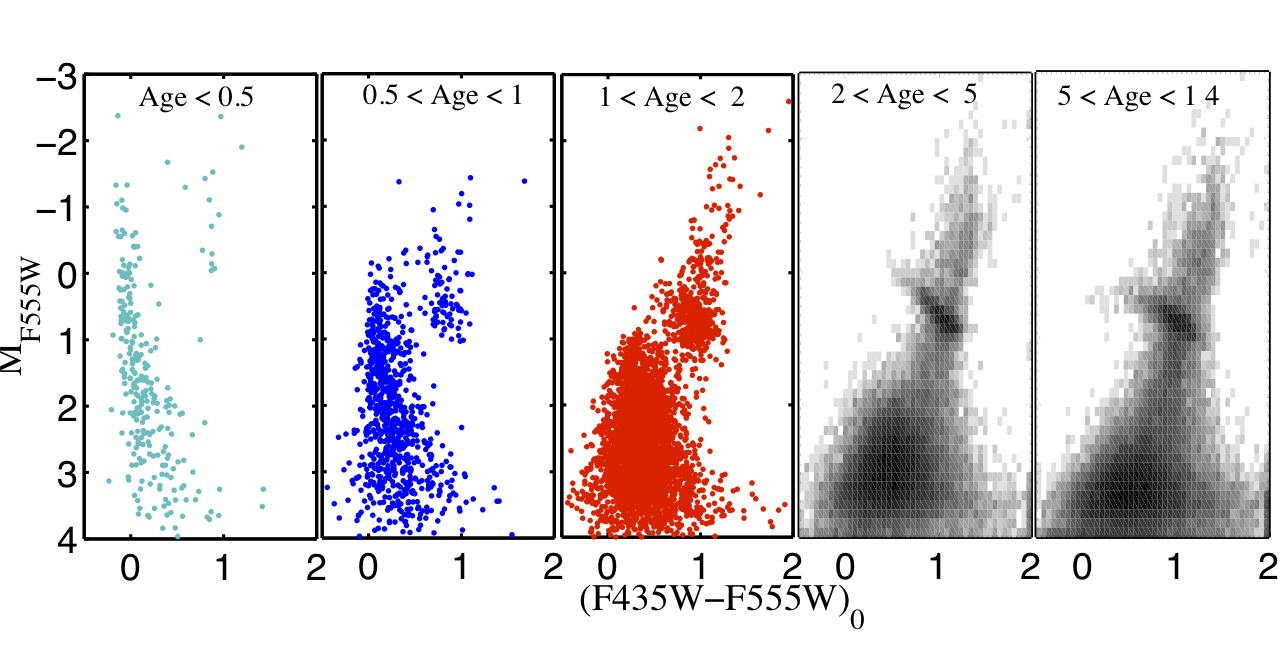
We show in the top panel of Figure 14 the calculated CMD of M32, with its stars color-coded according to age. The CMD was obtained by randomly extracting stars from the model CMD, in such a manner that their star distribution follows the calculated SFH. This figure provides explicit information on the age interval that populates each region of the CMD as well as showing how the various ages combine. We see, for example, that stars of different ages contribute to the RC. Younger stars populate the brighter bluer portion of the RC while older stars populate the fainter, redder portion of the RC. The BP is only populated by stars younger than 2 Gyr. The bottom panel shows the CMDs produced by each age interval considered in the extraction of the SFH. We can appreciate in detail the differences between each CMD as the ages vary, from only an extended main sequence (bottom left panel, ages Gyr) to a CMD with well-populated RGB, RC and AGB evolutionary phases (bottom right panel, ages of 5–14 Gyr). Note the presence of only few BHB stars in the bottom right panel, as expected for systems as metal-rich as M32; in the composite CMD (top panel), these few BHB stars are mixed with young, blue stars in the extended MS.
Finally, we can qualitatively compare these results with the SFHs derived for some of the Local Group dwarf satellites, which have been analyzed by the same or very similar methods444A more extensive and quantitative comparison of our results with other the SFHs of Local Group satellites is beyond the scope of this paper.. It is interesting to note that the mean age derived for M32 is comparable to that of dwarf irregular galaxies, such as the Small and Large Magellanic Clouds and Pegasus (Noël et al., 2009; Harris & Zaritsky, 2009; Dolphin et al., 2005), whereas it is quite young compared with the mean ages of dwarf spheroidal galaxies, such as Cetus, Tucana, and Ursa Minor (Monelli et al., 2010a, b; Dolphin et al., 2005). We also note that a synthetic CMD analysis was performed on archival WFPC2 data of M32 by Dolphin et al. (2005). Their results suggest an older mean mass-weighted age for M32, Gyr. However, the WFPC2 data not only are shallower than our data but also contain significant contamination by M31 stars, which were not taken into account in their SFH analysis.
4.2.1 Exploring the SFH solution and its robustness
We now address the robustness and uniqueness of the SFHs derived here. First, due to the complex parameter space and thus multiple local minima involved in the process to find a SFH, an algorithm that guarantees finding the global minimum is strongly desirable. As mentioned above, we have used a genetic algorithm to find the minimum (see Charbonneau 1995). This type of algorithm, unlike the so-called ’downhill’ algorithms, is designed such that the solution found is infinitesimally close to or at the global minimum independently of the initial seed that started the process, provided that a sufficiently large number of generations (i.e. variations of individuals and mutations) is performed. Aparicio & Hidalgo (2009) have tested this and found that generations are enough to guarantee that the solution will be at or as close as possible to the global minimum. We have performed generations per solution, which assures us that we have reached convergence.
In addition, the IAC method does not introduce any systematic error to the SFH solution, provided that the age and metallicity bins used to extract the SFH are appropriate to the observed CMD. This has been verified by several tests on mock stellar populations performed at Instituto de Astrofísica de Canarias in which the SFH of mock galaxies of known SFH have been recovered rather accurately (see Aparicio & Hidalgo, 2009; Hidalgo et al., 2009, 2011). In this work, we have also performed several experiments on mock data to find the appropriate age and metallicity resolution at which, according to the observational effects of our observed CMDs, the SFH solutions of mock galaxies are within 1– to the input ones (see Sec. 3.1 above). Thus, each SFH solution obtained is “unique,” by which we mean that combinations of simple populations within the error bars of the SFH will produce CMDs indistinguishable from the best fit CMD. Any other SFH which is combination of simple populations significantly different that those of the final SFH (i.e., not possible within the error bars of our solution) will produce a CMD significantly different than the best-fit CMD and, therefore, than the observed one.
Finally, even though we only show our best solution, we have explored other solutions that give similar good fits. We found that the SFH of the solutions at 1– confidence area (see Fig. 8) are not significantly different than the best one, for both F1 and F2. The mass percentages per age range slightly vary from one solution to the other, but the overall SFH remains the same. Taking these nearby solutions into account, we find that M32 at F1 has of its mass in a 2–5 Gyr old, metal-rich population and of its mass in stars older than 5 Gyr, with slightly subsolar metallicities. The uncertainties represent the 1– error of our best solution and the variations of these percentages when considering solutions of similar good quality fit.
4.2.2 Young population (Ages Gyr) vs. Blue Stragglers
In Paper I, we discussed the possibility that the fainter stars in the BP of M32 could be old BSS rather than a young stellar population with ages Gyr. However, the analysis presented in Paper I did not allow us to confirm or rule out either case. BSS are stars hotter, bluer and brighter than the MSTOs in a CMD, thus generating a blue plume. Given their locations on the CMD, they are burning hydrogen in their cores with masses larger than the turn-off mass, which indicates that some sort of mechanism rejuvenated their inner layers. Although such a mechanism is still a matter of debate, there are currently two theoretical possible scenarios to explain the BSS origin: they are the result of either a collision between stars (e.g., Sigurdsson et al., 1994) or mass-transfer in a binary system (e.g., McCrea, 1964; Carney et al., 2001).
We investigate the nature of these stars from the SFH presented here. Stars younger than 2 Gyr constitute 4% of the total mass of M32 at F1. Figure 12 shows that some of the young stars, produced by a very low SFR event at look-back times Gyr, are rather metal poor () in comparison with the mean metallicity of M32 (). Given the almost constant age–metallicity relation for M32 and the presence of intermediate-age stars (2–5 Gyr old) of solar or even higher metallicity, it is unlikely that M32 contains at the same time younger stars with significantly sub-solar metallicities. The most plausible explanation is that these stars are BSS belonging to an old metal-poor population. BSS are found in open and globular clusters (Ferraro et al., 2004; Mapelli et al., 2004, 2006; Piotto et al., 2004; de Marchi et al., 2006), dwarf spheroidal galaxies (Hurley-Keller et al., 1999; Carrera et al., 2002; Momany et al., 2007; Mapelli et al., 2009; Monelli et al., 2010a), and even in the Milky Way halo field population (Preston & Sneden, 2000). Therefore, it seems natural to consider that they can also be found in an elliptical galaxy. These stars represent of the mass of M32 in F1 and might be the first direct evidence of BSS in this galaxy. An alternative explanation could be that these young and metal-poor stars were generated by an episode of late infall of metal-poor gas. However, if we assume that M32 is interacting with M31, we would not expect M32 to accrete gas, but instead to lose gas to M31 through stripping.
The other % of stars with ages Gyr that we find in the SFH inferred for M32 may indeed represent a young metal-rich population in M32 at F1.
5. The Star formation history of M32
By combining the results in the present work with the analysis in Paper I, we can finally provide a detailed and complete SFH of M32. We conclude that M32 has had an extended SFH and is composed of two main dominant populations at F1: of the mass in a 2–5 Gyr old, metal-rich population and of the mass in stars older than 5 Gyr, with slightly subsolar metallicities. We confirm the existence of the younger ( Gyr) stars through the presence of bright AGB stars observed in Paper I, with the appropriate ages. From the RC, RGB bump and AGB bump analyzed in Paper I, the bulk of the old population is 8–10 Gyr old. We therefore do not expect a significant contribution from stars older than 10 Gyr in M32 at F1. Nevertheless, there is a hint of the presence of a few ancient metal-poor stars present in M32, as revealed by the 2– detection of RR Lyrae belonging to M32 at F1. The remaining % of the mass is roughly equally divided between a young metal-rich population and a young metal-poor population. We associate the latter with blue straggler stars belonging to an old (likely metal-poor) population.
The age–metallicity relation for M32 is nearly constant within our age resolution, although there is a small increase in metallicity at at 5 Gyr followed by a small decrease at ages younger than 2 Gyr. The mass-weighted mean metallicity of M32 is with a peak at . We emphasize here again that an almost constant age–metallicity relation appears to suggest that M32 has not experienced metal enrichment; but as in F1, this is due to the poor age resolution and does not imply the lack of an age–metallicity relation. Stars with metallicities lower than only contribute % of the total mass of M32 at from its center. This is consistent with the photometric metallicity function (MDF) of M32 derived in Paper I, which shows that the majority of the stars has a slightly sub-solar metallicity at . The MDF also indicated that metal-poor stars with contribute very little, at most 6% of the total -light to M32 or 4.5% of the total mass in F1, implying that the enrichment process largely avoided the metal poor stage.
5.1. On the integrated light of M32
The results obtained in this work are a fundamental step for understanding the formation and evolution of other low-luminosity spheroidal systems (elliptical galaxies or bulges). Since integrated light spectra are, in general, the only means available to study the stellar populations of these galaxies, we strongly rely on unresolved stellar population models to learn about their SFHs. These models, which have become very sophisticated in disentangling the non-trivial age and metallicity degeneracy (Worthey, 1994; Bruzual & Charlot, 2003; Thomas et al., 2003; Vazdekis et al., 2010), still suffer from several uncertainties: e.g., it is difficult to distinguish between a young or hot old population since the latter is not necessarily accounted for in the models (e.g. Maraston & Thomas, 2000). Calibration of these models, which requires observations of individual stars in elliptical galaxies, is a key ingredient that needs to be further developed. As briefly mentioned in Section 1, M32 is located at a distance such that both integrated spectroscopy and photometry of its individual stars can be studied in great detail. A comparison of the stellar parameters obtained using resolved stars and integrated luminosity is fundamental to provide a calibration to the unresolved stellar models with an actual elliptical.
Extensive spectroscopic studies of M32 have been performed, mostly in the central regions and out to (e.g., O’Connell, 1980; González, 1993; Worthey, 2004; Rose et al., 2005). All studies agree that the central stellar population has an SSP-equivalent age of 2.5–5 Gyr and roughly solar metallicity, with an age gradient that increases the age at by Gyr and a mild negative metallicity gradient. Various integrated-light studies have suggested that M32 underwent a period of significant star formation in the recent past, i.e., about 5–8 Gyr ago, (e.g., O’Connell, 1980; Pickles, 1985; Bica et al., 1990) based on the presence of enhanced H absorption in the integrated spectrum of M32, a signature of an intermediate-age population (e.g., Rose, 1994; Trager et al., 2000; Worthey, 2004; Schiavon et al., 2004; Rose et al., 2005; Coelho et al., 2009). To date, only Coelho et al. (2009) have attempted to probe the unresolved stellar populations as far from the center of M32 as the ACS/HRC field presented in this paper lies, using longslit observations with GMOS on Gemini. They propose that an ancient and intermediate-age population are both present in M32 and that the contribution from the intermediate-age population is larger at the nuclear region. They claim that a young population is present at all radii, and they further suggest that there is a strong component of either very young ( Gyr) and/or very old ( Gyr), metal-poor stars even in their outermost field.
We can use the inferred SFH of M32 to compute line strength indices using the models of Bruzual & Charlot (2003, hereafter BC03) and to calculate single stellar population (SSP)-equivalent parameters that can then be compared with the values obtained from the integrated light of this galaxy.
Using the BC03 models, we obtain a -band luminosity-weighted mean age and metallicity of 4.9 Gyr and , respectively, for M32 at F1 from its resolved SFH. Coelho et al. (2009) find an average luminosity-weighted age of Gyr using BC03, which agrees with our result within the uncertainties, but their inferred mean metallicity is much lower, (see their Table 3). Moreover, as mentioned above, they suggest that there is a strong component of either very young ( Gyr) or very old ( Gyr), metal-poor stars in their field at a radius similar to our F1 field, which is inconsistent with our data.
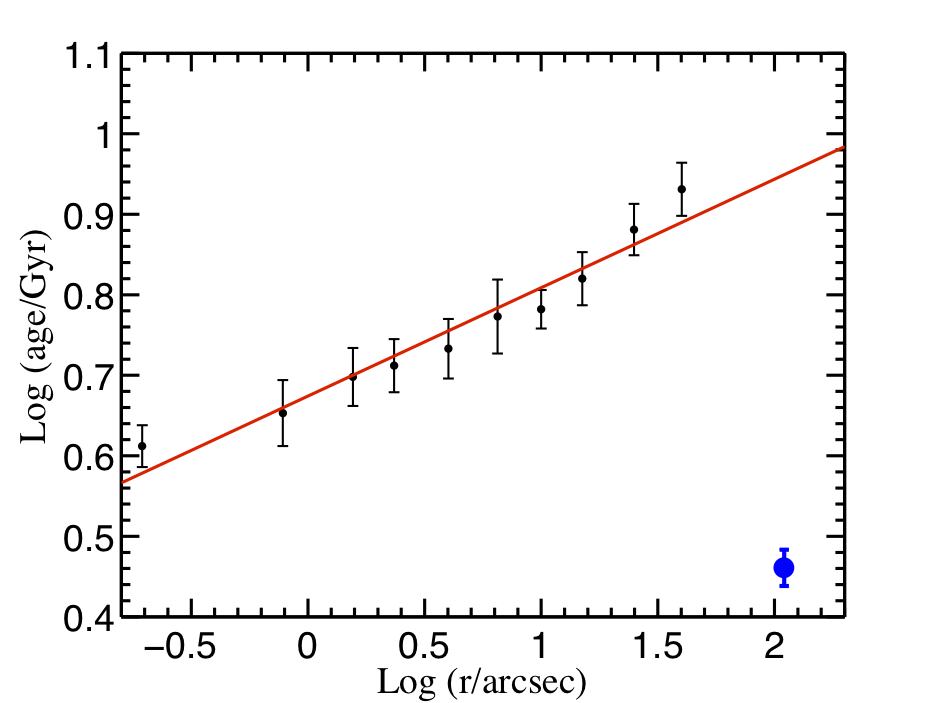
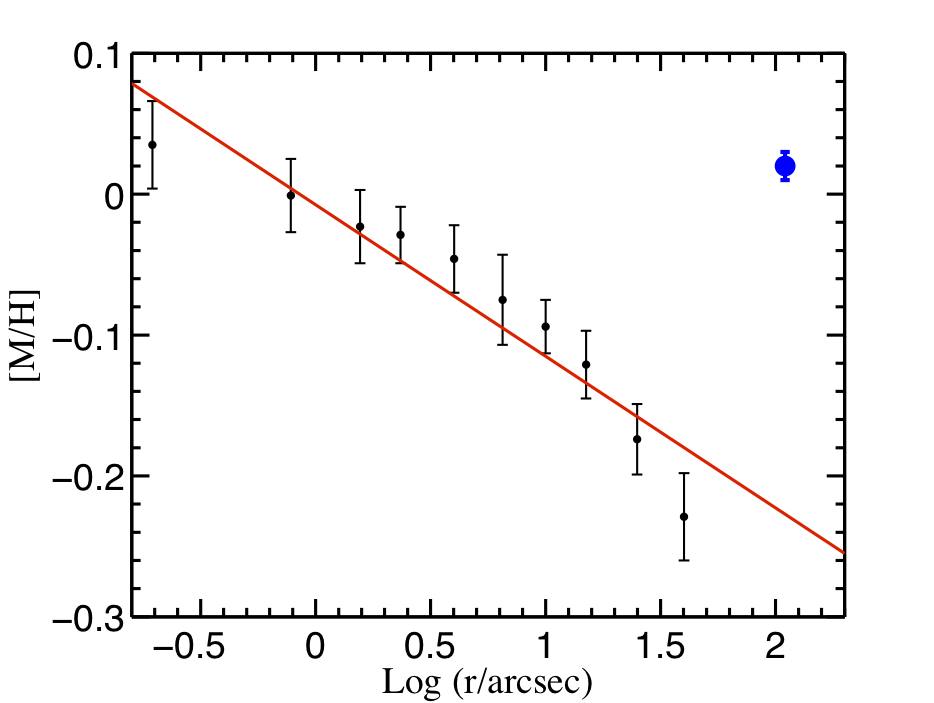
We have also calculated SSP-equivalent parameters that can be compared with the values obtained from integrated spectra of this galaxy. Using the BC03 models, the SSP-equivalent values of M32 obtained from its inferred SFH at F1 are Gyr and , respectively. Given the radial line-strength gradients present in M32 (e.g., Rose et al., 2005), we cannot directly compare these SSP-equivalent values with those obtained from central integrated spectra of M32 (by, e.g., Trager et al., 2000). We therefore do the following. We use the values of the line strength indices from Worthey (2004) and compute the SSP-equivalent parameters from polynomial fits to the absorption-line strengths as a function of radius (his Table 1) using the modified BC03 models described in Trager et al. (2008). We then fit straight-line gradients to the SSP-equivalent parameters as a function of radius and extrapolate these fits to , F1’s position. The SSP-equivalent age and metallicity of M32 at F1 from this extrapolation are Gyr and dex, respectively. We note that Worthey’s values for Mg are low compared with González (1993) and Trager et al. (1998), and thus the SSP-equivalent age we have obtained may be slightly overestimated whereas the SSP-equivalent metallicity may be underestimated. Taken this into account, we obtained an SSP-equivalent age of Gyr and a SSP-equivalent metallicity of dex. Figure 15 shows the SSP-equivalent parameters from Worthey (2004). The linear fits to the and as a function of are also shown. The blue stars indicate the SSP-parameters obtained from the inferred SFH of M32 from BC03 models.
The predicted age and metallicity at F1 from the extrapolation of the absorption-line gradients are much older and more metal-poor, respectively, than those obtained from the inferred SFH of M32. This suggests that either the extrapolation of line strength indices or the stellar population models, or both, may be in error, but we are currently unable to discern which. Color profiles in many colors of M32 are rather flat (Peletier, 1993). Since M32 does not contain dust, integrated colours can be good population indicators and the fact that there are no gradients in colors agree with the results from the inferred SFH. Davidge & Jensen (2007) have also challenged the radial gradients in mean stellar parameters obtained from spectral studies. They find no evidence for a radial age gradient in M32, based on the properties of observed brightest AGB stars, in contrast to the results by Worthey (2004) and Rose et al. (2005), who found (as described above) a significant radial gradient in the mean luminosity-weighted age of M32.
To further investigate this apparent contradiction, integral-field spectroscopic observations with VIRUS-P (Hill et al., 2008) have been taken at F1 and F2 and will be analyzed in a future paper. This will provide spectra of the integrated stellar light of M32 for the fundamental calibration for the study of stellar populations.
5.2. On the formation of M32
Certainly, the most striking result of this work is the substantial contribution of 2–5 Gyr old metal-rich stars to the total mass of M32 at F1. How has an elliptical galaxy like M32 formed such a young population of stars? What is the origin of this population? In this section we attempt to address these questions and discuss, in particular, the most popular proposed formation scenarios for M32.
A formation scenario for M32 has been proposed by Kormendy et al. (2009, hereafter K09), in which M32 is a normal, low-luminosity elliptical galaxy. K09 find that both central and global parameter correlations from recent accurate photometry of galaxies in the Virgo cluster place M32 as a normal, low-luminosity elliptical galaxy in all regards. K09 fit a Sérsic (1968) profile to the SB of M32 with , in agreement with Sérsic indices of other low-luminosity ellipticals studied by K09. They interpret the light at the center of M32 that was not fit by their Sérsic profile as a signature of formation in dissipative mergers (Mihos & Hernquist, 1994). Extra central light is a general feature of coreless galaxies and is observed in all the other low-luminosity ellipticals of K09’s sample. Within this scenario, the metal-rich 2–5 Gyr old stars contributing to of M32’s mass at F1 could be the result of such a dissipative merger event. Thus, the progenitors of M32 should have been very gas-rich spiral galaxies, like M33 for example. However, such progenitors should have stellar masses of the order of , whereas M33’s stellar mass is . There are in fact no gas-rich spiral galaxies near M31 of the appropriate stellar mass.
An alternative scenario for the formation of M32 has been proposed by Bekki et al. (2001, hereafter B01), who assumed that M32 is the result of a low-luminosity spiral galaxy, whose bulge, unlike most of its outer disk, survived its dynamical interactions with M31555The idea that M32, as well as other small high-surface brightness galaxies, is a tidally truncated galaxy has been discussed several decades before B01 models. In, for example, Faber (1973), the original truncated galaxy was a more massive elliptical galaxy, from which only the tightly bound core of the original elliptical remains after a strong tidal interaction.. In their N-body/smoothed particle hydrodynamics simulations, B01 considered a gas-rich low-mass disk galaxy with a bulge orbiting a massive disk galaxy like M31. About 0.75 Gyr after the interactions have started, the outer stellar disk (from 2 kpc to 5 kpc) of the spiral galaxy is stripped away and only keeps % of its initial mass in stars initially located in the central regions, i.e., within 2 kpc of the center. New star formation is triggered by the interaction of the gas-rich spiral with M31 but the outer new stellar component is also tidally stripped away, and consequently only the central starburst component survives. On the other hand, the bulge is only weakly affected by tidal interactions with M31 due to its compactness, and only % of its mass is lost. At the end of their simulations, there is a fractional disk, bulge, and new stars mass ratio of %, %, and %, respectively, within 2 Kpc of the remnant compact galaxy. Our field F1 is located at 110, i.e. kpc from the galactic center at M32’s distance and, assuming either an inside-out or outside-in formation scenario for the disk (see e.g., Sommer-Larsen et al., 2003, and discussion in Section 6) and considering that we are looking at a , where kpc is the scale length radius of B01’s disk, the disk stars that we should be observing there would have mean ages of 8–12 Gyr. Assuming that the bulge is predominantly old, this scenario is difficult to reconcile with our results, given the substantial 2–5 Gyr old intermediate-age population detected in this work. However, there has been some indications of small bulges which could have extended SFHs, similar to that of M32, with 10–30% of their total mass at look-back times between 0.5 and 5 Gyr (Thomas & Davies, 2008).
Therefore it is unclear from our SFH results what the preferred model for the origins of M32 is. While specific origin models differ in detail, the general outlines overlap enough to make choosing a specific model difficult with the age resolution of our current SFH. More observations of M32-analog systems and simulations of spheroidal systems with similar SFHs to that we have presented are needed to shed light on M32’s origins. Furthermore, finding evidence of a stellar stream in the halo of M31 with the ages and metallicities obtained for M32, which should be left if a major stripping of M32 by M31 has occurred, would help to constrain the models and assess the validity of the proposed scenarios.
6. The disk and spheroid population of M31 in F2
In Paper I, we compared our findings in F2, in particular its metallicity distribution function (MDF), with several previous works on the disk and bulge of M31 (e.g. Williams, 2002; Worthey et al., 2005; Olsen et al., 2006; Brown et al., 2006). We found a reasonably good agreement with most studies. In this section we discuss our new, quantitative results on the stellar populations at F2 and their implications for the formation of the M31’s disk. M31 seems to have formed most of its stars between 5–14 Gyr ago at F2. As mentioned above, we cannot precisely indicate when the star formation started in either F1 nor F2 but we can see that M31 is older than M32 in F1.
Brown et al. (2006, hereafter B06) analyzed three CMDs of different regions of M31: the spheroid, stream and outer disk. These CMDs reached well below the oldest MSTOs, and B06 derived SFHs at each field in great detail. Differences between these SFHs were mainly found in the age and metallicity distributions of stars older than 5 Gyr. Within this age range (5–14 Gyr) we do not have the resolution required to inspect different bursts of star formation in F2 in detail, given the SFH extracted in Section 4. We can, nevertheless study the SFH of F2 in more detail than what is presented in Section 4. As we show in Figure 4, the CMD of F2 is mag deeper than the one of F1, which allows us to obtain information of fainter, i.e. older, MSTOs at F2666The previous selection of age and metallicity bins to derive the SFHs was strictly based on the resolution imposed by the CMD of F1. In order to subtract the SFH of F2 from that of F1, we required the simple populations considered be exactly the same.. We therefore extracted again the SFH of F2 following the steps indicated in Section 3, but with an extra bin in the age, from 5 to 8 Gyr, for the simple populations considered. The boundaries of the bins in age are in this case [0, 0.5, 1, 2, 5, 8, 14] years. The inferred best-fit mean SFH of F2 with this new resolution in age was found at with . Figure 16 shows a 3D-histogram representation of the new SFH solution for F2. We can now distinguish two main populations that contribute substantially to our background field F2, instead of only one old population: of the total mass in F2 is composed of a 5–8 Gyr old metal-rich population and of the mass is composed of a 8–14 Gyr old, metal-poor population. An age–metallicity relation shows a slightly steeper slope from an old metal-poorer population to younger metal-richer ones than before, as shown in Figure 17. We are still not able to answer when the star formation started in F2. Nevertheless, our results for the mean age and metallicity for F2, Gyr and dex respectively, are in good agreement with B06 results for their outer disk field, Gyr and dex, respectively777The cited values correspond to the results obtained by B06 when a 40% binary fraction was assumed.. In addition, young stars, with ages between 0.3 and 1 Gyr, that populate the BP in the CMD of F2 do not contribute significantly to the total mass, which is also in agreement with B06’s results. Interestingly, kinematic data in our field imply that both the disk and spheroid of M31 contribute to the populations in F2 (K. Howley, 2010, priv. commm). This was also the case for the outer disk field of B06. B06, however, attempted to disentangle both populations assuming that their spheroid field was representative of the spheroid population present in their outer disk field. By subtracting the spheroid population, they obtained a younger mean age for the outer disk of M31—but still older than 5 Gyr.

Given the resolution allowed by the depth of our data, the inner disk and spheroid populations of M31 (at 5 kpc from its center) seem to be indistinguishable from the outer disk and spheroid ones (at 25 kpc from M31 galactic center, B06). Even though we are unable to subtract the spheroid population that contributes to our field F2, most likely the mean age of M31’s disk at F2 is younger than 8.72 Gyr and older than 5 Gyr, given the negligible contribution of stars younger than 5 Gyr. This result supports the inside-out disk formation models by e.g., Abadi et al. (2003a, b); Sommer-Larsen et al. (2003). Abadi et al. find a mean age of 8–10 at 2 kpc, which radially decreases to 6–8 at 20 kpc. Sommer-Larsen et al. simulated two spiral galaxies, with two different scenarios of disk formation: inside-out and outside-in. Our expected mean age for the disk of M31 at F2 agree with both scenarios within their uncertainties, assuming a stellar disk scale length of kpc (e.g., Walterbos & Kennicutt, 1988; Worthey et al., 2005). They find that, at 1 disk scale length, the mean ages of both simulated disks are 6–8 Gyr. However, the significant fraction of stars younger than 5 Gyr predicted by their outside-in model at F2 is not supported by our data. Thus, we favor their inside-out model. Furthermore, the inside-out formation model of Sommer-Larsen et al. (2003) predicts that the disk has almost no age gradient which, although surprising, is also in agreement with the comparison of our and B06 results at different disk locations. They explain that this prediction is a consequence of the non linear dependence of the SFR on the cold gas density, which makes the SFR rather low in the outer disk at late times, thus the average outer disk stellar age is quite high. An alternative scenario for the absence of an age gradient, found when comparing our results with those of B06, is the radial migration of stars seen in recent simulations of isolated disk formation and evolution (Roškar et al., 2008; Minchev et al., 2011). In these simulations, inside-out disk growth yields a negative age gradient within the break radius (2–3 disk scale length), after which there is a positive age gradient due to the secular redistribution of stars, given their interactions with transient spiral density waves. Of course, we should keep in mind that what we presented here are the results of one field in the inner regions of M31 and we need more observations and statistics to either confirm or rule out what we suggest. The multi-cycle Panchromatic Hubble Andromeda Treasury (PHAT) project, which will cover 1/3 of M31 with HST WFC3 and ACS observations, will resolve the SFH of the disk of M31: our observations and analysis merely hint at what PHAT is likely to find.
7. Summary and Conclusions
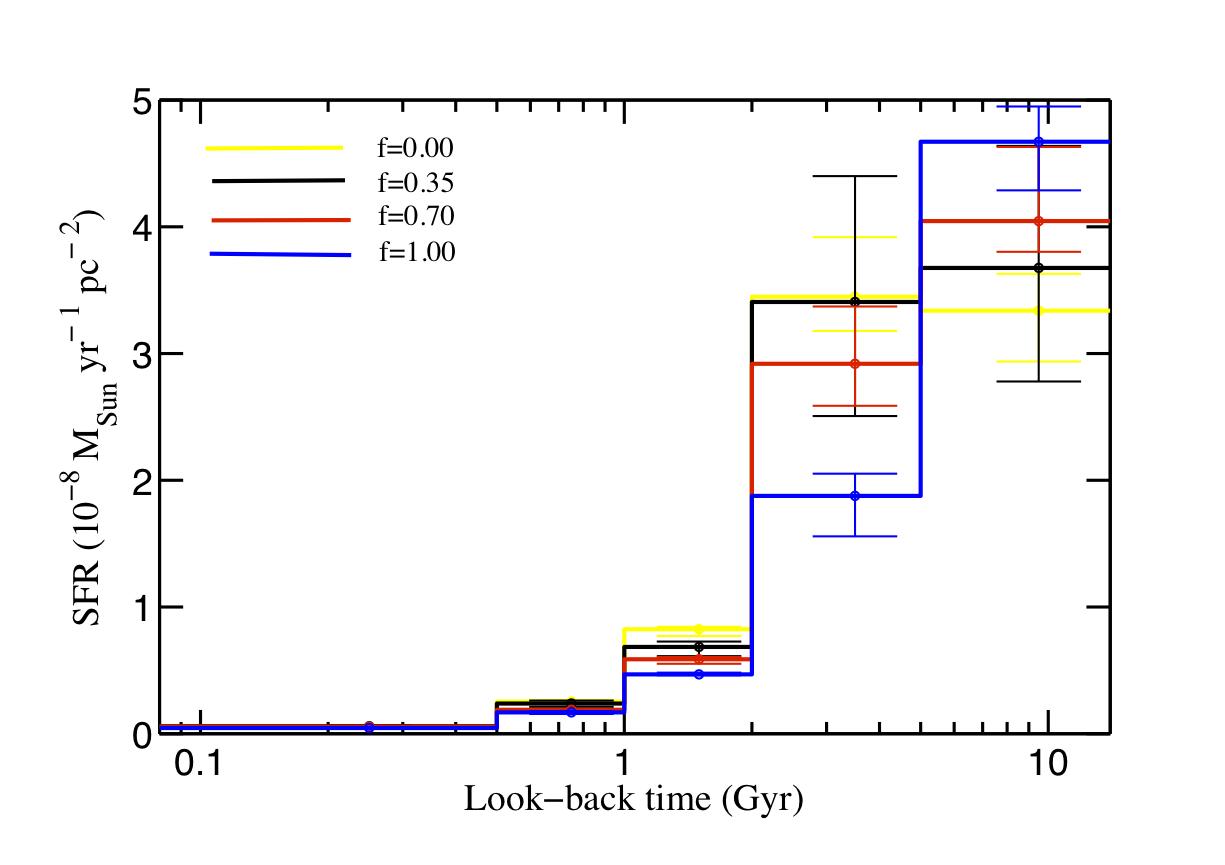
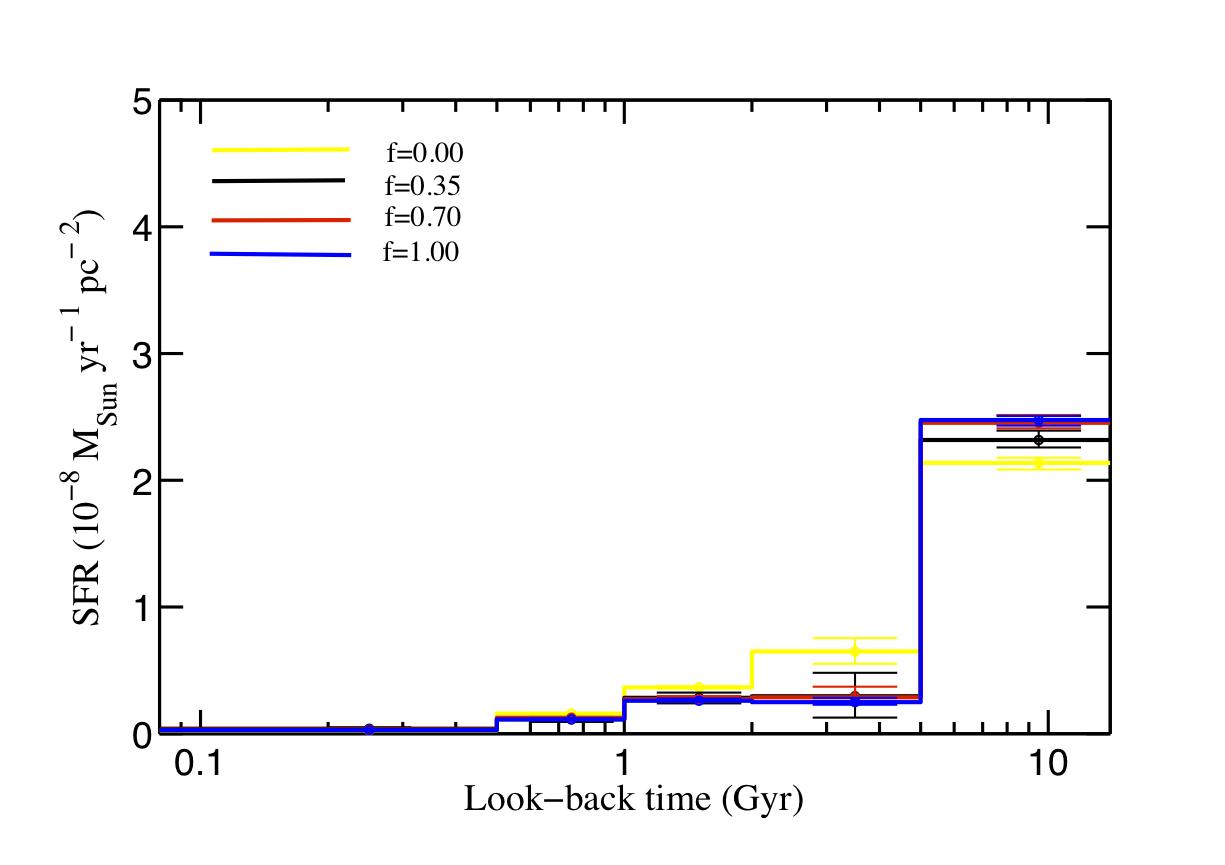
We used deep HST ACS/HRC observations to derive the SFH of M32 for the first time from a detailed modeling of its CMD. The two fields observed, one closer to M32 (F1) and a background M31 field (F2), were introduced and used in Paper I to construct deep CMDs of F1 and F2, and the deepest optical CMD of M32 yet obtained. The IAC-POP/MinnIAC method was used here to compare the distribution of stars in the observed CMDs of F1 and F2 with that of a model CMD. We obtained the SFH of M32 by linearly subtracting the SFHs of F2 from that of F1. The use of different stellar evolutionary libraries (BaSTI and Padova/Girardi) and assumptions of binary fractions (0, 0.35, 0.7, and 1) did not significantly modify the solutions obtained, indicating that our results are robust.
Combining our present results with those of Paper I, we provide an unprecedented census of the stellar content of M32. The derivation of the SFH presented in this paper is independent of the analysis performed in Paper I. In spite of using the same data, the CMD regions that we have probed in this work are largely different from those used in Paper I. Our analysis of these regions have allowed us to obtain detailed information about the young and intermediate-age populations of M32, whereas only the broadest sketch of these populations were possible in Paper I. Conversely, detailed information about the older populations cannot be obtained with our current approach, and therefore we rely on the qualitative results of Paper I for those populations.
The main finding of this work is that M32 is composed of two main dominant populations at F1: of the mass in a 2–5 Gyr old, metal-rich population and of the total mass in stars older than 5 Gyr, with slightly subsolar metallicities. Its mass-weighted mean age and metallicity are and , respectively. Even though we are unable to specify when the star formation started in M32 at F1, we make use of the analysis of Paper I to constrain the older population. We know from the RC, RGb and AGB bumps that the bulk of the old population is 8–10 Gyr old. Thus, we do not expect a significant contribution from stars older than 10 Gyr in M32. There has been, however, a marginal detection of RR Lyrae belonging to M32 at F1, which reveal the presence of a few ancient metal-poor stars in M32 (Fiorentino et al., 2010). The remaining 4% of the mass is distributed in genuine young metal-rich stars (%) and young metal-poor stars (%) which we associate with blue straggler stars belonging to an old metal-poor population. In addition, we used the inferred SFH of M32 to calculate the SSP-equivalent age and metallicity parameters from unresolved stellar population models, which are Gyr and dex, respectively. These values, however, contradict spectroscopic studies, which show a steep age gradient from M32’s center to .
Based on our present results, it is not currently possible to choose a preferred model for M32’s origins between two popular ones: a true low-luminosity elliptical or a former spiral galaxy whose bulge survived its dynamical interaction with M31. Future observations to find M32-analog systems as well as simulations of spheroidal systems with similar SFHs to M32 may shed light on this issue.
On the other hand, the inferred SFH for F2 shows that the stellar populations of the inner regions of the disk and spheroidal components of M31 are older and more metal-poor than M32. Its mass-weighted mean age and metallicity are and , respectively. F2 has two main components: of the mass composed by a 8–14 Gyr old more metal-poor population and of the mass in more metal-rich stars of 5–8 Gyr old. There is a small contribution from stars younger to 5 Gyr to the total mass. The inner disk and spheroidal stellar populations seem to be indistinguishable from those of the outer disk and spheroid. Assuming that M31’s disk at F2 ( 1 disk scale length) has a mean age between 5 and 9 Gyr, our results are in agreement with inside-out disk formation models. But of course, we need more observations and statistics to confirm or rule out this suggestion.
Lastly, while this paper accounts for the SFH history of the bulk of
M32’s mass, it does not offer strong constraints on small “tracer”
populations that may testify to the present level of any very recent
star formation in M32, as well as fossil remnants that may date to
times well before the 10 Gyr mark, after which the bulk of M32 stars
were formed. Digging down to fainter stars in the M32 CMD to detect
any very old ( Gyr) MSTO is not possible with HST, or any
instrument presently under development, given that the M31 background
prevents observation at lower surface brightness levels where the HST
angular resolution would be more effective. Instead, we believe the
best hope of detecting any ancient, metal-poor, remnant from the very
first stages in the M32 progenitor would come from unambiguously
detecting RR Lyrae stars at higher surface brightness levels than were
observed in F1, where the M31 contamination is relatively much weaker.
Our own image simulations show that RR Lyraes can be detected with HST
at substantially smaller radii than the F1 location. Likewise, better
constraints on a Gyr population native to M32 may be provided by
bright, if rare, tracers that can still be recognized at much higher
M32 surface brightnesses than were observed in the present work. As
with RR Lyraes, bright young blue MS stars or AGB stars should be
detectable throughout the body of M32.
References
- Abadi et al. (2003a) Abadi, M. G., Navarro, J. F., Steinmetz, M., & Eke, V. R. 2003a, ApJ, 591, 499
- Abadi et al. (2003b) —. 2003b, ApJ, 597, 21
- Aparicio & Gallart (2004) Aparicio, A., & Gallart, C. 2004, AJ, 128, 1465
- Aparicio et al. (1997) Aparicio, A., Gallart, C., & Bertelli, G. 1997, AJ, 114, 669
- Aparicio & Hidalgo (2009) Aparicio, A., & Hidalgo, S. L. 2009, AJ, 138, 558
- Bekki et al. (2001) Bekki, K., Couch, W. J., Drinkwater, M. J., & Gregg, M. D. 2001, ApJ, 557, L39
- Bertelli et al. (1992) Bertelli, G., Mateo, M., Chiosi, C., & Bressan, A. 1992, ApJ, 388, 400
- Bica et al. (1990) Bica, E., Alloin, D., & Schmidt, A. A. 1990, A&A, 228, 23
- Brown et al. (2006) Brown, T. M., Smith, E., Ferguson, H. C., Rich, R. M., Guhathakurta, P., Renzini, A., Sweigart, A. V., & Kimble, R. A. 2006, ApJ, 652, 323
- Bruzual & Charlot (2003) Bruzual, G., & Charlot, S. 2003, MNRAS, 344, 1000
- Burstein & Heiles (1982) Burstein, D., & Heiles, C. 1982, AJ, 87, 1165
- Carney et al. (2001) Carney, B. W., Latham, D. W., Laird, J. B., Grant, C. E., & Morse, J. A. 2001, in Bulletin of the American Astronomical Society, Vol. 33, American Astronomical Society Meeting Abstracts, 1311–+
- Carrera et al. (2002) Carrera, R., Aparicio, A., Martínez-Delgado, D., & Alonso-García, J. 2002, AJ, 123, 3199
- Charbonneau (1995) Charbonneau, P. 1995, ApJS, 101, 309
- Chilingarian et al. (2009) Chilingarian, I., Cayatte, V., Revaz, Y., Dodonov, S., Durand, D., Durret, F., Micol, A., & Slezak, E. 2009, Science, 326, 1379
- Coelho et al. (2009) Coelho, P., Mendes de Oliveira, C., & Cid Fernandes, R. 2009, MNRAS, 396, 624
- Davidge & Jensen (2007) Davidge, T. J., & Jensen, J. B. 2007, AJ, 133, 576
- de Marchi et al. (2006) de Marchi, F., de Angeli, F., Piotto, G., Carraro, G., & Davies, M. B. 2006, A&A, 459, 489
- Dolphin (2002) Dolphin, A. E. 2002, MNRAS, 332, 91
- Dolphin et al. (2005) Dolphin, A. E., Weisz, D. R., Skillman, E. D., & Holtzman, J. A. 2005, ArXiv Astrophysics e-prints
- Faber (1973) Faber, S. M. 1973, ApJ, 179, 423
- Ferraro et al. (2004) Ferraro, F. R., Beccari, G., Rood, R. T., Bellazzini, M., Sills, A., & Sabbi, E. 2004, ApJ, 603, 127
- Fiorentino et al. (2010) Fiorentino, G., et al. 2010, ApJ, 708, 817
- Gallart et al. (2005) Gallart, C., Zoccali, M., & Aparicio, A. 2005, ARA&A, 43, 387
- Girardi et al. (2000) Girardi, L., Bressan, A., Bertelli, G., & Chiosi, C. 2000, A&AS, 141, 371
- González (1993) González, J. J. 1993, PhD thesis, Thesis (PH.D.)–UNIVERSITY OF CALIFORNIA, SANTA CRUZ, 1993.Source: Dissertation Abstracts International, Volume: 54-05, Section: B, page: 2551.
- Harris & Zaritsky (2001) Harris, J., & Zaritsky, D. 2001, ApJS, 136, 25
- Harris & Zaritsky (2009) —. 2009, AJ, 138, 1243
- Hidalgo et al. (2009) Hidalgo, S. L., Aparicio, A., Martínez-Delgado, D., & Gallart, C. 2009, ApJ, 705, 704
- Hidalgo et al. (2011) Hidalgo, S. L., et al. 2011, ApJ, 730, 14
- Hill et al. (2008) Hill, G. J., et al. 2008, in Presented at the Society of Photo-Optical Instrumentation Engineers (SPIE) Conference, Vol. 7014, Society of Photo-Optical Instrumentation Engineers (SPIE) Conference Series
- Hurley-Keller et al. (1999) Hurley-Keller, D., Mateo, M., & Grebel, E. K. 1999, ApJ, 523, L25
- Kormendy et al. (2009) Kormendy, J., Fisher, D. B., Cornell, M. E., & Bender, R. 2009, ApJS, 182, 216
- Kroupa (2002) Kroupa, P. 2002, Science, 295, 82
- Lauer (1999) Lauer, T. R. 1999, PASP, 111, 227
- Lucy (1974) Lucy, L. B. 1974, AJ, 79, 745
- Mapelli et al. (2009) Mapelli, M., Ripamonti, E., Battaglia, G., Tolstoy, E., Irwin, M. J., Moore, B., & Sigurdsson, S. 2009, MNRAS, 396, 1771
- Mapelli et al. (2004) Mapelli, M., Sigurdsson, S., Colpi, M., Ferraro, F. R., Possenti, A., Rood, R. T., Sills, A., & Beccari, G. 2004, ApJ, 605, L29
- Mapelli et al. (2006) Mapelli, M., Sigurdsson, S., Ferraro, F. R., Colpi, M., Possenti, A., & Lanzoni, B. 2006, MNRAS, 373, 361
- Maraston & Thomas (2000) Maraston, C., & Thomas, D. 2000, ApJ, 541, 126
- Marigo et al. (2008) Marigo, P., Girardi, L., Bressan, A., Groenewegen, M. A. T., Silva, L., & Granato, G. L. 2008, A&A, 482, 883
- McCrea (1964) McCrea, W. H. 1964, MNRAS, 128, 147
- Mighell (1999) Mighell, K. J. 1999, ApJ, 518, 380
- Mihos & Hernquist (1994) Mihos, J. C., & Hernquist, L. 1994, ApJ, 437, L47
- Minchev et al. (2011) Minchev, I., Famaey, B., Combes, F., Di Matteo, P., Mouhcine, M., & Wozniak, H. 2011, A&A, 527, A147+
- Momany et al. (2007) Momany, Y., Held, E. V., Saviane, I., Zaggia, S., Rizzi, L., & Gullieuszik, M. 2007, A&A, 468, 973
- Monachesi et al. (2011) Monachesi, A., Trager, S. C., Lauer, T. R., Freedman, W., Dressler, A., Grillmair, C., & Mighell, K. J. 2011, ApJ, 727, 55 (Paper I)
- Monelli et al. (2010a) Monelli, M., et al. 2010a, ApJ, 720, 1225
- Monelli et al. (2010b) —. 2010b, ApJ, 722, 1864
- Nieto & Prugniel (1987) Nieto, J., & Prugniel, P. 1987, A&A, 186, 30
- Noël et al. (2009) Noël, N. E. D., Aparicio, A., Gallart, C., Hidalgo, S. L., Costa, E., & Méndez, R. A. 2009, ApJ, 705, 1260
- O’Connell (1980) O’Connell, R. W. 1980, ApJ, 236, 430
- Olsen et al. (2006) Olsen, K. A. G., Blum, R. D., Stephens, A. W., Davidge, T. J., Massey, P., Strom, S. E., & Rigaut, F. 2006, AJ, 132, 271
- Origlia & Leitherer (2000) Origlia, L., & Leitherer, C. 2000, AJ, 119, 2018
- Peletier (1993) Peletier, R. F. 1993, A&A, 271, 51
- Pickles (1985) Pickles, A. J. 1985, ApJ, 296, 340
- Pietrinferni et al. (2004) Pietrinferni, A., Cassisi, S., Salaris, M., & Castelli, F. 2004, ApJ, 612, 168
- Piotto et al. (2004) Piotto, G., et al. 2004, ApJ, 604, L109
- Preston & Sneden (2000) Preston, G. W., & Sneden, C. 2000, AJ, 120, 1014
- Richardson (1972) Richardson, W. H. 1972, Journal of the Optical Society of America (1917-1983), 62, 55
- Rose (1994) Rose, J. A. 1994, AJ, 107, 206
- Rose et al. (2005) Rose, J. A., Arimoto, N., Caldwell, N., Schiavon, R. P., Vazdekis, A., & Yamada, Y. 2005, AJ, 129, 712
- Roškar et al. (2008) Roškar, R., Debattista, V. P., Stinson, G. S., Quinn, T. R., Kaufmann, T., & Wadsley, J. 2008, ApJ, 675, L65
- Schiavon et al. (2004) Schiavon, R. P., Caldwell, N., & Rose, J. A. 2004, AJ, 127, 1513
- Sérsic (1968) Sérsic, J. L. 1968, Atlas de galaxias australes, ed. Sersic, J. L.
- Sigurdsson et al. (1994) Sigurdsson, S., Davies, M. B., & Bolte, M. 1994, ApJ, 431, L115
- Sommer-Larsen et al. (2003) Sommer-Larsen, J., Götz, M., & Portinari, L. 2003, ApJ, 596, 47
- Thomas & Davies (2008) Thomas, D., & Davies, R. L. 2008, in IAU Symposium, Vol. 245, IAU Symposium, ed. M. Bureau, E. Athanassoula, & B. Barbuy, 289–292
- Thomas et al. (2003) Thomas, D., Maraston, C., & Bender, R. 2003, MNRAS, 339, 897
- Tolstoy & Saha (1996) Tolstoy, E., & Saha, A. 1996, ApJ, 462, 672
- Tosi et al. (1991) Tosi, M., Greggio, L., Marconi, G., & Focardi, P. 1991, AJ, 102, 951
- Trager et al. (2008) Trager, S. C., Faber, S. M., & Dressler, A. 2008, MNRAS, 386, 715
- Trager et al. (2000) Trager, S. C., Faber, S. M., Worthey, G., & González, J. J. 2000, AJ, 119, 1645
- Trager et al. (1998) Trager, S. C., Worthey, G., Faber, S. M., Burstein, D., & Gonzalez, J. J. 1998, ApJS, 116, 1
- Vazdekis et al. (2010) Vazdekis, A., et al. 2010, MNRAS, 404, 1639
- Walterbos & Kennicutt (1988) Walterbos, R. A. M., & Kennicutt, Jr., R. C. 1988, A&A, 198, 61
- Williams (2002) Williams, B. F. 2002, MNRAS, 331, 293
- Worthey (1994) Worthey, G. 1994, ApJS, 95, 107
- Worthey (2004) —. 2004, AJ, 128, 2826
- Worthey et al. (2005) Worthey, G., España, A., MacArthur, L. A., & Courteau, S. 2005, ApJ, 631, 820
Appendix A Effect of binaries
The results presented in this work were obtained assuming a 35% binary fraction in the synthetic CMD. To investigate how much this assumption might affect our solution, we have repeated the entire process of deriving the best mean SFH of F1 and F2 assuming not only 35% but also 0%, 70% and 100% binary fractions in the synthetic CMD. The mass ratios between the components of the binaries were set to be uniformly distributed between 0.5 and 1.
| Field | Binary % | (, )aaColor and magnitude shifts of the observed CMD at which the value is reached. | |
|---|---|---|---|
| BaSTI | |||
| F1 | 0 | 2.04 | |
| 35 | 2.03 | ||
| 70 | 2.02 | ||
| 100 | 1.98 | ||
| F2 | 0 | 2.28 | |
| 35 | 2.23 | ||
| 70 | 2.28 | ||
| 100 | 2.26 | ||
| Padova/Girardi | |||
| F1 | 0 | 4.07 | |
| 35 | 3.07 | ||
| 70 | 3.49 | ||
| 100 | 3.35 | ||
| F2 | 0 | 2.62 | |
| 35 | 2.82 | ||
| 70 | 2.58 | ||
| 100 | 2.53 | ||
Table 4 shows the values of the reached for F1 and F2 as a function of the assumed binary fraction, and using the BaSTI and Padova/Girardi stellar libraries. We can see that for F1 the goodness of fit does not significantly improve when varying the binary fraction if we use the stellar library BaSTI. However, Girardi/Padova models finds the best fit to the observed CMD in F1 when the fraction of binaries is 35%. We therefore choose this fraction as our baseline model. For F2, the as a function of binary fraction is nearly constant, regardless the stellar library used. Note that BaSTI library always recovers a better fit, i.e. lower than Girardi/Padova ones for both F1 and F2 observed CMDs. The position in the (, ) grid at which is reached for F1 is nearly insensitive to changes in the model binary fraction. This is not the case for F2, which reflects the fact that its CMD is deeper than that of F1.
Figure 18 shows the comparison of the derived SFHs. The SFR as a function of time for F1 (left panel) and F2 (right panel) indicates that the calculated solution does not change significantly but becomes older as the number of binaries increases in the model CMD. This is expected: the larger the number of binaries in a system, the more luminous the effective (that is, observed) MS and the brighter and redder the effective MSTO of its CMD.
