The environment of Weak Emission-Line Quasars
Abstract
The nature of weak emission-line quasars (WLQs) is probed by comparing the Baldwin effect (BEff) in WLQs and normal quasars (QSOs). We selected 81 high-redshift (z 2.2) and 2 intermediate-redshift (z = 1.66 and 1.89) WLQs. Their rest-frame equivalent widths (EWs) of the C IV emission-line and their Eddington ratio were obtained from the Sloan Digital Sky Survey Data Release 7 (SDSS DR7) Quasar Catalogue or from Diamond-Stanic et al.. We compare the parameters of WLQs with these of 81 normal quasars from Bright Quasar Survey (BQS) and 155 radio-quiet and radio-intermediate quasars detected by SDSS and Chandra. The influence of the Eddington ratio, , and the X-ray to optical luminosity ratio, , on the BEff is analysed. We find that WLQs follow a different relationship on the EW(C IV)- plane than normal quasars. This relationship disagrees with the super-Eddington hypothesis. The weakness/absence of emission-lines in WLQs does not seem to be caused by their extremely soft ionizing continuum but by low covering factor () of their broad line region (BLR). Comparing emission-line intensities indicates that the ratios of high-ionization line and low-ionization line regions (i.e. ) are lower in WLQs than in normal QSOs. The covering factor of the regions producing C IV and Ly emission-lines are similar in both WLQs and QSOs.
keywords:
Galaxies: active – quasars: emission lines – Ultraviolet: galaxies – X-rays: galaxies.1 Introduction
A negative correlation between the broad emission-line equivalent width (EW) and the luminosity in active galactic nuclei (AGNs) was discovered by Baldwin (1977) for the C IV line. Similar correlations (the Baldwin effect, hereafter BEff) are also observed for other lines such as Ly1216, Si IV+O IV 1400, He II 1640,4686, C III] 1909, Mg II 2800, Fe lines in the UV and optical bands, and the Balmer lines produced in the broad line region (BLR) (see e.g. Kinney, Rivolo & Koratkar, 1990; Zamorani et al., 1992; Green, Forster & Kuraszkiewicz, 2001; Kuraszkiewicz et al., 2002; Shang et al., 2003). This effect was also observed in single objects (e.g. NGC 5548, NGC4151), when the intrinsic ionizing continuum is varying (Kinney, Rivolo & Koratkar, 1990; Pogge & Peterson, 1992; Gilbert & Peterson, 2003; Kong et al., 2006). At least some of the emission-lines produced in the narrow line region display a BEff as well (e.g. Boroson & Green, 1992; Dietrich et al., 2002; Keremedjiev, Hao & Charmandaris, 2009). Furthermore, an X-ray BEff in the iron K lines was detected by Iwasawa & Taniguchi (1993) and analysed by e.g. Jiang, Wang & Wang (2006); Bianchi et al. (2007).
Several physical explanations have been proposed to explain the BEff. The most supported hypothesis is that the more luminous objects have softer UV/X-ray spectra reducing ionization and photoelectric heating in the BLR gas. Ipso facto the equivalent widths (EWs) of emission-lines are reduced at higher luminosity with the strongest effect for high-ionization lines (HILs) (see Korista, Baldwin & Ferland 1998 and Shields 2007 for a review of the BEff). Fundamental parameters such as the Eddington ratio (Baskin & Laor, 2004; Warner, Hamann & Dietrich, 2004; Bachev et al., 2004; Zhou & Wang, 2005; Xu et al., 2008; Dong et al., 2009), the black hole mass (Netzer, Laor & Gondhalekar, 1992; Shields, 2007), or metalicity (Warner, Hamann & Dietrich, 2004) have also been suggested as the driver of the BEff.
The discovery of weak emission-line quasars (WLQs) i.e. sources with abnormally low broad emission-lines (e.g. EW(Ly) Å, Diamond-Stanic et al., 2009) provides new constraints on the driving mechanism of the BEff. The first WLQ object – PG 1407+265 (with redshift z ) was discovered by McDowell et al. (1995). However, up to 2009 only about 20 WLQs were known. They mostly lie at high-redshifts (), like SDSS J153259.96-003944.1 (Fan et al., 1999, the first high-z WLQ, with ) and were found in the Sloan Digital Sky Survey (SDSS) (Anderson et al., 2001; Schneider et al., 2003, 2005; Collinge et al., 2005; Fan et al., 2006; Schneider et al., 2007; Shemmer et al., 2009). Diamond-Stanic et al. (2009) recently discovered 65 new high-z WLQs, which may suggest that there is a deficit of weak line quasars below z . However, Plotkin et al. (2010a, b) pointed out that more intermediate- and low-redshift WLQ may also exist.
There is no generally accepted explanations for the weakness or even absence of emission-lines in WLQ. Several hypothesis were suggested by McDowell et al. (1995). Relativistic beaming in WLQ is not favoured as weak line quasars, in contrast to BL Lacs, are radio-quiet objects111The radio-loudness parameter R is defined as the ratio of the rest-frame 6 cm to 2500 Å flux densities (see Jiang et al., 2007; Shen et al., 2011). Among 70 radio detected WLQs analysed by Diamond-Stanic et al. (2009) there is 81% of sources with and only 7% of radio-loud WLQs i.e. with ., show no variability or strong polarization. Moreover, the radio spectral slopes, connecting 6 cm with 20 cm, are significantly steeper in radio-detected WLQs than the typical slopes for BL Lac, (Shemmer et al., 2006, 2009; Diamond-Stanic et al., 2009; Plotkin et al., 2010a). The idea, that WLQs could be broad absorption line (BAL) quasars also meet difficulties. Generally, they do not show broad absorption features and are clasiffied as non-BAL objects (Diamond-Stanic et al., 2009; Shen et al., 2011).
Two leading hypothesis to explain the weakness of emission-lines in WLQ have been suggested:
(1) The first one is related to the BEff. Weak emission-lines may be a consequence of a very soft ionizing continuum and of a relative deficiency of high-energy UV/X-ray photons 222“the very soft ionizing continuum” means that a continuum in the far-UV (FUV) band is characterized by a steep spectrum. We use the X-ray to optical luminosity ratio, (see definition below). For typical quasar is equal to (Laor et al., 1997) and for the most luminous quasars with redshift 1.5-4.5 the mean equals to -1.80 (Just et al., 2007). We adopt as a definition of a very soft spectrum.. Leighly et al. (2007a), based on observation of PHL 1811, have claimed that its very soft spectral energy distribution (SED) (the photon index ) 333 (e.g. Avni & Tananbaum, 1982; Strateva et al., 2005; Gibson, Brandt & Schneider, 2008). is related to its super-Eddington nature (the estimated lie in the range 0.9-1.6). However, it is worth noting that, the observed UV/optical part of the continuum in WLQs looks like these of normal quasars. Richards et al. (2003) have analysed the spectra of 4576 SDSS quasars and they found that the spectral indices, (where ), lie in a wide range, with mean values from to (see their composites no. 1-4). The spectral indices in WLQs also span the same interval with a median values of (Diamond-Stanic et al., 2009; Plotkin et al., 2010a). Those values means that, generally, the observed UV SED in WLQ is not particularly soft. However, these objects may still emit more vigorously in the unobserved far-UV band. Recently Wu et al. (2011) found a small population of X-ray weak quasars, suggesting that these PHL 1811 analogs possess the shielding gas with large covering factor. This gas absorbs almost all soft X-ray continuum to prevent illumination of broad line region (BLR) by this radiation. As a result weak emission-lines are produced although a face-on observer see the normal X-ray continuum.
(2) The second hypothesis suggests that WLQs are normal quasars with typical metallicities, ionizing continua, and ionization parameters, however, with an underdeveloped BLR perhaps because of a freshly launched accretion disc wind (Hryniewicz et al., 2010). The weakness/absence of emission-lines in this case is caused by a low BLR covering factor or a deficit of line-emitting gas in the BLR (Shemmer et al., 2010).
In this paper we analyse both hypothesis: softness of ionizing continuum and underdevelopment of BLR. In section 2 we describe the sample of quasars that was used. Section 3 is devoted to the comparison of the observed properties of WLQ and QSO that we discuss in section 4. The conclusions are presented in section 5. We assume that km s-1 Mpc-1, , and .
2 The WLQ sample
The sample of WLQs consists of 81 high-redshift (z ) and high-bolometric luminosity sources classified by Anderson et al. (2001); Collinge et al. (2005); Schneider et al. (2007); Shemmer et al. (2009); Diamond-Stanic et al. (2009); Plotkin et al. (2010a), extended by two quasars SDSS J094533.98+100950.1 (hereafter SDSS J094534) and SDSS J170108.89+395443.0 (hereafter SDSS J170109). Both sources lie at intermediate-redshift distances with z of 1.66 and 1.89, respectively.
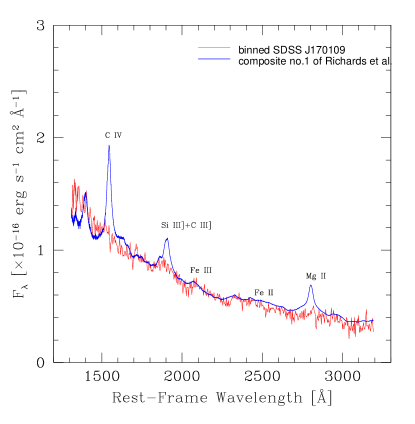
A spectrum of SDSS J094534 was analysed extensively by Hryniewicz et al. (2010). The second source (see its spectrum in Fig. 1) was retrieved serendipitously by us in the SDSS Data Release 7 (DR7) quasar catalogue (Shen et al., 2011). We classified it as WLQ because (1) the equivalent widths of the C IV and Mg II measured at the rest frame are small (i.e. EW(C IV) Å, EW(Mg II) Å, Shen et al. 2011), (2) this quasar is radio-intermediate as a dozen WLQ sources (rest-frame , Shen et al. 2011), (3) the UV continuum of SDSS J170109 can be fit as a power law with a spectral index 444This value is equivalent to where . identical within errors to that of the quasar composite from Richards et al. (2003). This value also differs from the mean spectral index calculated for BL Lac candidates for which we have (Plotkin et al., 2010a).
All sources were detected by the Sloan Digital Sky Survey. In our analysis we are using the equivalent widths, EW, of emission-lines measured in the rest-frame, fluxes of those lines, masses of the supermasive black holes, , accretion rates in the Eddington units, , and the spectral indices, . Almost all but values, were found in the SDSS DR7 quasar catalogue (Shen et al., 2011). Shen et al. (2011) point out that estimated EW(C IV) are encumbered with large error when the signal-to-noise ratio (S/N) of the observed WLQ spectrum is lower than 5 (see their figure 8). Therefore, in these cases we use EW values estimated by Diamond-Stanic et al. (2009) which for all sources but two have EW(C IV) . In other cases we use upper limits taken from the quasar catalogue or calculate them (see Table LABEL:tab:WLQ). The spectral indices, , of WLQs were taken from Shemmer et al. (2006, 2009). All those values originate from the Chandra observations. Additionally, we checked the Chandra Multiwavelength Project Catalogue (Green et al., 2009). We cross-correlated this catalogue with SDSS DR7. No new WLQs but SDSS J170109 were found. Its is equal to .
3 Comparison of WLQs with normal quasars
Our aim is to compare the Baldwin effect observed in weak emission-line quasars to that observed in normal Type 1 quasars. Fig. 2 displays the EW of the C IV emission-line against the dimensionless accretion rates for different types of quasars. This figure includes 81 quasars from the Bright Quasar Survey (BQS) with redshifts z and bolometric values analyzed by Boroson & Green (1992). Baskin & Laor (2004) estimated their EW(C IV) and , respectively. Dashed line represents the best linear fit to their data (Baskin & Laor, 2004, 2005). The triangles show 76 WLQs for which the EW and the accretion ratios were calculated by Shen et al. (2011) or Diamond-Stanic et al. (2009). We must notice here that in both Baskin & Laor’s and Shen et al.’s papers the methods to estimate are similar. Both calculated the bolometric luminosity using relationship , where is the continuum luminosity measured at wavelength and is the appropriate bolometric correction factor. Both methods estimate the Eddington luminosity, using the scalling method in order to calculate the black hole mass in AGN i.e. FWHM2(ion). In this equation FWHM stands for the Full Width at Half Maximum of ion which produces the emission-line. BQS quasars and high-z WLQs lie at different distances, therefore, Baskin & Laor and Shen et al. used observations of different emission-lines and continuum luminosities to calculate . Baskin & Laor (2004) used FWHM of H line, measured at 5100 Å in the rest-frame of quasar and (see equation (3) in Laor, 1998). The authors used H emission-line to estimate because many scientists suggest non virialize character of C IV (e.g. Risaliti, Young & Elvis, 2009; Fine et al., 2010; Richards et al., 2011). However, high-z WLQs have redshifts higher than 2.2. Therefore, Shen et al. (2011) used C IV line and continuum luminosity observed at 1350Å. They used the relationship determined by Vestergaard & Peterson (2006) between , FWHM, and for which . Baskin & Laor (2004) found an anti-correlation between EW(C IV) and . However, if one calculate Eddington ratios based on C IV emission-lines this relationship is much weaker than the correlation with the estimated based on H (Baskin & Laor, 2005).
In this paper we analyse 83 weak emission-line quasars, however, in Fig. 2 only 76 of them have C IV emission-line strong enough to determine their (see Table LABEL:tab:WLQ). The EW of the remaining WLQs are lower than 3 to 7 Å for sources with stronger or weaker UV fluxes, respectively. It is worth noting that one object of the BQS lie in the region dominated by WLQ. This is the radio-quiet quasar (PG 0043+039, ) with EW(C IV) = Å (Baskin & Laor, 2004). Its H emission-line is strong with EW = 92 Å, whereas, O [III] and He II are weak, with EWs equal to 1 and 0 Å, respectively (Boroson & Green, 1992).
On the contrary to PG 0043+039 several (17 from 76) WLQs have large equivalent widths of C IV line and behave like normal Type 1 quasars. Their median distance from the Baskin & Laor’s linear fit is only when for “genuine” WLQs is larger . We must mention, that Shemmer et al. (2009) decided to use EW(C IV) 10 Å as a hallmark of WLQs. However, Diamond-Stanic et al. (2009) decided to use EW of Ly+N V blend as those lines are better seen in distant weak line quasars. Therefore, we kept this definition (i.e. EW(Ly+N V) Å) as a rule for our study. We suggest that the weakness of the EW(Ly+N V) in the sources with prominent C IV emission-lines is caused by strong absorption of the Ly region and that they are, in fact, normal quasars.
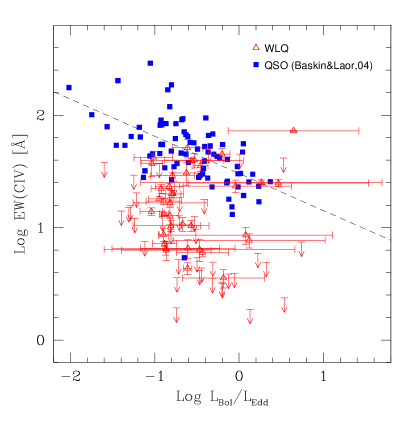
The best linear fit to BQS quasars sample (seen in Fig. 2) suggests that WLQs follow a different relationship than normal quasars between EW and the accretion ratio. The errors of those quantities for WLQ are large and,unfortunately, we cannot fit a correlation to them. However, in order to statistically quantify the hypothesis about different relations we compare the reduced chi-squares, , in BQS’ and WLQ’s cases. We divide our WLQ objects into two subsets. The first one consists of all 76 weak emission-line quasars. In the second case we exclude all the upper limits on EW(C IV) from our subset. We also assume that that the obtained fit parameters for normal quasars are also the same for WLQs. The estimated reduced chi-square is 27.7 in the case of BQS quasars. That value is significantly larger than 1. However, we must notice that there is a large spread in distribution of normal quasars around the linear fit. If we assume that a natural spread is less than 9 Å and we calculate the fit avoiding outliers than the reduced chi-squares decreases to . The estimated for WLQs are including and excluding upper limits on EW, respectively. The obtained values corroborate the hypothesis about difference in relationships.
We must keep in mind, that values are calculated using the method based on the luminosity- relation, i.e. . In many cases, the emission-lines in WLQ objects are broad and their FWHM equals to a few thousand km s-1 (see Mg II in Hryniewicz et al. 2010, H in Shemmer et al. 2010 or C IV in Shen et al. 2011). Nevertheless, for weak C IV line (e.g. EW a few Å) the FWHM value is underestimated thus ratio is overestimated.
The existence of normal accretion rates in WLQs was discussed recently by Hryniewicz et al. (2010). They have argued that when the Eddington ratio increases the width of Ly, Mg II lines decreases, C IV emission decreases, however, the Si IV line should become stronger, and the UV Fe II emission decreases. As the last two behaviours are not observed in WLQ (see e.g. Schneider et al., 2010)555http://www.sdss.org/dr7/, Hryniewicz et al. (2010) claimed that the weakness of the emission-lines in WLQs is not caused by high .
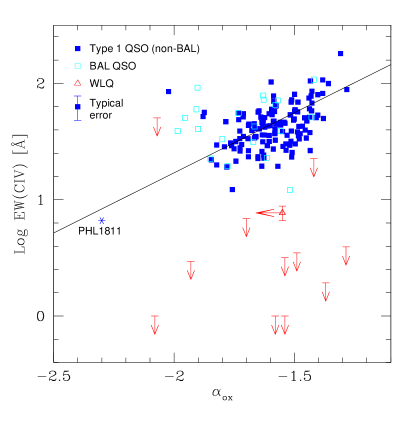
So far, no observations of the FUV spectra of WLQs were made. Therefore, we analysed which can shed light on the shapes of the SED in the FUV/soft X-ray band (Fig. 3). Apart from the spectral indices for WLQs we analyzed together with them 155 normal quasars. Their values were taken from the Chandra Multiwavelength Project (Green et al., 2009). We cross-corellated this catalogue with SDSS DR7 Quasar Catalogue (Shen et al., 2011) to obtain the EW(C IV) of quasars. The solid line in Fig. 3 represents the best fit made by Wu et al. (2009). We must notice that this linear fit was made to another sample of quasars, however, it fits very well to our sample of normal quasars. Our study clearly shows that values in weak emission-line quasars span the same region as seen in non-BAL and BAL QSOs. It points out that the UV/soft X-ray SED of WLQs is similar to those seen in normal AGNs and proves that a soft ionizing continuum is not the reason for the weakness of the lines. That situation is found in PHL 1811 which is NLS1 galaxy with super-Eddington rate ( 0.9-1.6) and steep ionizing continuum () (Leighly et al., 2007b). Therefore, PHL 1811 follows the relationship estimated by Wu et al. (2009).
4 Discussion
The WLQs are shifted vertically in the EW(C IV)- plane relative to normal quasars (Fig. 2). This offset and the fact that QSOs and WLQs SED are almost the same, indicate that weak emission-line quasars are normal AGNs, however, with intrinsically weak C IV emission-line. It is also clearly shown that the super-Eddington luminosities are not required in weak line quasars contrasting with the idea that WLQs are super-Eddington sources (Leighly et al., 2007b). Furthermore, the accretion rates in WLQs span the same interval as normal quasars (Fig. 2).
The SEDs of weak line quasars observed in optical/UV band (till 1200 Å) does not differ from the SEDs of normal quasars (e.g. Diamond-Stanic et al., 2009). However, the far-UV (FUV) spectrum of AGNs and their relative quietness in the soft X-ray band produce weak emission-lines as supported by photoionization modeling (see e.g. Leighly, 2004; Leighly & Casebeer, 2007, for review). Due to the absent of the far-UV spectra of WLQs we analysed the X-ray to optical luminosity ratio of different quasars (Fig. 3). Similar analysis was carried out by Richards et al. (2011) or Wu et al. (2011) (see their figure 9 or figure 6, respectively). We focus on weak emission-line quasars and enlarged our sample by adding objects with EW(C IV) . Our analysis indicates that the UV/soft X-ray SED of WLQs is similar to those of normal AGNs and a soft ionizing continuum is not the reason for the weakness of the lines.
| Ratio | NGC5548 | PG QSO | non-BAL QSO | BAL QSO | WLQ(all) | WLQ(sub) | |
|---|---|---|---|---|---|---|---|
| (1) | (2a) | (2b) | (3) | (4) | (5) | (6) | (7) |
| C IV/Ly | 1.45 | 0.94 | |||||
| C IV/Mg II | 5.80 | 4.98 | |||||
| C III](1909)/Mg II | 1.07 | 0.91 | |||||
| Ly /H | 8.57 | ||||||
Column (1) refers the names of intensity ratios. In the case of Seyfert 1.5 galaxy NGC 5548 those values are shown in Column (2a) and (2b). In Column (2a) the Ly, C IV, and C III] fluxes are taken from Korista et al. (1995), the Mg II flux from Gaskell, Klimek & Nazarova (2007), and the H flux from Wanders & Peterson (1996). The ratios in Column (2b) are calculated from corrected for narrow-line fluxes and taken from Korista & Goad (2000). Column (3) refers to sample of 18 radio quiet PG quasars (Shang et al., 2007). Values of intensity ratio of radio-quiet and radio-intermediate 97 non-BAL and 14 BAL quasars are shown in Columns (4) and (5), respectively. Those sources was selected after cross-matching SDSS DR7 Quasar Catalogue (Shen et al., 2011) with Green et al. (2009) sample. This sample is consistent with sample used in the Fig. 3. In Column (6) we calculate mean ratio for all WLQs which show weak or strong C IV lines. Column (7) refers to subsample of WLQs, for which EW(C IV) Å and EW(Ly) Å. The superscripts in this column correspond to the following information: a mean is calculated from 59 WLQs, b mean from SDSS J094534 and SDSS J170109, c value only for SDSS J094534, d mean from SDSS J114153.34+021924.3 and SDSS J123743.08+630144.9. Data for intensity of C IV line in WLQs are taken from Shen et al. (2011), for Ly from Diamond-Stanic et al. (2009), for C IV/Mg II, and C III]/Mg II ratios from Hryniewicz et al. (2010), Hryniewicz et al. (in preparation), and for H from Shemmer et al. (2010).
The intensity of an emission-line depends on the flux of ionizing continuum, , and on the BLR gas covering factor, : (see Ferland, 2004, and his discussion for He II 1640). The spectral index, , measures by definition the ratio of the luminosities at 2 keV and at 2500Å. If we assume that is roughly equal to and assuming that , we can write . We can then express the line equivalent width as:
The correlation EW(C IV)- obtained for normal quasars by e.g Wu et al. (2009) infers that the gas covering factor in BLR in Type 1 quasars is relatively constant. The gas covering factor in WLQ objects behaves differently (Fig. 3), suggesting that is times smaller than in QSOs.
Table 1 compares the emission-line intensity ratios observed in Seyfert 1.5 galaxy NGC 5548, normal quasars, and WLQs. We focus on 59 ‘real WLQs’, i.e. our selected subsample which consists of sources with EW(C IV) 20 Å and EW(Ly) 15.4 Å (see Column (7) of Table 1). We take into account line intensities produced by high-ionization lines (HILs; such as Ly, C IV), intermediate-ionization lines (IILs; e.g. C III]), and low-ionization lines (LILs; such as Mg II, H ). The C IV/Ly intensity ratio for different sources are the same from a statistical point of view. The ratio of the covering factors of the regions responsible for producing C IV and Ly are therefore similar in WLQs and QSOs. Comparing low-, intermediate- with high-ionization lines we obtain that the ratios of the covering factors of HIL/LIL and IIL/LIL are lower in WLQs that in normal quasars. Even if for WLQ these ratios are based on only few sources. This suggests that the covering factor of the BLR is smaller in WLQ.
This is in agreement with observations of the weak H emission-lines in SDSS J114153.34+021924.3 and SDSS J123743.08+630144.9 (Shemmer et al., 2010). There authors have explained the weakness of their emission-lines by a deficit of the BLR. The absence of BLR in WLQs have also been recently suggested by Liu & Zhang (2011). The existence of bright AGNs with dusty tori, but without BLR could be understood when an anisotropic radiative pressure is released from an accretion disc. Liu & Zhang stated that this is possible just before the normal phase of an AGN. Additionally, Leighly & Moore (2004) suggested based on observations of the emission-line profiles of NLS1 galaxies IRAS 13224-3809 and 1H 0707-495 that the high-ionization lines are produced in a wind and that the intermediate- and low-ionization lines are produced in low-velocity gas associated with the accretion disk at the base of the wind. Both pictures are consistent with a suggestion that the regions producing emission-lines are developed by winds (Hawkins, 2004; Hryniewicz et al., 2010). In that case, when the BLR is created its covering factor is lower than estimated in normal AGNs.
There is an observational analogy between weak emission-line quasars and the class of “optical dull” AGNs (also called XBONGs – “X-ray bright, optically normal galaxies”). Their X-ray emission is bright while they lack both the broad emission-lines of Type 1 AGNs and the narrow emission-lines Type 2 AGNs (Elvis et al., 1981; Comastri et al., 2002; Georgantopoulos & Georgakakis, 2005). There are a few hypothesis trying to answer the latent nature of XBONGs (see e.g. Moran, Filippenko & Chornock, 2002; Severgnini et al., 2003; Rigby et al., 2006; Civano et al., 2007; Trump et al., 2009). However, none of them (such as dilution their spectra by a host galaxy, the low Eddington accretion rate) can explain WLQs.
Elvis (2000) has proposed an empirically derived structure for quasars. He suggests presence of the funnel-shaped geometrically thin accretion outflow which contains an high ionized gas embedded in the colder BLR clouds. According to our paper the low covering factor of the BLR means that WLQ has got less clouds in the outflow or equivalently the “funnel” wind is geometrically thiner.
Low covering factor of the BLR in WLQs would have additional consequence observed in the infrared (IR) band. Gaskell, Klimek & Nazarova (2007) have argued that the covering factors of the BLR and of the dusty torus have to be the same. It means that a small BLR in WLQs causes an evaporation of dust in the torus and a reduction of its IR emissivity. Diamond-Stanic et al. (2009) mentioned that two weak line quasars SDSS J140850.91+020522.7 (with EW(C IV) = 1.95 Å) and SDSS J144231.72+011055.2 (with EW(C IV) = 16.9 Å) are fainter in the IR (m) band by 30-40%. Additionally, the IR flux density of SDSS J130216.13+003032.1 (EW(C IV) = 27.8 Å) is also relatively low. More IR observations of WLQs are required to confirm this hypothesis.
5 Conclusions
We have explored the Baldwin effect (BEff) in 82 high-redshift (z 2.2) and 2 intermediate-redshift weak-line quasars (WLQs) and compared them with a set of normal quasars. We draw the following conclusions:
-
•
The relationship between the rest-frame equivalent width for C IV emission-line and the Eddington ratio observed in WLQs has different normalization than for normal QSOs. This shift disagrees with the super-Eddington hypothesis (e.g. Shemmer et al., 2010).
-
•
The weakness or even the absence of emission-lines in WLQs is likely caused by a low covering factor of the broad line region (BLR) rather than by a very soft ionizing continuum. The comparison of the EW(C IV) and of the spectral indices, , shows that the gas covering factor of the BLR in WLQs is times less than for normal QSOs.
-
•
The ratios of the covering factors of regions responsible for producing C IV and Ly are similar in WLQs and QSOs.
-
•
The ratios of the covering factors are lower in WLQ than in QSOs showing the deficit of the BLR in WLQ. However, this result is based on observations of only four sources.
-
•
The radio-intermediate quasar SDSS J170108.89+395443.0 (z ) is a new intermediate-redshifted WLQ with rest-frame EW(C IV) Å and EW(Mg II) Å, respectively (Shen et al., 2011).
-
•
The definition of WLQ objects should take into account not only the weakness of Ly or C IV emission-lines, separately, but both lines together. ‘False WLQs’ (sources with prominent C IV) are probably normal Type 1 quasars with intervening Ly absorption.
Acknowledgments
We would like to thank an anonymous referee for useful comments that improve our paper. We are grateful to Bozena Czerny, Krzysztof Hryniewicz and Joanna Kuraszkiewicz for advices during calculation and doing our analysis. We also thank Gary Ferland for pointing out a helpful article. MN thanks the Scientific Exchange Programme (Sciex) NMSch for opportunity of working at the ISDC. This research has been supported in part by the Polish MNiSW grants NN203 380136, and 362/1/N-INTEGRAL/2008/09/0.
References
- Anderson et al. (2001) Anderson S. F. et al., 2001, AJ, 122, 503
- Avni & Tananbaum (1982) Avni Y., Tananbaum H., 1982, ApJL, 262, L17
- Bachev et al. (2004) Bachev R., Marziani P., Sulentic J. W., Zamanov R., Calvani M., Dultzin-Hacyan D., 2004, ApJ, 617, 171
- Baldwin (1977) Baldwin J. A., 1977, ApJ, 214, 679
- Baskin & Laor (2004) Baskin A., Laor A., 2004, MNRAS, 350, L31
- Baskin & Laor (2005) —, 2005, MNRAS, 356, 1029
- Bianchi et al. (2007) Bianchi S., Guainazzi M., Matt G., Fonseca Bonilla N., 2007, A&A, 467, L19
- Boroson & Green (1992) Boroson T. A., Green R. F., 1992, ApJS, 80, 109
- Cardelli, Clayton & Mathis (1989) Cardelli J. A., Clayton G. C., Mathis J. S., 1989, ApJ, 345, 245
- Civano et al. (2007) Civano F. et al., 2007, A&A, 476, 1223
- Collinge et al. (2005) Collinge M. J. et al., 2005, AJ, 129, 2542
- Comastri et al. (2002) Comastri A. et al., 2002, ApJ, 571, 771
- Diamond-Stanic et al. (2009) Diamond-Stanic A. M. et al., 2009, ApJ, 699, 782
- Dietrich et al. (2002) Dietrich M., Hamann F., Shields J. C., Constantin A., Vestergaard M., Chaffee F., Foltz C. B., Junkkarinen V. T., 2002, ApJ, 581, 912
- Dong et al. (2009) Dong X., Wang J., Wang T., Wang H., Fan X., Zhou H., Yuan W., Long Q., 2009, in Astronomical Society of the Pacific Conference Series, Vol. 408, The Starburst-AGN Connection, W. Wang, Z. Yang, Z. Luo, & Z. Chen, ed., p. 83
- Elvis (2000) Elvis M., 2000, ApJ, 545, 63
- Elvis et al. (1981) Elvis M., Schreier E. J., Tonry J., Davis M., Huchra J. P., 1981, ApJ, 246, 20
- Fan et al. (1999) Fan X. et al., 1999, ApJL, 526, L57
- Fan et al. (2006) —, 2006, AJ, 131, 1203
- Ferland (2004) Ferland G., 2004, in Astronomical Society of the Pacific Conference Series, Vol. 311, AGN Physics with the Sloan Digital Sky Survey, G. T. Richards & P. B. Hall, ed., p. 161
- Fine et al. (2010) Fine S., Croom S. M., Bland-Hawthorn J., Pimbblet K. A., Ross N. P., Schneider D. P., Shanks T., 2010, MNRAS, 409, 591
- Gaskell, Klimek & Nazarova (2007) Gaskell C. M., Klimek E. S., Nazarova L. S., 2007, ArXiv e-prints (arXiv:0711.1025)
- Georgantopoulos & Georgakakis (2005) Georgantopoulos I., Georgakakis A., 2005, MNRAS, 358, 131
- Gibson, Brandt & Schneider (2008) Gibson R. R., Brandt W. N., Schneider D. P., 2008, ApJ, 685, 773
- Gilbert & Peterson (2003) Gilbert K. M., Peterson B. M., 2003, ApJ, 587, 123
- Green et al. (2009) Green P. J. et al., 2009, ApJ, 690, 644
- Green, Forster & Kuraszkiewicz (2001) Green P. J., Forster K., Kuraszkiewicz J., 2001, ApJ, 556, 727
- Hawkins (2004) Hawkins M. R. S., 2004, A&A, 424, 519
- Hryniewicz et al. (2010) Hryniewicz K., Czerny B., Nikołajuk M., Kuraszkiewicz J., 2010, MNRAS, 404, 2028
- Iwasawa & Taniguchi (1993) Iwasawa K., Taniguchi Y., 1993, ApJL, 413, L15
- Jiang et al. (2007) Jiang L., Fan X., Ivezić Ž., Richards G. T., Schneider D. P., Strauss M. A., Kelly B. C., 2007, ApJ, 656, 680
- Jiang, Wang & Wang (2006) Jiang P., Wang J. X., Wang T. G., 2006, ApJ, 644, 725
- Just et al. (2007) Just D. W., Brandt W. N., Shemmer O., Steffen A. T., Schneider D. P., Chartas G., Garmire G. P., 2007, ApJ, 665, 1004
- Keremedjiev, Hao & Charmandaris (2009) Keremedjiev M., Hao L., Charmandaris V., 2009, ApJ, 690, 1105
- Kinney, Rivolo & Koratkar (1990) Kinney A. L., Rivolo A. R., Koratkar A. P., 1990, ApJ, 357, 338
- Kong et al. (2006) Kong M., Wu X., Wang R., Liu F. K., Han J. L., 2006, A&A, 456, 473
- Korista, Baldwin & Ferland (1998) Korista K., Baldwin J., Ferland G., 1998, ApJ, 507, 24
- Korista et al. (1995) Korista K. T. et al., 1995, ApJS, 97, 285
- Korista & Goad (2000) Korista K. T., Goad M. R., 2000, ApJ, 536, 284
- Kuraszkiewicz et al. (2002) Kuraszkiewicz J. K., Green P. J., Forster K., Aldcroft T. L., Evans I. N., Koratkar A., 2002, ApJS, 143, 257
- Laor (1998) Laor A., 1998, ApJL, 505, L83
- Laor et al. (1997) Laor A., Fiore F., Elvis M., Wilkes B. J., McDowell J. C., 1997, ApJ, 477, 93
- Leighly (2004) Leighly K. M., 2004, ApJ, 611, 125
- Leighly & Casebeer (2007) Leighly K. M., Casebeer D., 2007, in Astronomical Society of the Pacific Conference Series, Vol. 373, The Central Engine of Active Galactic Nuclei, L. C. Ho & J.-W. Wang, ed., p. 365
- Leighly et al. (2007a) Leighly K. M., Halpern J. P., Jenkins E. B., Casebeer D., 2007a, ApJS, 173, 1
- Leighly et al. (2007b) Leighly K. M., Halpern J. P., Jenkins E. B., Grupe D., Choi J., Prescott K. B., 2007b, ApJ, 663, 103
- Leighly & Moore (2004) Leighly K. M., Moore J. R., 2004, ApJ, 611, 107
- Liu & Zhang (2011) Liu Y., Zhang S. N., 2011, ApJL, 728, L44
- McDowell et al. (1995) McDowell J. C., Canizares C., Elvis M., Lawrence A., Markoff S., Mathur S., Wilkes B. J., 1995, ApJ, 450, 585
- Moran, Filippenko & Chornock (2002) Moran E. C., Filippenko A. V., Chornock R., 2002, ApJL, 579, L71
- Netzer, Laor & Gondhalekar (1992) Netzer H., Laor A., Gondhalekar P. M., 1992, MNRAS, 254, 15
- Plotkin et al. (2010a) Plotkin R. M. et al., 2010a, AJ, 139, 390
- Plotkin et al. (2010b) Plotkin R. M., Anderson S. F., Brandt W. N., Diamond-Stanic A. M., Fan X., MacLeod C. L., Schneider D. P., Shemmer O., 2010b, ApJ, 721, 562
- Pogge & Peterson (1992) Pogge R. W., Peterson B. M., 1992, AJ, 103, 1084
- Richards et al. (2003) Richards G. T. et al., 2003, AJ, 126, 1131
- Richards et al. (2011) —, 2011, AJ, 141, 167
- Rigby et al. (2006) Rigby J. R., Rieke G. H., Donley J. L., Alonso-Herrero A., Pérez-González P. G., 2006, ApJ, 645, 115
- Risaliti, Young & Elvis (2009) Risaliti G., Young M., Elvis M., 2009, ApJL, 700, L6
- Schneider et al. (2003) Schneider D. P. et al., 2003, AJ, 126, 2579
- Schneider et al. (2007) —, 2007, AJ, 134, 102
- Schneider et al. (2005) —, 2005, AJ, 130, 367
- Schneider et al. (2010) —, 2010, VizieR Online Data Catalog, 7260, 0
- Severgnini et al. (2003) Severgnini P. et al., 2003, A&A, 406, 483
- Shang et al. (2003) Shang Z., Wills B. J., Robinson E. L., Wills D., Laor A., Xie B., Yuan J., 2003, ApJ, 586, 52
- Shang et al. (2007) Shang Z., Wills B. J., Wills D., Brotherton M. S., 2007, AJ, 134, 294
- Shemmer et al. (2009) Shemmer O., Brandt W. N., Anderson S. F., Diamond-Stanic A. M., Fan X., Richards G. T., Schneider D. P., Strauss M. A., 2009, ApJ, 696, 580
- Shemmer et al. (2006) Shemmer O. et al., 2006, ApJ, 644, 86
- Shemmer et al. (2010) —, 2010, ApJL, 722, L152
- Shen et al. (2011) Shen Y. et al., 2011, ApJS, 194, 45
- Shields (2007) Shields J. C., 2007, in Astronomical Society of the Pacific Conference Series, Vol. 373, The Central Engine of Active Galactic Nuclei, L. C. Ho & J.-W. Wang, ed., p. 355
- Strateva et al. (2005) Strateva I. V., Brandt W. N., Schneider D. P., Vanden Berk D. G., Vignali C., 2005, AJ, 130, 387
- Trump et al. (2009) Trump J. R. et al., 2009, ApJ, 706, 797
- Vestergaard & Peterson (2006) Vestergaard M., Peterson B. M., 2006, ApJ, 641, 689
- Wanders & Peterson (1996) Wanders I., Peterson B. M., 1996, ApJ, 466, 174
- Warner, Hamann & Dietrich (2004) Warner C., Hamann F., Dietrich M., 2004, ApJ, 608, 136
- Wu et al. (2011) Wu J. et al., 2011, ApJ, 736, 28
- Wu et al. (2009) Wu J., Vanden Berk D. E., Brandt W. N., Schneider D. P., Gibson R. R., Wu J., 2009, ApJ, 702, 767
- Xu et al. (2008) Xu Y., Bian W., Yuan Q., Huang K., 2008, MNRAS, 389, 1703
- Zamorani et al. (1992) Zamorani G., Marano B., Mignoli M., Zitelli V., Boyle B. J., 1992, MNRAS, 256, 238
- Zhou & Wang (2005) Zhou X., Wang J., 2005, ApJL, 618, L83
| Name | EW(C IV) | ref. | ref. | ||||
|---|---|---|---|---|---|---|---|
| (Å) | () | ||||||
| SDSS 010802.90-010946.1 | 3.330 | ||||||
| SDSS 025646.56+003858.3 | 3.473 | (1) | |||||
| SDSS 031712.23-075850.3 | 2.695 | (2) | (3) | ||||
| SDSS 080523.32+214921.1 | 3.463 | ||||||
| SDSS 080906.87+172955.1 | 2.953 | ||||||
| SDSS 082059.34+561021.9 | 3.636 | ||||||
| SDSS 082638.59+515233.2 | 2.850 | ||||||
| SDSS 083122.57+404623.3 | 4.885 | ||||||
| SDSS 083304.73+415331.3 | 2.329 | ||||||
| SDSS 083330.56+233909.1 | 2.417 | ||||||
| SDSS 084249.03+235204.7 | 3.316 | ||||||
| SDSS 084424.24+124546.5 | 2.505 | ||||||
| SDSS 084434.15+224305.2 | 3.117 | ||||||
| SDSS 090703.91+410748.3 | 2.672 | ||||||
| SDSS 091738.90+082053.9 | 3.252 | (1) | |||||
| SDSS 092312.75+174452.8 | 2.260 | ||||||
| SDSS 093306.88+332556.6 | 4.560 | ||||||
| SDSS 094533.98+100950.1 | 1.661 | ||||||
| SDSS 095108.76+314705.8 | 3.032 | ||||||
| SDSS 101204.04+531331.7 | 2.990 | (3) | |||||
| SDSS 101849.78+271914.9 | 2.603 | ||||||
| SDSS 102609.92+253651.2 | 2.317 | ||||||
| SDSS 102949.80+605731.7 | 3.190 | ||||||
| SDSS 103240.54+501211.0 | 3.874 | ||||||
| SDSS 104650.29+295206.8 | 4.266 | ||||||
| SDSS 105049.27+441144.7 | 4.320 | ||||||
| SDSS 111642.81+420324.9 | 2.526 | ||||||
| SDSS 113354.89+022420.9 | 3.990 | ||||||
| SDSS 113729.42+375224.2 | 4.166 | ||||||
| SDSS 113747.64+391941.5 | 2.395 | ||||||
| SDSS 114153.33+021924.3 | 3.480 | (2) | (3) | ||||
| SDSS 114412.76+315800.8 | 3.235 | ||||||
| SDSS 114958.53+375115.0 | 4.315 | ||||||
| SDSS 115254.96+150707.7 | 3.328 | (1) | |||||
| SDSS 115308.45+374232.1 | 3.028 | (1) | |||||
| SDSS 115906.52+133737.7 | 3.984 | ||||||
| SDSS 115933.53+054141.6 | 3.286 | (1) | |||||
| SDSS 115959.71+410152.9 | 2.788 | ||||||
| SDSS 120059.68+400913.1 | 3.366 | ||||||
| SDSS 121221.56+534127.8 | 3.097 | (3) | |||||
| SDSS 121812.39+444544.5 | 4.518 | ||||||
| SDSS 122021.39+092135.8 | 4.110 | (1) | |||||
| SDSS 122359.35+112800.0 | 4.120 | ||||||
| SDSS 122445.26+375921.3 | 4.315 | ||||||
| SDSS 123116.08+411337.3 | 3.838 | ||||||
| SDSS 123132.37+013814.0 | 3.229 | (3) | |||||
| SDSS 123315.94+313218.4 | 3.222 | (1) | |||||
| SDSS 123540.19+123620.7 | 3.215 | (1) | |||||
| SDSS 123743.08+630144.8 | 3.425 | (1) | (3) | ||||
| SDSS 124204.28+625712.1 | 3.321 | (1) | |||||
| SDSS 124745.39+325147.0 | 2.249 | ||||||
| SDSS 125306.73+130604.9 | 3.624 | ||||||
| SDSS 125319.10+454152.8 | 3.435 | ||||||
| SDSS 130216.13+003032.1 | 4.506 | (2) | (3) | ||||
| SDSS 131429.00+494149.0 | 3.813 | (1) | |||||
| SDSS 132603.00+295758.1 | 3.767 | (1) | |||||
| SDSS 132703.26+341321.7 | 2.558 | ||||||
| SDSS 133146.20+483826.5 | 3.742 | ||||||
| SDSS 133422.63+475033.5 | 4.950 | (2) | (3) | ||||
| SDSS 134521.39+281822.2 | 4.082 | ||||||
| SDSS 140300.23+432805.4 | 4.696 | ||||||
| SDSS 140850.91+020522.7 | 4.007 | (4) | |||||
| SDSS 141209.96+062406.9 | 4.466 | ||||||
| SDSS 141318.86+450523.0 | 3.113 | ||||||
| SDSS 141657.93+123431.6 | 2.603 | ||||||
| SDSS 142103.83+343332.0 | 4.907 | (3) | |||||
| SDSS 142144.98+351315.4 | 4.556 | ||||||
| SDSS 142257.67+375807.4 | 3.163 | (1) | |||||
| SDSS 144127.65+475048.7 | 3.190 | ||||||
| SDSS 144231.71+011055.3 | 4.507 | (4) | |||||
| SDSS 144803.36+240704.2 | 3.544 | ||||||
| SDSS 155645.30+380752.8 | 3.320 | ||||||
| SDSS 160336.64+350824.3 | 4.460 | ||||||
| SDSS 161122.45+414409.5 | 3.131 | ||||||
| SDSS 163411.82+215325.0 | 4.529 | ||||||
| SDSS 170108.89+395443.0 | 1.889 | (5) | |||||
| SDSS 210216.52+104906.6 | 4.182 | (1) | |||||
| SDSS 214753.29-073031.3 | 3.153 | (1) | |||||
| SDSS 223827.17+135432.6 | 3.516 | ||||||
| SDSS 225246.43+142525.8 | 4.904 | ||||||
| SDSS 233255.72+141916.3 | 4.754 | ||||||
| SDSS 233446.40-090812.2 | 3.317 | ||||||
| SDSS 233939.48-103539.3 | 2.757 |
Column (1) lists the object name. Column (2) shows the redshift taken from the SDSS DR7 Quasar Catalogue (Shen et al., 2011). Columns (3),(5), and (8) list the rest frame equivalent width of C IV emission-line, logarithm of black hole mass, and accretion rates in the Eddington units, respectively. Column (6) refers to the X-ray to optical luminosity ratio. The values without reference were taken from the SDSS DR7 Quasar Catalogue. A few EW(C IV) and all values were taken from articles with references shown in Columns (4) and (7). Numbers in parentheses correspond to the following references: (1) – Diamond-Stanic et al. (2009), (2) – this paper, (3) – Shemmer et al. (2009), (4) – Shemmer et al. (2006), (5) – Green et al. (2009).