Uncovering low-level Fermi/GBM emission using orbital background subtraction
Abstract
The secondary instrument onboard Fermi, the Gamma-ray Burst Monitor (GBM) is an all sky monitor consisting of 14 scintillation detectors. When analysing transient events such as Gamma-Ray Bursts (GRBs) and Solar Flares (SFs) the background is usually modelled as a polynomial (order 0-4). However, for long events the background may vary more than can be accounted for with a simple polynomial. In these cases a more accurate knowledge of GBM’s background rates is required. Here we present an alternative method of both determining the background and distinguishing low-level emission from the instrumental background.
I Motivation
Launched into a low earth orbit in 2008, the Fermi Gamma-Ray Space Telescope consists of two instruments, the Large Area Telescope (LAT) atwood which uses a pair-production system of detection and the Gamma-Ray Burst Monitor (GBM) meegan which consists of 14 scintillation detectors. Observing the entire unocculted sky, the GBM has an energy range of 8 keV-40 MeV which overlaps with the lower end of the LAT’s range, 20 MeV-300 GeV.
Fermi has an inclination of 26.5∘, an altitude of 565 km and a period of 96 minutes. The primary observation mode of is Sky Survey Mode, this optimises the sky coverage of the LAT whilst maintaining near uniform exposure. In this mode the satellite rocks about the zenith (50∘ formerly 35∘) such that the entire sky is observed for 30 minutes every 2 orbits ( 3 hours). In addition to this rocking the satellite pointing alternates between the northern and southern hemispheres each orbit. Due to the fact that Fermi’s instruments are deactivated in the South Atlantic Anomaly (SAA), which is primarily in the southern hemisphere, there is an exposure differential of 15 % between observations in the north and south hemispheres.
The GBM was optimised for the study of the prompt emission from GRBs, which is characterised by impulsive peaks with sharp rises, often highly structured, and easily distinguishable against instrumental backgrounds. The timescale on which this emission typically occurs is usually short enough that the background can be modelled as a polynomial of order 0-4. However, this method is not suited to resolving smoother long lived emission.


The LAT has observed long lived emission on the order of ks from GRBs, which follows the prompt phase and usually decays as a power law (e.g. for GRB090926A following the prompt emission in the LAT (25 s) the flux decayed as power low () ackerman11 ).
To investigate whether such emission is detectable in GBM and also to confidently determine the background for solar flares, we have implemented a method for estimating the background which uses the rates from adjacent days, when the satellite is at the same geographical coordinates, to estimate the background at the time of interest. This project has been motivated by the work of Connaughton val_tail , who employed a similar technique with BATSE.
II Method
The orbit of Fermi is such that it will be at approximately the same geographical coordinates every 15 orbits ( 24 hrs). Therefore, it would seem that the background at time could be approximated by averaging the rates at times 15 orbits. However, this is not possible as the rocking angle of the spacecraft in sky survey mode is the same every 2 orbits and as a result detectors which are pointed towards the source at will not be pointed towards it at 15 orbits.
One solution to this is to use the rates from 30 orbits. An alternative is to use the average of the rates from 14 orbits and 16 orbits to approximate the rates from 15 orbits.
An obvious limitation of this technique is that it cannot be employed to investigate GRBs for which the satellite accepted an Autonomous Repoint Request (ARR). When an ARR is trigged the telescope will slew so that the GBM calculated position is within the LAT FOV. A natural consequence of this is that the periodic pointing is interrupted for the duration of the ARR (2 hours, formerly 5 hours). This is unfortunate as it means that in general we cannot use our method to search for extended emission in GRBs with LAT detections where there is extended emission in the MeV-GeV range, as these will usually trigger an ARR.
An additional issue is the passage of the satellite through the SAA which can cause elevated rates in the detectors due to activation, particularly in the BGO. The time spent in the SAA varies from orbit to orbit due to the precession of Fermi (52 days). This can lead to a systematic deviation between the estimated background rates and the source rates (see Section III.1).
III Blank Sky Tests
In order to test the validity of the method, a blank sky test was performed. Between May 2009 and April 2011 four regions with triggerless periods of 4 days were selected and used as pseudo sources (see Table 1). An additional criteria in the selection of the blank sky regions was that the regions offset 14,15,30 orbits did not contain and were not preceded by SAA passages.
| Region | Date | Zero Time (MET) | |
|---|---|---|---|
| A | 09/07/28 | 270470679 | |
| B | 10/08/23 | 302922999 | |
| C | 10/08/10 | 324800173 | |
| D | 11/04/18 | 304200725 |
In order to determine which temporal selection provided the background most similar to the actual rate, the background was estimated from 30 orbits and the average of 14,16 orbits for all regions. The background was estimated for a duration of 3500 s using the continuous CSPEC data (128 energy channels and temporal resolution of 4.096 s). Sample lightcurves for detector NaI b for region A can be seen in Figure 1.
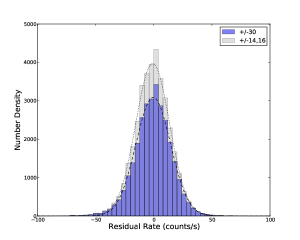


The systematic difference between the estimated rates and the actual rates was examined by histogramming the rate residuals from all the regions separately for the NaI and BGO. In order to limit the effect of interfering sources, the low energy channels of the NaI (25 keV) were not included. Excluding also the overflow channel gives an energy range of 25-1000 keV. For the BGO only the first and overflow channels were discarded, corresponding to an effective energy range of 0.1-45 MeV. The results can be seen in Figure 2. For each offset (30 and 14,16) the histogrammed residuals were fit with gaussians, the parameters of which can be seen in Table 2. The fit parameters are quite similar for 30 and 14,16 for both NaI and BGO which implies that both offsets are equally valid for estimating the background.
| 30 | 14,16 | |||||
|---|---|---|---|---|---|---|
| Amplitude | Mean | Sigma | Amplitude | Mean | Sigma | |
| NaI | 3087 | -0.45 | 15 | 3970 | -0.9 | 14.6 |
| BGO | 399 | -0.26 | 38 | 518 | -2.5 | 37 |
III.1 Effect of SAA passage
Inspection of the residual lightcurves for a region preceded by an SAA passage showed that the background estimated from 30 orbits more closely matched the observed rates following an SAA passage, than that derived from 14,16. This is demonstrated in Figure 3. This is to be expected as the time spent in the SAA for the 30 orbit offset will be a closer match for the passage time for the source region. For regions where the effect of the SAA passage is negligible the rates from 30 and 14,16 orbits closely match the observed rates. This is beneficial as for these regions they can be used interchangeably, allowing the background to be estimated with 30 orbits if there is an interfering source in 14,16 orbits and vice versa.
IV Conclusion
Attempting to study long-lived or non-impulsive smooth emission in a background limited instrument in GBM is challenging. In order to do so a method using the rates from adjacent days to estimate the background has been developed. For the 4 triggerless periods studied this method generates a background which closely matches the source rates. Our study has shown that the rates from 30 and 14,16 orbits can be used interchangeably to estimate the background at the time of interest unless there is an SAA passage exit close to the time of interest, in which case the rates from 30 should be used.
IV.1 Acknowledgments
Acknowledgements.
This work has been suppourted by a Marie Curie European Reintegration Grant within the 7th Program under contract number PERG04-GA-2008-239176 and by the European Space Agency/Enterprise Ireland.References
- (1) W. B. Atwood, A. A Abdo, M. Ackermann et al., “The Large Area Telescope on the Fermi Gamma-Ray Space Telescope Mission”, APJ, 2009
- (2) C. Meegan, G. Lichti, P. N. Bhat et al., “The Fermi Gamma-ray Burst Monitor”’, APJ, 2009
- (3) M. Ackermann, M. Ajello, K. Asano, et al., “Detection of a Spectral Break in the Extra Hard Component of GRB 090926A”, APJ, 2011
- (4) V. Connaughton, “BATSE Observations of Gamma-Ray Burst Tails”’,2002