Discovery of a Wolf-Rayet Star Through Detection of its Photometric Variability
Abstract
We report the serendipitous discovery of a heavily reddened Wolf-Rayet star that we name WR 142b. While photometrically monitoring a cataclysmic variable, we detected weak variability in a nearby field star. Low-resolution spectroscopy revealed a strong emission line at 7100 Å, suggesting an unusual object and prompting further study. A spectrum taken with the Hobby-Eberly Telescope confirms strong He II emission and a N IV 7112 Å line consistent with a nitrogen-rich Wolf-Rayet star of spectral class WN6. Analysis of the He II line strengths reveals no detectable hydrogen in WR 142b. A blue-sensitive spectrum obtained with the Large Binocular Telescope shows no evidence for a hot companion star. The continuum shape and emission line ratios imply a reddening of to mag. If not for the dust extinction, this new Wolf-Rayet star could be visible to the naked eye.
1 Introduction
Wolf-Rayet (WR) stars have been enigmatic objects ever since the discovery of the first three WR stars in 1867 (Wolf & Rayet, 1867). Their spectra show strong, Doppler-broadened emission lines, primarily from helium and either carbon or nitrogen of various ionization states. The nitrogen-rich variety, which are classified as WN stars, outnumber the carbon-rich WC stars in current surveys of Galactic WR stars (van der Hucht, 2001). Lamers et al. (1991) conclusively showed that WR stars are evolved, high-surface-temperature stars that have shed their envelopes via their strong stellar winds. As WR stars lose mass, they expose elements created via hydrogen fusion and, eventually, those from helium fusion as well (Conti, 1976). They often have masses between 10-25 M⊙ and even as high as 80 M⊙ in some cases (Crowther, 2007). WR stars are destined to end their lives as type Ib/c supernovae and possibly gamma-ray bursts (e.g., Smartt (2009)).
WR stars are rare, and only about 400 are known in the Galaxy (Roman-Lopes, 2011). Because they are young stars close to the Galactic plane, WR stars are often obscured by dust. Most recent searches have used infrared wavelengths to avoid dust extinction and find new members of the WR family (e.g., Wachter et al. (2010)).
Here, we report the serendipitous discovery of a new WR star that was selected for study due to its photometric variability. Even weak variability can mark unusual stellar types and will be an important method of identifying rare stars in the era of the Large Synoptic Survey Telescope (Borne et al., 2008).
2 Observations
2.1 Photometry
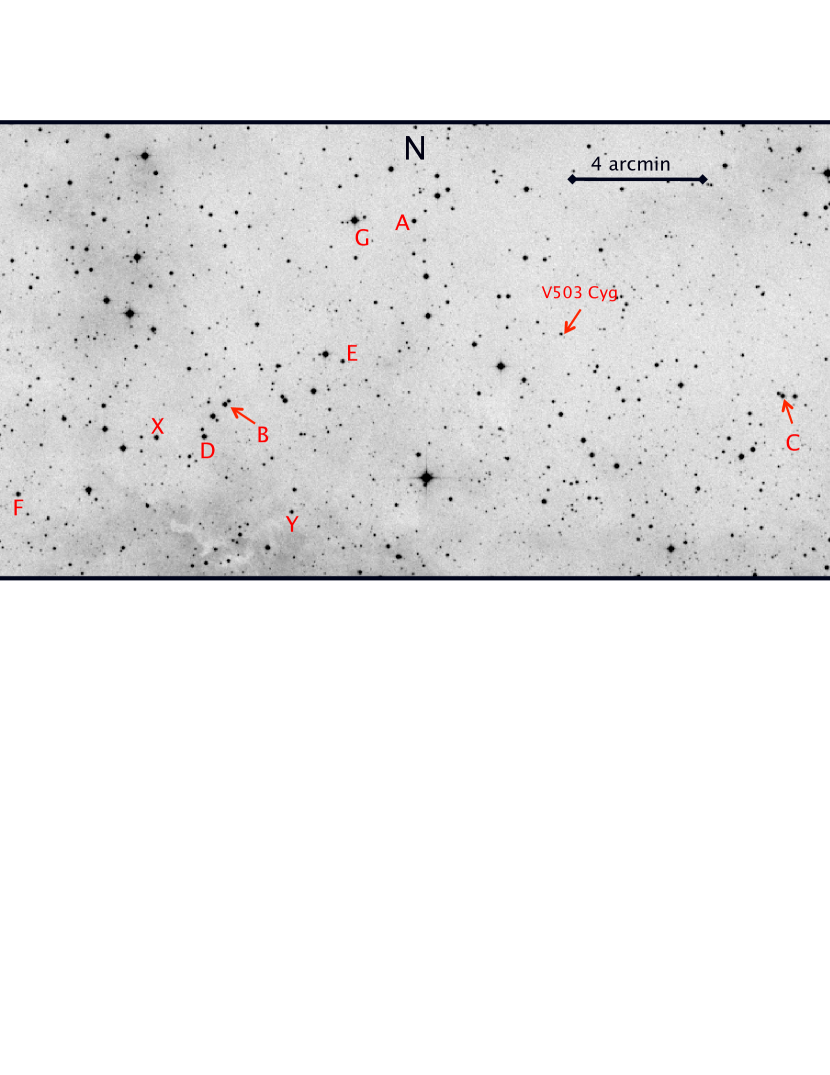
In July 2011, we obtained time-resolved photometry of a superoutburst of cataclysmic variable V503 Cygni with a 28-cm aperture Schmidt-Cassegrain telescope atop Jordan Hall on the University of Notre Dame campus. Seventeen nights of time-series data were taken using a commercial SBIG CCD camera and are listed in Table 1.
During data reduction, we noticed seven nearby field stars (stars A-G in Figure 1) that appeared to vary in brightness on a time scale of hours. Stars A, C, and E are Algol-type eclipsing binaries, and star F is a W UMa eclipsing binary. Star D exhibited short-term pulsations consistent with a very low-amplitude Delta Scuti type variable. Star G, a known Be star, showed quasi-periodic pulsations which photometry from SuperWASP (Street et al., 2004) subsequently confirmed.
The very red Star B showed weak, irregular variability. Star B corresponds to USNO-B1.0 1336-0379707 with R2=12.7 mag and a B2R2 color of 3.0 mag. Its position at 20:28:14.54, +43:39:25.6 is within 6 arcsec of HBH 4203-27 in the Hamburg-Bergedorf H emission line catalog (Kohoutek & Wehmeyer, 1999). The catalog notes that the H line of HBH 4203-27 is over-exposed on a strong continuum, but no further classification is given.
Additional unfiltered observations of Star B by Elena Pavlenko, Maksim Andreev, and Aleksej Sosnovskij at the Crimean Astrophysical Observatory in Ukraine also showed variation (Pavlenko, private communication). However, relative photometry of stars with extreme color differences can create the appearance of variability due to differential extinction with airmass. The suspected variability prompted us to obtain a spectrum of the star so that we could ascertain its nature.
2.2 Spectroscopy
We first obtained spectra of Star B using the same 28-cm Schmidt-Cassegrain telescope and CCD camera as for the photometry, but added a ‘Star Analyser’ (manufactured by Paton Hawksley Education Ltd.) 100-line-per-millimeter grism. The resulting spectrum has a dispersion of 23 Å/pixel. Spectra of Star B were obtained over the course of three nights starting 2011 July 31 (UT). The dispersion direction was rotated so that the target spectrum did not overlap any nearby stellar spectra or zero-order images. As an additional safeguard, we obtained a deep, unfiltered image of the field to compare with the summed spectrum to verify the absence of contamination from zero-order images of faint stars.
A spectrum of Lyrae was also taken and the positions of the Balmer absorption lines relative to the zero-order image were used to calibrate the wavelength as a function of pixel position and the spectrum provided the flux calibration.
The total integration time for the spectrum of Star B was 167 minutes. Even in 1-minute subexposures, strong emission lines at approximately 6560 Å and 7100 Å were clearly visible. The resulting spectrum is shown in Figure 2.
The He I line at 7064 Å appears in many emission line objects and could explain the detection of a strong line at 7100 Å, but this helium line is rarely comparable in strength to H at 6563 Å. Thus, we attributed the 7100 Å feature to N IV 7115 Å, indicative of a nitrogen-rich WR star. Stars with strong N IV emission often show several He II emission lines, making the feature at 5400 Å a good match to the 5411 Å He II line. Usually, the strongest He II line in the optical is at 4686 Å, but the combination of poor blue sensitivity and extremely red continuum resulted in a poor signal-to-noise ratio shortward of 5000 Å.

We then obtained a spectrum of the WR candidate using the 9.2-m Hobby-Eberly Telescope. Three short (120-second) exposures were taken and combined to avoid saturating the red end of the spectrum. The HET spectrum, which offered coverage from 4000 Å to just beyond 1m, confirmed the emission lines in our original data and revealed many more in both the blue and near-infrared portions of the star’s spectrum (see Figure 2). In particular, we identify a large number of He II emission lines with the strongest at 4686 Å and 10124 Å. Other lines and their identifications are given in Table 2. These firmly establish Star B as a Wolf-Rayet star of the WN class. Relying upon the WR nomenclature scheme set forth in van der Hucht (2001), we named the star WR 142b.
Once the nature of WR 142b was firmly established by the HET spectrum, we obtained Multi-Object Dual Spectrograph (MODS) data with Large Binocular Telescope (LBT). MODS has sensitivity well into the ultraviolet, which allowed us to search for a hot companion as well as any unusual properties of the WR star. Eight individual 120-second exposures were taken with the 400 line/mm blue grating on 2011 September 27 (UT). A 1.0-arcsecond wide slit was employed.
The bias was removed from the images and the data corrected for variations in the flat field. The individual images were combined before a one-dimensional spectrum was extracted. A line identified as N IV at 3478 Å was clearly detected, showing that the sensitivity of MODS extended shortward of 3500 Å.
3 Analysis
3.1 WR Classification
The strong N IV, rich He II spectrum, and overall lack of carbon emission clearly make this a WN-type WR (Figure 3). Subclassification of WN stars is multi-dimensional, based on the Smith, Shara, & Moffat (1996) system. The degree of ionization is parametrized by the He II 5411 to He I 5875 line ratio. The observed equivalent width ratio is 2.6 for WR 142b, placing it in the WN5 or WN6 class. The N V to N III ratio is very small, consistent with a WN6 or WN7 star. The LBT spectrum includes the N IV line at 4057 Å and its peak compared with the 4630 Å blend is consistent with a WN5 or WN6 classification. The C IV to He II 5411 ratio is 0.7 and C IV to He I is 2.0, both at the WN5/6 boundary. We conclude that WR 142b is best matched by a WN6 ionization classification.
The He II lines have widths of 24 Å (FWHM) before accounting for the instrumental resolution. This is within the range of normal line widths, so WR 142b should not be considered a broad-lined WR star.
Strong He II emission can hide the presence of hydrogen in the spectrum of WN stars because of the close coincidence of the Balmer lines with the many Pickering series lines of He II. Smith, Shara, & Moffat (1996) note that when hydrogen is present, H and H will increase the flux of the corresponding Pickering lines while leaving the other Pickering lines unperturbed. However, WR 142b shows a monotonically decreasing Pickering series, and we conclude that it does not have detectable hydrogen in its atmosphere.
3.2 Reddening by Dust
The very red color of WR 142b suggests a significant amount of dust extinction local to the WR star or along the line-of-sight. Emission line ratios (Conti & Morris, 1990) and the slope of the continuum (Morris et al., 1993) have been used to estimate the reddening of individual WR stars.
The predicted spectrum of hydrogen recombination from a low-density nebula is often compared with the observed emission to estimate extinction. In contrast, the physical processes of the atmospheres of helium-rich WR stars are complex and require detailed modelling to accurately predict the line strengths. Conti & Morris (1990) have used an empirical approach and found that the ratio between the strong UV He II line at 1640 Å is consistently a factor of 7.6 brighter than the optical 4686 Å line with only a 20% scatter in 30 WR stars. This is very close to the optically thin recombination ratio for these lines. Unfortunately, we have not observed the 1640 Å line, but we do have a measurement of the bright IR line at 1.012 m.
We have run the CLOUDY photoionization code (Ferland et al., 1998) with enhanced helium and over a range of temperatures and densities. We find that when the 1640 Å to 4686 Å flux ratio is 8, the 4686 Å to 10120 Å flux ratio is between 5 and 6. The observed flux ratio is 0.031, meaning the 4686 Å He II line is between 160 and 200 times fainter than predicted. For a Cardelli, Clayton, & Mathis (1989) dust law, this corresponds to a reddening of to 2.25 mag.


Morris et al. (1993) found that the continua of WN-type Wolf-Rayet stars between the ultraviolet (UV) and near-infrared (NIR) wavelengths are well matched by a power law with an index of . To create a continuum energy distribution (CED), we estimated the flux in regions of the HET spectra with no significant emission and we add the 2MASS NIR magnitude measurements (, , ) converted to flux. The optical and NIR fluxes were obtained at different times for this variable star, but the amplitude of the variation is small and should not dominate the error in the slope estimate. The CED was dereddened using the Cardelli, Clayton, & Mathis (1989) law until the slope was best fit by a power law with index . This slope is matched with a mag. The uncertainty in this extinction estimate comes directly from the range of power law indices in the observed sample of WR stars. This reddening estimate is more reliable than the line ratio technique, so we adopt a reddening of mag for WR 142b.
3.3 Companion?
Van der Hucht (2001) found that 39% of known WR stars harbor companions, usually of the OB type. The companions add absorption lines at blue wavelengths and can generate an UV bump in the continuum of the WR star. Our HET spectrum does not reach far enough into the blue to test for these effects, but we specifically obtained a LBT spectrum to search for evidence of a companion. The blue end of the LBT spectrum is shown in Figure 3. Narrow interstellar absorption features are present, but there is no sign of stellar absorption consistent with a companion, and the spectrum before continuum normalization does not display a strong bump from a hot companion. We find no evidence of a hot companion star to WR 142b.
3.4 Infrared Flux
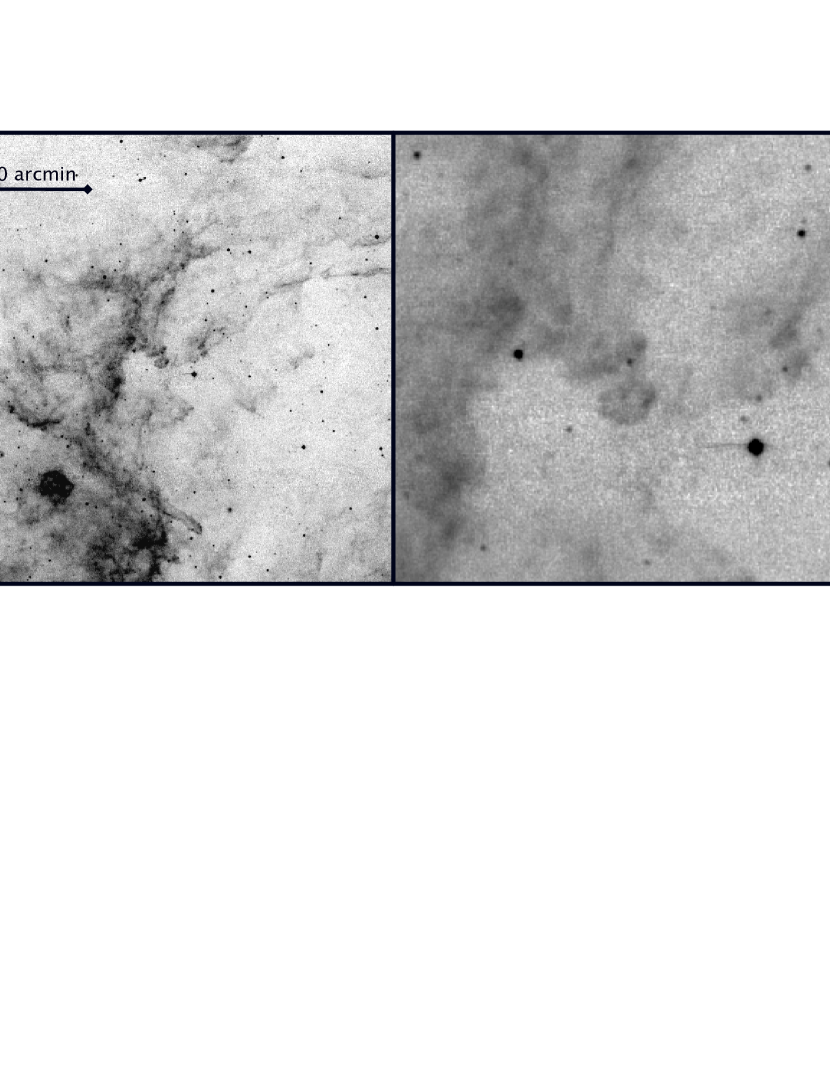
The Cygnus region was observed with the Midcourse Space Experiment (MSX) and the MSX6C point source catalog (Egan et al., 2003) lists a source within 0.6 arcsec of WR 142b. G081.5744+02.9135 has a measured flux of 0.346 Jy in band A (8.28 m) but is not detected in the longer-wavelength bands. The low density of IR point sources in the survey combined with the strong positional coincidence suggests that WR 142b is detected at 8.28 m. The MSX image of the field is shown in Figure 4 and a large amount of dust emission is evident toward WR 142b. In particular, a finger of dust emission extends over the star and may be the cause of the very high estimated extinction.
If we extrapolate the optical/near-IR flux after correcting for our estimated reddening, we predict a flux of 3.1 erg cm-2 s-1 Å-1 at 8.28 m. This is nearly a factor of two larger than the MSX-observed flux after a 0.16-mag extinction correction at 8 m is applied. But given the large extrapolation and variability of the star, the prediction is reasonably close.
If we fit a power-law slope to only the 2MASS magnitudes for WR 142b and extrapolate to 8.28 m, we predict to a flux of 1.74 erg cm-2 s-1 Å-1, which matches the observed MSX flux. The power-law index using only the NIR continuum is 3.2, which is slightly steeper than when the optical is included. These extrapolations imply no strong mid-IR emission from WR 142b beyond that from the stellar continuum. We conclude that there is no significant circumstellar dust emission from WR 142b and that the intense extinction is extrinsic to the star.
3.5 Variability
In a study of northern WR stars, Moffat and Shara (1986) found that at least half of the WRs in their survey display low-amplitude (often 5%) variability in optical wavelengths. As noted in the photometry section, WR 142b exhibited irregular, low-amplitude variation in our unfiltered observations. We subsequently reprocessed the photometry and used suitably red comparison and check star (stars X and Y in Table 1), selected by their colors. 111The check star is simply another comparison star which verifies that the primary comparison star is not variable. The weak variation seen in WR 142b remained present in many of the light curves, but its amplitude never exceeded 0.03 magnitudes.
Since the data were unfiltered, we were concerned that the observed variability might be an artifact caused by differential extinction. To minimize this effect, we obtained time-series photometry on three nights using an -band filter and red comparison and check stars. All of the filtered light curves show low-amplitude variability similar to that observed in the unfiltered data. The variability typically appears as a gradual brightening, followed by a slower fade, but no consistent period is apparent. Crucially, it is independent of airmass, and the check star never displays similar activity. Figure 5 presents a representative photometric time series.

WR 142b also shows night-to-night variability. The average -band magnitude of the star on six nights over a two-month span is given in Table 3. In particular, the infrared magnitude on 2011 September 12 (UT) was 0.08 mag higher than it had been two days earlier, and two days later, it had faded by 0.11 mag. The root-mean-squared (RMS) variation of WR 142b over the six nights was 0.040 mag while the check star, which was four times fainter, varied by only 0.009 mag. We conclude that the weak variability suspected in the unfiltered data is confirmed with the better-controlled -band photometry.
4 Conclusion
We have serendipitously discovered a Wolf-Rayet star, WR 142b, by first detecting its photometric variability and then obtaining spectroscopy. A HET spectrum shows emission lines of He I, He II, N IV and C IV. After examining the strengths of WR 142b spectral lines, we find that it is best classified as a WN6 with no detectable hydrogen and normal line widths. The spectrum shows good evidence for a significant reddening due to dust. We estimate the reddening is between and 2.6 mag and most likely toward the higher value. For a standard dust law the star is dimmed by 8 mag in the band and would have a visual brightness of mag with no extinction. However, the total-to-selective extinction ratio can vary for strongly extincted WR stars (Turner, 2011) and could be as high as 4, making WR 142b a naked-eye object if not for the dust. We do not detect a hot companion despite obtaining LBT spectra sensitive down to 3400 Å.
References
- Borne et al. (2008) Borne, K., Becla, J., Davidson, I., Szalay, A., & Tyson, J. A. 2008, American Institute of Physics Conference Series, 1082, 347
- Cardelli, Clayton, & Mathis (1989) Cardelli, J. A., Clayton G. C., & Mathis, J. S. 1989, ApJ, 345, 245
- Conti (1976) Conti, P. 1976, MSRSL 9, 193C
- Conti & Morris (1990) Conti, P. S. & Morris, P. W. 1990, AJ, 99, 898
- Crowther (2007) Crowther, P. 2007, Annu. Rev. Astron. Astrophys. 45, 177
- Egan et al. (2003) Egan, M. P., et al. 2003, Air Force Research Lab Technical Report AFRL-VS-TR-2003-1589
- Ferland et al. (1998) Ferland, G. J., Korista, K. T., Verner, D. A., et al. 1998, PASP, 110, 761
- Kohoutek & Wehmeyer (1999) Kohoutek, L., Wehmeyer, R. 1999, Astron. Astrophys. Supple. Ser. 134, 255
- Lamers et al. (1991) Lamers et al. 1991, ApJ 368, 538L
- van der Hucht (2001) van der Hucht K.A. 2001, New Astron. Rev. 45, 135
- Morris et al. (1993) Morris, P. W., et al. 1993, ApJ, 412, 324
- Ralchenko et al. (2011) Ralchenko, Yu., , Kramida, A.E., Reader, J., and NIST ASD Team 2011, NIST Atomic Spectra Database (ver. 4.1.0)
- Roman-Lopes (2011) Roman-Lopes, A. 2010, MNRAS, 416, 501
- Smartt (2009) Smartt, S. 2009, Annu. Rev. Astron. Astrophys. 47, 63
- Smith, Shara, & Moffat (1996) Smith, L. F., Shara, M. M., & Moffat, A. F. 1996, MNRAS, 281, 163
- Street et al. (2004) Street, R. A., et al. 2004, AN, 325, 565
- Turner (2011) Turner, D. G. 2011, arXiv:1108.3567
- Wachter et al. (2010) Wachter, S., et al. 2010, AJ, 139, 2330
- Wolf & Rayet (1867) Wolf, C.J., & Rayet, G. 1867, Comptes Rendus Acad. Sci., 65, 292
| UT Date | UT Start | UT End | Filter |
|---|---|---|---|
| (2011) | (hours) | (hours) | |
| Jul 05 | 3.85 | 8.92 | clear |
| Jul 08 | 5.02 | 8.59 | clear |
| Jul 12 | 4.46 | 7.88 | clear |
| Jul 14 | 5.38 | 9.43 | clear |
| Jul 16 | 2.65 | 8.16 | clear |
| Jul 17 | 2.57 | 5.12 | clear |
| Jul 20 | 2.38 | 6.29 | clear |
| Jul 21 | 4.21 | 9.12 | clear |
| Jul 25 | 2.58 | 7.68 | clear |
| Jul 27 | 2.53 | 5.32 | clear |
| Jul 30 | 2.84 | 9.16 | clear |
| Jul 31 | 2.19 | 4.07 | clear |
| Aug 01 | 2.04 | 8.25 | clear |
| Aug 02 | 2.74 | 4.65 | clear |
| Aug 05 | 2.46 | 8.23 | -band |
| Sep 12 | 4.92 | 8.81 | -band |
| Sep 18 | 2.36 | 8.98 | -band |
| Observed | Equ. Width | Flux | ID | Rest |
|---|---|---|---|---|
| Wavelength (Å) | (Å) | ( erg/cm2/s) | Wavelength (Å) | |
| 3478.6 | 19.2 | 0.12 | N IV | 3478 |
| 3887.7 | 5.3 | 0.10 | He I | 3888 |
| 3970.0 | 4.1 | 0.09 | He II | 3968 |
| 4025.8 | 3.8 | 0.10 | He II | 4025 |
| 4056.0 | 20.0 | 0.59 | N IV | 4058 |
| 4098.5 | 26.9 | 0.90 | N III+He II | Blend |
| 4199.7 | 9.8 | 0.40 | N III+He II | Blend |
| 4341.8 | 9.6 | 0.68 | He II | 4339 |
| 4516.2 | 6.1 | 0.56 | N III | Blend |
| 4543.1 | 14.8 | 1.5 | He II | 4542 |
| 4605.2 | 5.1 | 0.55 | N V | Blend |
| 4637.0 | 25.8 | 3.3 | N III | Blend |
| 4687.6 | 120 | 16.6 | He II | 4686 |
| 4861.3 | 19.7 | 2.8 | He II | 4859.3 |
| 4943.0 | 2.7 | 0.47 | N V | 4940 |
| 5201.2 | 1.9 | 0.45 | N IVaaPossible identification based on Ralchenko et al. (2011) | 5204 |
| 5412.6 | 31.4 | 11.1 | He II | 5411 |
| 5804.1 | 23.5 | 12.8 | C IV | 5808 |
| 5875.0 | 11.9 | 6.6 | He I | 5875 |
| 5931.6 | 0.28 | 0.17 | He II (Pf25) | 5932 |
| 5955.7 | 0.22 | 0.14 | He II (Pf24) | 5953 |
| 5979.6 | 0.21 | 0.13 | He II (Pf23) | 5977 |
| 6004.3 | 0.27 | 0.18 | He II (Pf22) | 6004 |
| 6037.9 | 0.76 | 0.51 | He II (Pf21) | 6037 |
| 6075.7 | 1.1 | 0.78 | He II (Pf20) | 6074 |
| 6119.7 | 1.6 | 1.2 | He II (Pf19) | 6118 |
| 6171.7 | 1.3 | 0.92 | He II (Pf18) | 6171 |
| 6234.6 | 5.4 | 3.8 | He II (Pf17) | Blend |
| 6313.2 | 3.5 | 2.8 | He II (Pf15 | 6312 |
| 6380.4 | 2.5 | 2.1 | ? | … |
| 6406.9 | 7.0 | 6.1 | He II (Pf15) | 6406 |
| 6561.2 | 67.7 | 65.7 | He II | 6560 |
| 6665.2 | 2.7 | 2.8 | He I | Blend |
| 6684.6 | 14.9 | 16.6 | He II (Pf13) | 6683 |
| 6893.2 | 13.0 | 17.2 | He II (Pf12) | 6890 |
| 7062.5 | 12.8 | 19.2 | He I | 7064 |
| 7114.7 | 97.9 | 147 | N IV | 7110 |
| 7180.1 | 15.1 | 20.6 | He II (Pf11) | 7178 |
| 7596.5 | 22.3 | 44.2 | He II (Pf10) | 7593 |
| 8240.3 | 27.1 | 71.5 | He II (Pf9) | 8237 |
| 9348.3 | 11.8 | 31.8 | He II (Pf8) | 9345 |
| 10122 | 118.2 | 527 | He II | 10120 |
| UT Date | Julian Day | Average a | Check Star a |
|---|---|---|---|
| (2011) | (+2455000) | (mag) | (mag) |
| Jul 10 | 752.8113 | ||
| Aug 05 | 778.7229 | ||
| Sep 12 | 816.7735 | ||
| Sep 14 | 818.6175 | ||
| Sep 16 | 820.6495 | ||
| Sep 18 | 822.7304 | ||
| Sep 22 | 826.6625 | ||
| MeanRMS | 10.999 | 12.684 |