Thermoelectric properties of Ba-Cu-Si clathrates
Abstract
Thermoelectric properties of the type-I clathrates Ba8CuxSi46-x (, = nominal Cu content) are investigated both experimentally and theoretically. The polycrystalline samples are prepared either by melting, ball milling and hot pressing or by melt spinning, hand milling and hot pressing techniques. Temperature-dependent electrical resistivity, , and the Seebeck coefficient, , measurements reveal metal-like behavior for all samples. For and , density functional theory calculations are performed for deriving the enthalpy of formation and the electronic structure which is exploited for the calculation of Seebeck coefficients and conductivity within Boltzmann’s transport theory. For simulating the properties of doped clathrates the rigid band model is applied. On the basis of the density functional theory results the experimentally observed compositional dependence of and of the whole sample series is analyzed. The highest dimensionless thermoelectric figure of merit of 0.28 is reached for a melt-spun sample at C. The relatively low values in this system are attributed to the too high charge carrier concentrations.
pacs:
72.20.Pa, 72.15.Eb, 71.20.-b, 61.05.-aI Introduction
Intermetallic clathrates have been investigated extensively in recent years as
promising thermoelectric materials Slack (1995). They crystallize in several
structure types Rogl (2006), of which the type I clathrates A8E46 (A =
alkali, alkaline earth, or rare earth element, E = group IV element) have
hitherto shown the best thermoelectric performance. The unique features of the
clathrate crystal structure are generally regarded as ideal realization of the
phonon glass – electron crystal (PGEC) concept Slack (1995). Clathrates are
viewed as Zintl compounds Kauzlarich et al. (2007); Toberer et al. (2010): the covalently bonded
framework atoms (E) use the valence electrons of the guest atoms (A) to satisfy
the octet rule and to acquire closed-shell electronic configurations. Simple
electron counting based on the Zintl concept Zintl (1939) frequently works
well Kauzlarich (1996); Sevov (2002); Kauzlarich et al. (2007); Toberer et al. (2010) for understanding the
thermoelectric properties of clathrates. Previously, most investigations focused
on clathrates with heavy framework atoms (e.g., Ge- or Sn-based clathrates)
which typically are partially substituted by other heavy elements (e.g., Ga, In,
or transition metal elements). Comparably little work has been done on Si-based
clathrates Melnychenko-Koblyuk et al. (2008); Nasir et al. (2009); Condron et al. (2005, 2006, 2008); Jaussaud et al. (2005); Mugita et al. (2011); Tsujii et al. (2011), despite
the technological interest in this low-cost element. Early interest in
Si-based clathrates was triggered by the discovery of superconductivity in
Na2Ba6Si46 with a critical temperature K
(Ref. Kawaji et al., 1995). Later on, investigations on
Ba8TMxSi46-x (TM: transition metal element, TM = Cu, Ag, Au)
Herrmann et al. (1998); Yamanaka et al. (2000); Teraoka et al. (2004); Fukuoka et al. (2004); Yang et al. (2005) demonstrated the
stabilization of the crystal structure by TM substitution, allowing for a simple
synthesis in an arc furnace. However, this led to a suppression of
which, from band structure calculations, could be attributed to a change of the
density of states near the Fermi level Kamakura et al. (2005); Tse et al. (2005); Li et al. (2005). Interest
in the thermoelectric properties of TM-containing clathrates also arose from
band structure calculations which indicated that Ba8{Cu,Ag,Au}6Si40
clathrates are degenerate -type semiconductors with large Seebeck
coefficients at room temperature Akai et al. (2004, 2005); Tse et al. (2005). This
motivated us to investigate the thermoelectric properties of
Ba8CuxSi46-x in detail.
Recently, we investigated the phase equilibrium of clathrates in the Ba–Cu–Si system at
and its crystal structure X.Yan et al. (2010).
On the other hand, first-principles methods have made considerable successes in studies of structural and
electronic properties of materials.
Moreover, the Boltzmann transport theory has been extensively applied to investigate
electronic transport properties such as electrical conductivity and Seebeck coefficient.
A method that hybridize the first-principle methods and Boltzmann theory would no doubt benefit
understanding of thermoelectric properties of materials,
which has proved to be quite successful in our recent workZeiringer et al. (2011).
In this paper, we present a comprehensive study on the thermoelectric properties of
Ba8CuxSi46-x (, = nominal Cu
content) in combination with density functional theory
(DFT) calculations and the semi-classic Boltzmann transport equations.
II Experimental
II.1 Sample preparation and characterization
A series of clathrates, with the nominal compositions Ba8CuxSi46-x (, 3.8, 4.2, 4.4, 4.6, 5, 6, 7, denoted by HP01-HP08), was prepared in a high-frequency induction furnace from high-purity elements (more than 99.9 mass%), as described previously X.Yan et al. (2010). The samples were subsequently annealed (C, 15 days), ball milled and hot pressed (C, MPa, time = 2 hours). A sample with was chosen for melt spinning Pat ; Paschena et al. (2008) with wheel speeds of 1500 r/min and 2500 r/min (samples MS1500 and MS2500).
X-ray powder diffraction (XPD) data for all samples were collected using a Siemens D5000 diffractometer (Cu Kα1,2, ) and processed with the Rietveld method using the program FULLPROF Rodr guez-Carvajal (1990). The crystallite size of hot pressed samples was evaluated from the X-ray diffraction patterns using the MDI jade 5.0 software (Materials Data Inc., Liverpool, CA). Annealed (, 1 day) pure Si powder was used for the evaluation of the peak broadening due to the X-ray instrument. The bulk density of the hot pressed samples was measured by the Archimedes method.
The compositions of the hot pressed samples were determined by energy dispersive X-ray spectroscopy (EDX) in a scanning electron microscope (SEM) operated at 20 kV (Philips XL30 ESEM; JEOL JSM-T330A, probe size: 1m).
II.2 Physical properties
The electrical resistivity and the Seebeck coefficient were measured with a ZEM-3 (ULVAC-Riko, Japan). The thermal conductivity was calculated from the thermal diffusivity , measured by a laser flash method with a Flashline-3000 (ANTER, USA), the specific heat and the bulk density using the relation . Hall effect measurements were performed with a standard ac technique in a physical property measurement system (PPMS, Quantum Design) in the temperature range from 2 to 300 K in magnetic fields up to 9 T.
II.3 Computational details
Density functional theory (DFT) calculations were carried out by the Vienna ab initio Simulation Package (VASP) Kresse and Furthmüller (1996a, b). The exchange-correlation functional is approximated within the generalised gradient approximation using the parametrization of Perdew, Burke, and Ernzerhof (PBE). The electron-ion interaction is treated within the framework of Blöchls projector augmented wave method Blöchl (1994); Kresse and Joubert (1999). The valence state configurations for the construction of the pseudopotentials included states for Ba, states for Cu, and states for Si. For all calculations a point grid according to Monkhorst and Pack Monkhorst and Pack (1976) was used to sample the Brillouin zone.
Transport properties for the electrons were modeled within the semi-classical Boltzmann transport theory in which the Seebeck coefficient tensor () and electrical resistivity () are defined as
| (1) |
| (2) |
Here is related to electronic structures by
| (3) | |||||
The vectors represent the velocities of the electrons as defined by the derivative of the band energy. , and are the relaxation time, the Fermi function, and the Fermi energy, respectively. Within Boltzmann s transport theory effects of electron-electron and electron-phonon scattering are merged into the relaxation time . Because a first-principles calculation of is not feasible for systems with large numbers of atoms per unit cell, was considered as an empirical parameter by fitting to one selected experimental value at a given temperature, as described below.
It should be noted that the cubic symmetry of Ba8Si40 is maintained for Ba8Cu6Si40 but broken when modeling Ba8Cu5Si41. Therefore, the Seebeck tensor has now unequal components. Because the experimental samples were produced at higher temperatures the measured structures are always cubic with some random site occupations. In order to enable the comparison with experiment the symmetry average of the calculated Seebeck and conductivity tensor is made, resulting in only one component for each physical property. Concerning the transport properties of Ba8Cu5Si41 two sets of calculations have been made, namely for a geometrically fully relaxed structure and for a structure denoted as frozen-Ba8Cu5Si41, for which the high-symmetry structure of Ba8Cu6Si40 was chosen and no relaxation was allowed. The actual calculations of the transport properties were made by an adapted version of the package BoltzTrap Madsen and Singh (2006). For this purpose the Kohn-Sham energy eigenvalues were generated on a very dense -point grid.
III Results and discussion
III.1 Sample purity in the hot pressed samples and structural details of clathrates
The phase constitutions of all hot pressed samples agree well with the isothermal section of the system Ba–Cu–Si at (the homogeneity range of the clathrate at : , Ref. X.Yan et al., 2010), except for a very small amount of Si (and/or of holes) that is uniformly dispersed in the main clathrate phase (even for the samples with ). The compositions from EDX measurements are close to the nominal compositions for the samples HP01-HP05 which correspond to the single phase range of clathrate in the phase diagram. For the samples HP06-HP08, a composition of Ba8.1Cu4.9Si41.0 is determined. Table 1 summarizes the nominal Cu content, the Cu contents determined from EDX and from the XRD refinements, as well as the crystallite sizes and densities of all specimens.
| Name | (%) | (nm) | |||
|---|---|---|---|---|---|
| HP01 | 3.5 | 3.61 | |||
| HP02 | 3.7 | 3.85 | |||
| HP03 | 4.2 | 4.29 | |||
| HP04 | 4.3 | 4.38 | |||
| HP05 | 4.5 | 4.55 | |||
| HP06 | 4.9 | 4.72 | |||
| HP07 | 4.9 | 4.88 | |||
| HP08 | 4.9 | 4.98 | |||
| MS1500 | 4.8 | 4.84 | 90.4 | ||
| MS2500 | 4.8 | 4.82 | 88.1 |
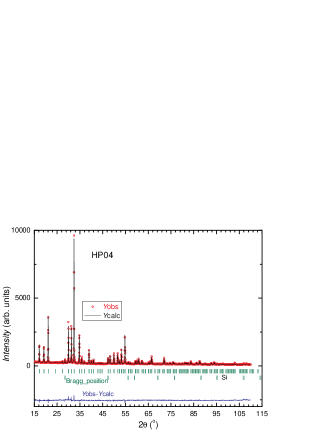
Rietveld refinements of the X-ray diffraction data were performed with an initial model derived from the single crystal X-ray diffraction data of Ba8Cu5Si41 (Ref. X.Yan et al., 2010). Here, Ba atoms fully occupy the and sites in the crystal structure of the type-I clathrate, Cu atoms share the site with Si, and the remaining sites are occupied by Si atoms. For this model the Rietveld refinements of the data for all samples have high reliabilities and yield reasonable structure parameters (see Table 2). Unlike for the case of several Ge-based TM clathrates Melnychenko-Koblyuk et al. (2008, 2009); Nguyen et al. (2010); Melnychenko-Koblyuk et al. (2007a, b, c); Prokofiev et al. (2009); Koza et al. (2010); Zhang et al. (2011), here no vacancy could be identified at the site within experimental resolution. Figure 1 shows the Rietveld refinement for the sample HP04 as an example.
| Name | HP01 | HP02 | HP03 | HP04 |
|---|---|---|---|---|
| 3.61 | 3.85 | 4.29 | 4.38 | |
| (nm), Guinier | 1.03272(3) | 1.03273(5) | 1.03278(3) | 1.03277(6) |
| 0.105 | 0.122 | 0.082 | 0.075 | |
| 0.085 | 0.081 | 0.073 | 0.060 | |
| Ba1, in () () 102(nm2) | 0.41(9) | 0.62(9) | 0.47(9) | 0.41(7) |
| Ba2, in () () 102(nm2) | 1.71(9) | 1.72(9) | 1.63(8) | 1.57(5) |
| M1, in (), Occ. | 3.61(7)Cu+2.39Si | 3.85(6)Cu+2.15Si | 4.29(6)Cu+1.71Si | 4.38(5)Cu+1.62Si |
| () 102(nm2) | 0.32(8) | 0.43(9) | 0.42(9) | 0.53(9) |
| Si1 in (), | 0.1855(3) | 0.1854(3) | 0.1852(3) | 0.1851(2) |
| () 102(nm2) | 0.54(7) | 0.85(9) | 0.59(9) | 0.66(9) |
| Si2 in (), | 0.1198(5), 0.3077(5) | 0.1188(4), 0.3091(5) | 0.1189(4), 0.3098(5) | 0.1192(3), 0.3094(3) |
| () 102(nm2) | 0.43(9) | 0.25(7) | 0.43(9) | 0.27(9) |
| Name | HP05 | HP06 | HP07 | HP08 |
|---|---|---|---|---|
| 4.55 | 4.72 | 4.88 | 4.98 | |
| (nm), Guinier | 1.03280(3) | 1.03286(4) | 1.03285(5) | 1.03287(4) |
| 0.107 | 0.088 | 0.083 | 0.088 | |
| 0.086 | 0.071 | 0.071 | 0.065 | |
| Ba1, in () () 102(nm2) | 0.49(7) | 0.41(9) | 0.38(9) | 0.40(9) |
| Ba2, in () () 102(nm2) | 1.63(6) | 1.55(9) | 1.52(7) | 1.63(8) |
| M1, in (), Occ. | 4.55(5)Cu+1.45Si | 4.72(7)Cu+1.28Si | 4.88(6)Cu+1.12Si | 4.98(5)Cu+1.02Si |
| () 102(nm2) | 0.65(9) | 0.68(8) | 0.43(9) | 0.86(9) |
| Si1 in (), | 0.1842(2) | 0.1849(3) | 0.1848(3) | 0.1849(3) |
| () 102(nm2) | 0.68(9) | 0.62(9) | 0.65(9) | 0.68(9) |
| Si2 in (), | 0.1203(3), 0.3096(2) | 0.1190(5), 0.3093(5) | 0.1200(4), 0.3095(4) | 0.1195(3), 0.3092(3) |
| () 102(nm2) | 0.40(9) | 0.52(9) | 0.28(7) | 0.39(9) |
III.2 Thermoelectric properties
III.2.1 Hot pressed Ba8CuxSi46-x samples
The temperature dependent electrical resistivity, , and Seebeck coefficient, , of the hot pressed samples show a systematic evolution with the Cu content (Fig. 2). All samples show metal-like behavior. The negative values indicate that electrons dominate the transport properties. In the Cu-rich samples (HP06–HP08), extrema are observed in and .
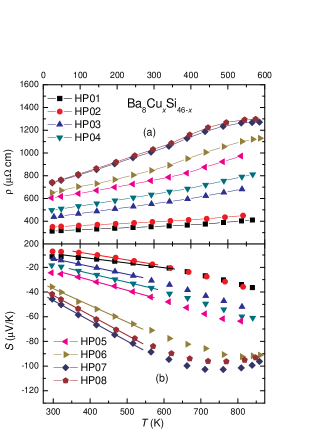
The overall variation of and with Cu content can be qualitatively understood within a phenomenological picture of the electronic band structure of TM containing clathrates Tse et al. (2005). In all samples, the Fermi level lies within the conduction band. This explains the metal-like behavior of and the negative values. With increasing , the Fermi level moves towards the edge of the conduction band. Thereby, the charge carrier concentration decreases and, consequently, the absolute values of and increase.
According to band structure calculations for a fully ordered structure, Ba8Cu6Si40 should be a -type semiconductor (see Sect. III.3 and Refs. Akai et al., 2004, 2005). The fact that only -type behavior is found in our sample series is attributed to the formation of competing phases when exceeds . This inhibits a further energetical lowering of the Fermi level down to the valence band. The energy gap is predicted to decrease with increasing Cu content (see Sect. III.3 and Refs. Akai et al., 2004, 2005). This is in agreement with the observed maxima in and for the Cu-rich samples HP06-08, which signal the onset of intrinsic conduction above about C.
To a first approximation, for temperatures above the Debey temperature (C for Ba8Cu5Si41, Ref. Yan et al., 2011), and ignoring the phonon-drag contribution to the total Seebeck coefficient Cutler et al. (1964), should vary linearly with temperature as Blatt (1964)
| (4) |
where is the charge carrier concentration, is the free-electron mass, is its charge and the other symbols have their usual meaning. Thus, one should be able to estimate from the slopes of linear fits to . These fits are shown as straight lines in Fig. 2. For high Cu contents, these fits describe the data quite well in relatively broad temperature ranges. For low Cu contents, the agreement is poorer. As will be shown below, this can be attributed to a temperature dependent charge carrier concentration.
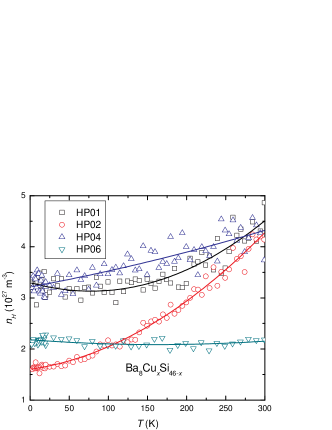
For the samples HP01, HP02, HP04 and HP06 we have also determined the charge carrier concentrations more directly, by measurements of the Hall coefficient below 300 K. The charge carrier concentrations calculated using a simple one-band model , are plotted against temperature in Fig. 3. For HP06, is almost temperature independent. For the Cu-poor samples, on the other hand, shows a sizable temperature dependence.
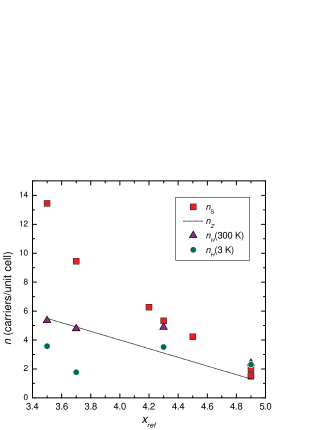
Finally, we can derive the charge carrier concentration expected within a simple Zintl electron counting scheme. For Ba8CuxSi41-x, the charge carrier concentration per unit cell, , varies with as , if the oxidation states +2, -3, and 0 are assumed for Ba, Cu and SiLi et al. (2005), respectively. A comparison of the charge carrier concentration determined via all above methods is shown in Fig. 4.
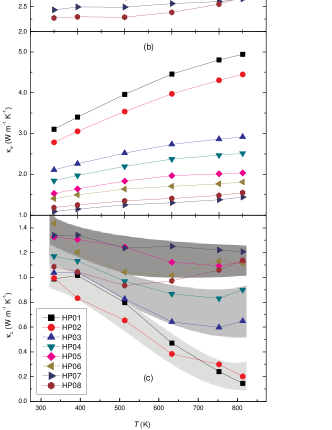
The temperature dependent thermal conductivity, , varies systematically with , as shown in Fig. 5(a). In Fig. 5(b) and (c), we plot the temperature dependent electronic component and the lattice component , respectively. is estimated via the Wiedemann-Franz law , where (V/K)2, from the electrical resistivity . is the difference between and . The dominating contribution to changes from to with increasing Cu content, with almost half to half contributions for the samples HP05 to HP08. For three different characteristics can be distinguished beyon the experimental uncertainties, as indicated by the gray shaddows shown in Fig. 5(c).
The Cu-poor samples have the strongest temperature dependence and the lowest values. With increasing and thus decreasing charge carrier concentration (at elevated temperatures), this dependence becomes more gradual and rises. This trend cannot result from point scattering or boundary scattering since the crystallite size and bulk density do not vary systematically with (Table 1). Instead suggest that, besides phonon-phonon scattering that usually is the dominating scattering at high temperature Peierls (1929), here also electron-phonon scattering contributes sizably. An alternative explanation for the experimentally observed trend could be that the presence of more atoms Cu disturbs the resonant scattering of the guest atoms in the large cage.
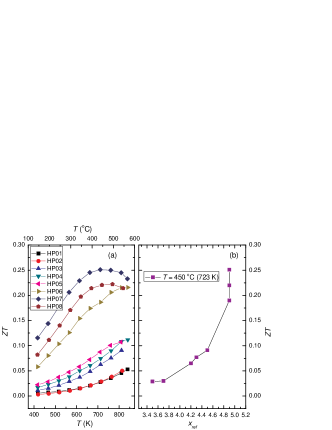
The dimensionless thermoelectric figure of merit is plotted against temperature in Fig. 6(a). depends sensitively on , especially for the Cu-rich side (Fig. 6). Surprisingly, the samples HP06–HP08 with highest and a small amount of foreign phases show the highest values in the investigated temperature range. The highest of 0.25 is reached for sample HP07 at about C. Between 350 to C, remains above 0.23.
III.2.2 Melt-spun
In order to further optimize of the clathrates in the Ba–Cu–Si system, we melt-spun an as cast sample of Ba8Cu6Si40 with two different Cu wheel speeds, 1500 and 2500 r/min. The resulting ribbons were hand milled rather than ball milled to retain the microstructure of the ribbons to the largest possible extent, and then hot pressed. These samples are denoted by MS1500 and MS2500. Figure 7 shows , , and of MS1500 and MS2500, together with the corresponding data for the conventionally prepared sample HP07 of the same nominal composition. While the sample HP07 reaches the largest absolute values in the measured temperature range, of the melt-spun samples is still increasing the temperature. The sample MS2500 has the lowest in the measured temperature but also here a maximum in appears to be reached at lower temperatures for HP07 than for the melt-spun samples. MS1500 shows the lowest . Above C, MS1500 has the highest value.
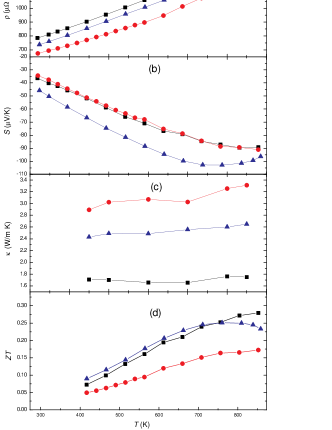
As seen from Fig. 7(b), is very similar for MS1500 and MS2500. This indicates that also the charge carrier concentrations are comparable: the values m-3 for MS2500 and m-3 for MS1500 are derived from linear fits to using Eqn. 4 as done above. Hall effect measurements also yield similar within the above used one-band model: m-3 for MS2500 and m-3 for MS1500. The more pronounced differences between MS2500 and MS1500 in and must therefore be attributed to the different charge carrier mobilities , which are 2.4 and 3.5 cm2/Vs at 300 K for MS1500 and MS2500, respectively. We attribute that to a smaller average grain size in MS1500 than in MS2500.
III.3 DFT results
III.3.1 Structure and energetics
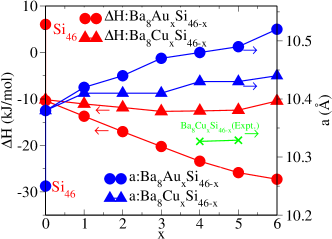
The lattice parameters for the cubic type I clathrate structure are derived from fully relaxed VASP calculations, from which also the enthalpies of formation in terms of differences of total energies at zero pressure are derived. We compare our calculations on Ba8CuxSi46-x with a recent study on the type I clathrate Ba8AuxSi46-x. Figure 8 shows formation enthalpies and lattice parameters for four types of systems , namely Si46, Ba8Si46, Ba8CuxSi46-x and Ba8AuxSi46-x with to 6. From the measured X-ray data it was concluded that the Cu atoms are randomly distributed on Si sites due to the preparation at elevated temperatures. However, for the DFT calculations the doping atoms have to be placed on specific sites within the unit cell which, in general, causes changes of lattice symmetry and cell shape. Therefore, to be consistent with experiment a cubic unit cell was enforced for all calculations. More details are given in Refs Zeiringer et al., 2011. Comparing to the two experimental data points for the lattice parameter in Fig. 8, one finds that the DFT derived values are larger by about 1%, but show the same trend of increasing with increasing . The (rather small) difference between first principles theory and experiment is attributed to the approximation for the exchange correlation functional. For the Au-doped compounds the enthalpy of formation decreases (i.e. bonding is enhanced) with increasing Au content, which is very similar to the results for Ba8AgxGe46-x Zeiringer et al. (2011). The trend for the Cu-doped compounds is quite different, because remains rather constant with increasing . A more careful examination reveals that slightly increases for implying that a doping level exceeding 5 is unfavorable. This is consistent with the experimental fact that no compound can be stabilized for such large dopings.
III.3.2 Electronic properties
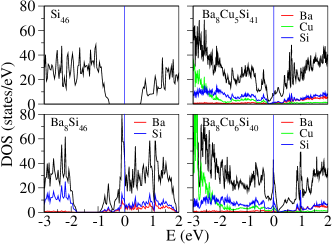
The electronic densities of states for Ba8CuxSi46-x are shown in Fig. 9. Significant changes induced by doping Cu are observed. On filling Ba into the voids of the Si46 cage the gap is maintained but shrinks in size due to hybridization between Ba and Si states. The gap decreases significantly by adding Cu, which implies hybridization between dopants and the Si framework. For Ba8Cu5Si41 there are two peaks in the DOS around the Fermi energy, which is located at a satellite of the higher energy peak. Doping of Cu up to 6 atoms lowers the higher energy peak in Ba8Cu6Si40 in magnitude and moves the Fermi energy to the center of the peak at lower energy. The small difference in the shape of the DOS peaks between these two compounds may be due to their different crystal symmetries. However, there is also a significant similarity between Ba8Cu5Si41 and Ba8Cu6Si40 in that the peaks around the Fermi energy remain almost unchanged and also the pseudogap occurs for both of them. The similarity of the DOS features justifies the rigid band approximation when varying the atomic composition in terms of changing the number of valence electrons by shifting the Fermi energy. For the validity of the rigid band model the change of the number of valence electrons must be sufficiently small.
The location of the Fermi level plays an important role in understanding transport properties as discussed later. In our recent work within the rigid band approximation Zeiringer et al. (2011), based on the semiconducting parent compounds of Ge46 a simple electron counting rule was proposed: ( is the valency of the dopant) is replaced the Fermi energy in the gap for Ba8MxGe46-x . This counting rule can also be applied to Ba8MxSi46-x because of the similarity of Si and Ge. For M = Cu (i.e. the valency equals 1) = 16/3 is derived, which corresponds very well to experimental concentrations at which the Seebeck coefficient undergoes a drastic change in size.
III.3.3 Transport properties
For small variations of the dopant concentration (i.e. variation of the number of valence electrons) the rigid band approximation was employed according to
| (5) |
for calculating the chemical potential (i.e. the Fermi energy) for electrons. The number represents the number of valence electrons of the chosen reference compound with its DOS, . In the Ba–Cu–Si clathrates, Ba, Cu and Si contribute 2, 1 and 4 valence electrons to the system, respectively. For comparing the calculations with measurements on the most interesting experimental sample with composition Ba8Cu4.9Si41.1, if Ba8Cu5Si41 is chosen as the reference and = 3.3 if Ba8Cu6Si40 is the reference.
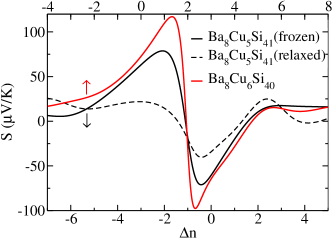
Figure 10 depicts the calculated Seebeck coefficients at 300 K vs. chemical doping for relaxed- and frozen-Ba8Cu5Si41 and Ba8Cu6Si40, which change sign as the Fermi level crosses the gap. There is a significant difference in the amplitudes of the Seebeck coefficient between the relaxed and frozen structures of Ba8Cu5Si41 revealing the influence of structural relaxation. The Seebeck coefficient of frozen-Ba8Cu5Si41 resembles quite well that of Ba8Cu6Si40, indicating that the rigid band approximation should be useful when varying between 5 and 6. Both curves agree very well with each other except for the absolute values nearby the gap. However, the Seebeck coefficients are significantly different for the fully relaxed structures. This is different from the comparison of Seebeck coefficients of Ba8Ag5Si41 and Ba8Ag6Si40 with their fully relaxed structures, because these practically coincide. Zeiringer et al. (2011)

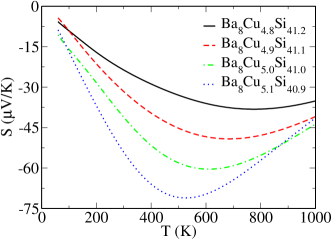
Figures 11 and 12 depict the calculated temperature-dependent Seebeck coefficients for Ba8CuxSi46-x, which are obviously very sensitive to doping. For comparison, for Ba8Cu5.4Si40.6 was also calculated by taking Ba8Cu6Si40 as the reference. Although for Ba8Cu5.4Si40.6 as derived from the different references are qualitatively similar, there are significant differences concerning the magnitude and the position of the maximum. This suggests that care has to be taken for selecting the reference compound. Apparently, at low temperatures changes sign when the Cu concentration crosses the critical value of = 5.33. The change of sign for Ba8CuxSi46-x can be understood in terms of the Mott’s formula, which is a simplification valid at very low temperatures. There, the sign and magnitude of the Seebeck coefficient are determined by the DOS and its derivative with respect to energy at the Fermi energy , , which results in an opposite sign for the Seebeck coefficient and the slope of the DOS at . According to Mott a small together with a large gives rise to a large Seebeck coefficient, and therefore the Fermi energy should be as close as possible to the gap. This consideration is, however, only valid at sufficiently low temperatures. As temperature increases, the Fermi energy moves towards or away from the gap, thus changing .
From Fig. 9 one derives a positive derivative for Ba8Cu5Si41 thus producing a negative Seebeck coefficient. For compositions close to Ba8Cu5Si41, for instance Ba8Cu4.9Si41.1, the valence electron number is 1.3 electron larger than the critical value = 5.33, which means that the Fermi energy is above the gap, higher than the Fermi energy of Ba8Cu5Si41. Further decreasing the Cu concentration, i.e., increasing the number of valence electrons, shifts the Fermi energy away from the gap, which significantly reduces the absolute value of although the change in the number of valence electrons is rather small.
Summarizing, the DFT results for resemble the experimental trend rather well. It should be noted that rather small uncertainties in the stoichiometry, which are unavoidable in the preparation of the samples, result in significant variations of the number of valence electrons, which concomitantly leads to substantial variations of the Seebeck coefficients, as demonstrated by Fig. 12.
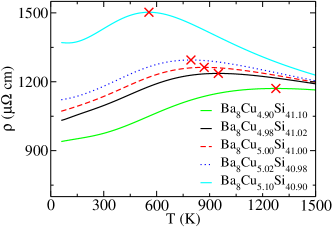
In Fig. 13 the resistivity is shown for Ba8CuxSi46-x with , as derived for frozen-Ba8Cu5Si41 as the reference. The relaxation time = 2.32 s was chosen to fit the calculated of Ba8Cu5.0Si41.0 to the experimental maximum of of Ba8Cu4.9Si41.1. Inspecting Fig. 13 one realizes that the calculations yield a trend similar to the experimental data, because the characteristic peak shifts toward higher temperatures with decreasing . The small difference in between theory and experiment, when requiring good agreement, is attributed to the experimental uncertainties of sample preparation. The maximum in the electrical resistivity is closely related to the position of the Fermi energy. In recent work on Ba8AgxGe46-x, it was found Zeiringer et al. (2011) that the peak is due to a particular position of the Fermi level in combination with the temperature dependence of the energy derivative of the Fermi function, . More specifically, if the Fermi energy is above but very close to the gap, the states below the gap will contribute to the electronic transport only for sufficiently large temperatures when is sufficiently broad. As the Fermi energy moves closer or away from the gap, concomitantly lower or higher temperatures are required for thermally exiting states below the gap. From the discussion above, one derives that the Fermi energies for all the compounds are above the gap and are approaching it as increases from 4.9 to 5.1.
From the discussion above we conclude, that the thermoelectric properties and the conductivity of Ba8CuxSi46-x alloys can be reasonably described and understood by means of a DFT approach.
IV Conclusion
In summary, thermoelectric properties of the ternary clathrate Ba8CuxSi46-x with the nominal Cu contents have been investigated. All thermoelectric quantities vary systematically with the actual Cu content in the clathrate phase. The highest figure of merit is achieved for the sample with the nominal composition at about C. Almost the same is retained over a relatively broad temperature range from 350 to C. For the optimal Cu content, samples were fabricated also by melt spinning. One of these samples reaches an even larger value of 0.28 at C. Extensive density functional theory calculations have been performed. For deriving enthalpies of formation the respective total energies for Ba8Si46, Ba8CuxSi46-x and Ba8AuxSi46-x were computed. Theroelectric properties were treated within Boltzmann’s theory and the properties in terms of Seebeck coefficients and resistivities were calculated by exploiting the electronic structure of Ba8Cu6Si40 and Ba8Cu5Si41. Overall, the agreement between the density functional data and experiment is reasonable, but some discrepancies remain to be solved.
Acknowledgements.
The authors would like to thank M. Wass for assistance in SEM/EDX measurements, A. Grytsiv and M. Falmbigl for help with hot pressing, and A. Prokofiev for fruitful discussions. This work was supported by the FFG project THECLA (815648), and partially by the FWF projects P19458-N16 and TRP 176-N22. M.X.C. gratefully acknowledges the support by the FWF within the Science College W4 “Computational Materials Science”.References
- Slack (1995) G. A. Slack, New Materials and Performance Limits for Thermoelectric Cooling, edited by D. Rowe (CRC Press: Boca Raton, 1995) p. 262.
- Rogl (2006) P. Rogl, Handbook of Thermoelectrics, Macro to Nano, edited by D. Rowe (CRC Press: Boca Raton, 2006) pp. 32–1.
- Kauzlarich et al. (2007) S. M. Kauzlarich, S. R. Brown, and G. J. Snyder, Dalton Trans. 2007, 2099 (2007).
- Toberer et al. (2010) E. S. Toberer, A. F. May, and G. J. Snyder, Chem. Mater. 22, 624 (2010).
- Zintl (1939) E. Zintl, Angew. Chem. 52, 1 (1939).
- Kauzlarich (1996) S. M. Kauzlarich, Chemistry, Structure, and Bonding of Zintl Phases and Ions (Wiley-VCH: New York, 1996).
- Sevov (2002) S. C. Sevov, Intermetallic Compounds, Principles and Practice: Progress, edited by J. Wiley and Sons (Chichester, England, 2002) p. 113.
- Melnychenko-Koblyuk et al. (2008) N. Melnychenko-Koblyuk, A. Grytsiv, P. Rogl, E. Bauer, R. Lackner, E. Royanian, M. Rotter, and G. Eiester, J. Phys. Soc. Jpn. 77, 54 (2008).
- Nasir et al. (2009) N. Nasir, A. Grytsiv, N. Melnychenko-Koblyuk, P. Rogl, E. Bauer, R. Lackner, E. Royanian, G. Giester, and A. Saccone, J. Phys.: Condens. Matter 21, 385404 (2009).
- Condron et al. (2005) C. L. Condron, R. Porter, T. Guo, and S. M. Kauzlarich, Inorg. Chem. 44, 9185 (2005).
- Condron et al. (2006) C. L. Condron, J. Martin, G. S. Nolas, P. M. B. Poccoli, A. J. Schultz, and S. M. Kauzlarich, Inorg. Chem. 45, 9381 (2006).
- Condron et al. (2008) C. L. Condron, S. M. Kauzlarich, T. Ikeda, G. Snyder, F. Haarmann, and P. Jeglič, Inorg. Chem. 47, 8024 (2008).
- Jaussaud et al. (2005) N. Jaussaud, P. Gravereau, S. Pechev, B. Chevalier, M. Menetrier, P. Dordor, R. Decourt, G. Goglio, C. Cros, and M. Pouchard, C. R. Chimie 8, 39 (2005).
- Mugita et al. (2011) N. Mugita, Y. Nakakohara, T. Motooka, R. Teranishi, and S. Munetoh, IOP Conference Series: Materials Science and Engineering 18, 142007 (2011).
- Tsujii et al. (2011) N. Tsujii, J. H. Roudebush, A. Zevalkink, C. A. Cox-Uvarov, G. J. Snyder, and S. M. Kauzlarich, J. Solid State Chem. 184, 1293 (2011).
- Kawaji et al. (1995) H. Kawaji, H. Horie, S. Yamanaka, and M. Ishikawa, Phys. Rev. Lett. 74, 1427 (1995).
- Herrmann et al. (1998) R. F. W. Herrmann, K. Tanigaki, S. Kuroshima, and H. Suematsu, Chem. Phys. Lett. 283, 29 (1998).
- Yamanaka et al. (2000) S. Yamanaka, E. Enishi, H. Fukuoka, and M. Yasukawa, Inorg. Chem. 39, 56 (2000).
- Teraoka et al. (2004) M. J. Teraoka, Y. Moritomo, and S. Yamanaka, Nat. Mater. 2, 653 (2004).
- Fukuoka et al. (2004) H. Fukuoka, J. Kiyoto, and S. Yamanaka, J. Phys. Chem. Solids 65, 333 (2004).
- Yang et al. (2005) L. Yang, Y. Wang, T. Liu, T. D. Hu, B. X. Li, K. Stahl, S. Y. Chen, M. Y. Li, P. Shen, G. L. Lu, Y. W. Wang, and J. Z. Jiang, J. Solid State Chem. 178, 1773 (2005).
- Kamakura et al. (2005) N. Kamakura, T. Nakano, Y. Ikemoto, M. Usuda, H. Fukuoka, S. Yamanaka, S. Shin, and K. Kobayashi, Phys. Rev. B 72, 014511 (2005).
- Tse et al. (2005) J. S. Tse, T. Iitaka, T. Kume, and H. Shimizu, Phys. Rev. B 72, 155441 (2005).
- Li et al. (2005) Y. Li, Y. Liu, N. Chen, G. Cao, Z. Feng, and J. R. Jr, Phys. Lett. A 345, 398 (2005).
- Akai et al. (2004) K. Akai, K. Koga, K. Oshiro, and M. Matsuum, Trans. Mater. Res. Soc. Jpn. 29, 3647 (2004).
- Akai et al. (2005) K. Akai, G. Zhao, K. Koga, K. Oshiro, and M. Matsuura, In: Proceedings of 24th International Conference on Thermoelectrics, Beijing, China, IEEE, Piscataway, NJ, USA , 230 (2005).
- X.Yan et al. (2010) X.Yan, G. Giester, E. Bauer, P. Rogl, and S. Paschen, J. Electron. Mater. 39, 1634 (2010).
- Zeiringer et al. (2011) I. Zeiringer, M. Chen, I. Bednar, E. Royanian, E. Bauer, R. Podloucky, A. Grytsiv, P. Rogl, and H. Effenberger, Acta Mater. 59, 2368 (2011).
- (29) Utility models in Austria (10749) and Germany (20 2008 006 9467), patents filed in Japan (135 994/2008) and USA (2/231. 183) .
- Paschena et al. (2008) S. Paschena, C. Gspanb, W. Groggerb, M. Dienstlederb, S. Laumanna, P. Pongratza, H. Sassika, J. Wernischa, and A. Prokofieva, J. Cryst. Growth 310, 1853 (2008).
- Rodr guez-Carvajal (1990) J. Rodr guez-Carvajal, FULLPROF: A Program for Rietveld Refinement and Pattern Matching Analysis (at the Satellite Meeting on Powder Diffraction of the XV IUCr Congress, 1990) p. 127.
- Kresse and Furthmüller (1996a) G. Kresse and J. Furthmüller, Phys. Rev. B 54, 11169 (1996a).
- Kresse and Furthmüller (1996b) G. Kresse and J. Furthmüller, Comput. Mater. Sci. 6, 15 (1996b).
- Blöchl (1994) P. E. Blöchl, Phys. Rev. B 50, 17953 (1994).
- Kresse and Joubert (1999) G. Kresse and D. Joubert, Phys. Rev. B 59, 1758 (1999).
- Monkhorst and Pack (1976) H. J. Monkhorst and J. D. Pack, Phys. Rev. B 13, 5188 (1976).
- Madsen and Singh (2006) G. K. Madsen and D. J. Singh, Comput. Phys. Commun. 175, 67 (2006).
- Melnychenko-Koblyuk et al. (2009) N. Melnychenko-Koblyuk, A. Grytsiv, P. Rogl, H. Schmid, and G. Eiester, J. Solid. State Chem. 182(7), 1754 (2009).
- Nguyen et al. (2010) L. T. K. Nguyen, U. Aydemir, M. Baitinger, E. Bauer, H. Borrmann, U. Burkhardt, J. Custers, A. Haghighirad, R. Hüfler, K. D. Luther, F. Ritter, W. Assmus, Y. Grin, and S. Paschen, Dalton Trans. 39, 1071 (2010).
- Melnychenko-Koblyuk et al. (2007a) N. Melnychenko-Koblyuk, A. Grytsiv, P. Rogl, H. Schmid, and G. Giester, J. Solid State Chem. 182, 1754 (2007a).
- Melnychenko-Koblyuk et al. (2007b) N. Melnychenko-Koblyuk, A. Grytsiv, S. Berger, H. Kaldarar, H. Michor, F. Röhrbacher, E. Royanian, E. Bauer, P. Rogl, H. Schmid, and G. Eiester, J. Phys: Condens. Matter 19, 046203 (2007b).
- Melnychenko-Koblyuk et al. (2007c) N. Melnychenko-Koblyuk, A. Grytsiv, P. Rogl, M. Rotter, R. Lackner, E. Bauer, L. Fornasari, F. Marabelli, and G. Eiester, Phys. Rev. B 76, 195124 (2007c).
- Prokofiev et al. (2009) A. Prokofiev, J. Custer, M. Kriegisch, S. Laumann, M. Müller, H. Sassik, R. Svagera, M. Waas, K. Neumaier, A. M. Strydom, and S. Paschen, Phys. Rev. B 80, 235107 (2009).
- Koza et al. (2010) M. M. Koza, M. R. Johnson, H. Mutka, M. Rotter, N. Nasir, A. Grytsiv, and P. Rogl, Phys. Rev. B 82, 214301 (2010).
- Zhang et al. (2011) H. Zhang, H. Borrmann, N. Oeschler, C. Candolfi, W. Schnelle, M. Schmidt, U. Burkhardt, M. Baitinger, J.-T. Zhao, and Y. Grin, Inorg. Chem. 50, 1250 (2011), http://pubs.acs.org/doi/pdf/10.1021/ic1016559 .
- Parthé et al. (1994) E. Parthé, L. Gelato, B. Chabot, M. Penzo, K. Cenzual, and R. Gladyshevskii, TZPIX Standardized Data and Crystal Chemical Characterization of Inorganic Structure Types (Springer, 1994).
- Yan et al. (2011) X. Yan, A. Grytsiv, G. Giester, E. Bauer, P. Rogl, and S. Paschen, J. Electron. Mater. 40, 589 (2011).
- Cutler et al. (1964) M. Cutler, J. F. Leavy, and R. L. Fitzpatrick, Phys. Rev. 133, 1143 (1964).
- Blatt (1964) F. J. Blatt, Proc. Phys. Soc. 83, 1065 (1964).
- Peierls (1929) R. Peierls, Ann. Phys. 395, 1055 (1929).