Magnetic phase diagram of YbCo2Si2 derived from magnetization measurements
Abstract
We report on high-resolution dc-magnetization () measurements on a high-quality single crystal of YbCo2Si2. was measured down to 0.05 K and in fields up to 3 T, with the magnetic field oriented along the crystallographic directions
, and of the tetragonal structure.
In a small field T two antiferromagnetic (AFM) phase transitions have been detected at K and K, in the form of a sharp cusp and a sudden drop in . These signatures confirm that the phase
transitions are order at and order at . The AFM order is completely suppressed by fields as high as , 1.88 and 2.35 T for , and , respectively. At these fields,
reaches its saturation values and which match quite well those calculated for the ground state proposed in Ref. Klingner
et al., 2011a and confirm the
trivalent state of the Yb ions in YbCo2Si2.
We have derived the phase diagrams along the three crystallographic directions from isothermal and isofield measurements. Four AFM regions can be identified for parallel to and which are separated by and
order phase-transition lines, showing anisotropy in the basal plane. For parallel to only two AFM phases have been observed. The phase boundary , which separated the AFM phase from the paramagnetic one, can be well described
by the empirical relation with close to 2.
pacs:
75, 75.30GwI Introduction
In Yb-based intermetallic compounds magnetic ordering is relatively rare, since usually the Yb atom has a valence close to +2, which implies a non-magnetic ground state. In few rare cases the Yb valence is close to three. Then the Yb3+ local magnetic
moments can both interact with the conduction electrons (Kondo effect) and with each other through the Ruderman-Kittel-Kasuya-Yoshida (RKKY) exchange interaction. Stewart (1984) One possibility is that a strong Kondo effect can progressively screen the Yb magnetic moments
leaving a non-magnetic Fermi-liquid ground state. If the Kondo effect is not strong enough, however, magnetic order can be established by the RKKY interaction, and in Yb-based intermetallics it is quite often antiferromagnetic (AFM).
A special case is YbRh2Si2, which, with a Kondo temperature K and an antiferromagnetically ordered state below K, is close to the critical point where the AFM ground state gets suppressed by the increasing
Kondo interaction. Trovarelli et al. (2000) A further sharp phase transition has been observed in magnetization measurements at a temperature K; Schuberth et al. (2009)
its origin is still unclear, but the comparison with the homologue YbCo2Si2 Pedrero et al. (2010) and the evolution of observed in the series Yb(Rh1-xCoSi2 suggest a second AFM phase transition of the first order.Klingner (2009); Klingner
et al. (2011b)
In YbRh2Si2 the very low and the itinerant character of the magnetism made it possible to study the unconventional behavior of the thermodynamic and transport properties close to a quantum critical point (QCP). Gegenwart et al. (2002, 2007)
The anomalous behavior is caused by quantum critical fluctuations which may, in principle, be observed directly in the magnetic response , measured by inelastic neutron scattering. Schröder et al. (2000)
These experiments require a certain knowledge of the magnetically ordered structure below , e.g., the ordering wave vector Q. In YbRh2Si2 the structure of the ordered phase is still unknown.
This is mainly due to experimental problems: limited size of the single crystals ( mm3), low and also an extremely small ordered moment (). Ishida et al. (2003) To overcome these difficulties,
neutron scattering experiments should be carried out under pressure, since and the corresponding
ordered moment increase with increasing pressure in Yb-based compounds. Knebel et al. (2006); Mederle et al. (2001) Such experiments are, however, rather difficult.
Isoelectronic substitution of Rh by Co leads to a similar effect as pressure. Westerkamp et al. (2008); Friedemann et al. (2009)
The crystal growing process has been recently optimised in order to produce single crystals of Yb(Rh1-xCoSi2, which all crystallize in the tetragonal ThCr2Si2-type structure: Several high-quality
single crystals with a Co content varying between 0.03 and 1 have been synthesized. Klingner (2009); Klingner
et al. (2011b) As expected, increasing stabilizes magnetic order, enhancing and the value of the ordered moment. In this contribution
we present an investigation of the magnetic properties of YbCo2Si2 by means of dc-magnetization measurements. We have derived the low-temperature magnetic phase diagram by applying the magnetic field along three
crystallographic directions: , and . Knowledge of the magnetic structure in YbCo2Si2 may help to identify the ordered state in YbRh2Si2.
The first sign of magnetic order in YbCo2Si2 was observed by 170Yb Mössbauer spectroscopy experiments on polycrystalline materials. Hodges (1987) AFM order was found below 1.7 K with the easy magnetization in the basal plane
and a saturated moment of /Yb, which agrees very well with our preliminary magnetization measurements along the [100] direction. Pedrero et al. (2010)
These results could be explained in terms of a Yb3+ valence state experiencing a tetragonal crystalline electrical field (CEF), resulting in a Kramers-doublet as the ground state. This agrees well with high-temperature ( K) susceptibility measurements,
which show a Curie-Weiss behavior with an effective moment of /Yb and a Weiss temperature of -4 K and -160 K for the magnetic field parallel and perpendicular to the basal plane, respectively. No magnetic contribution from Co has been
observed. Klingner (2009); Klingner
et al. (2011a) A similar fit at temperatures between 2 and 4 K leads to a reduced effective moment of /Yb. Neutron scattering experiments revealed that the excited Kramers doublets
are 4, 12.5 and 30.5 meV away from the ground state doublet. Goremychkin and Osborn (2000) An exact analysis of the CEF level scheme has been proposed in Ref. Klingner
et al., 2011a,
which leads to an estimation of the saturation magnetization of and for perpendicular and parallel to the crystallographic axis , respectively. A second, clearly first order, AFM phase transition has been observed at
a temperature K by means of magnetization, resistivity and specific-heat measurements. Pedrero et al. (2010); Mufti et al. (2010); Klingner
et al. (2011a) Both transition temperatures are suppressed by a field larger than 2 T,
and the magnetic phase diagrams become very complex, showing a strong basal anisotropy. Mufti et al. (2010) Finally, powder neutron diffraction studies, performed in the intermediate and low- AFM states, have detected magnetic peaks and suggested
that Q changes its periodicity between the two phases. Kaneko et al. (2010) In addition, preliminary neutron scattering experiments on single crystals seem to have identified Q and to indicate that Q is incommensurate
below and becomes commensurate below . Mufti and et al. (2011)
Our data can be used to test the CEF calculations by providing the values of the saturation magnetization and clarify the evolution of the magnetic structure in an applied magnetic field.
II Experimental
The single crystals investigated here have been grown with In-flux technique as fully described in Ref. Klingner et al., 2011a. They have a residual resistance ratio of about 2 at 0.35 K and a mass between 8 and 35 mg. Their shape is square, with sides parallel to the crystallographic direction [100]. The dc-magnetization () was measured with a high-resolution Faraday magnetometer, in magnetic fields as high as 3 T and temperatures down to 0.05 K. Sakakibara et al. (1994) Owing to the magnetic anisotropy of YbCo2Si2 (a factor of about 4), Klingner (2009); Klingner et al. (2011a) the sample platform was modified to reduce the torque contribution of the raw signal, which is proportional to the magnetization perpendicular to the applied field.
The platform consists of Stycast epoxy resin. Its small, diamagnetic response to a magnetic field was subtracted. The ac-susceptibility measurements were performed in a Quantum Design Physical Properties Measurement System (PPMS) in temperatures down to 2 K and magnetic fields up to 3 T. Some measurements have been carried out down to 0.5 K in a 3He option (iQuantum Corporation) for a 7T-SQUID (Quantum Design).
III Results
III.1 Magnetization vs. temperature
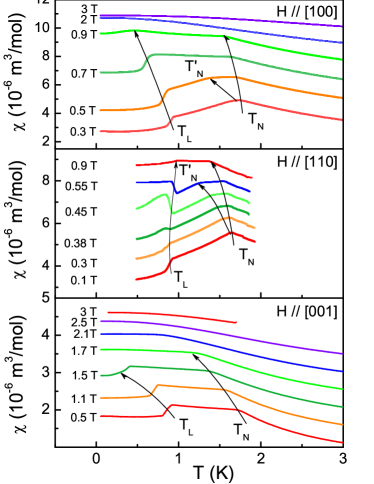
Figure 1 shows the temperature dependence of the uniform susceptibility in several fields along the three crystallographic directions. Two features can be identified in all three field directions: a sharp kink at K and
a distinct drop at K. At AFM order sets in and assumes a different antiferromagnetically ordered structure below , as suggested in Ref. Kaneko et al., 2010. The shape of the magnetization curves is similar
to that observed in YbRh2Si2 (see Ref. Schuberth et al., 2009), pointing to an AFM nature of the phase transition at in YbRh2Si2.
While the phase transition at is second order, the sudden drop at and the latent heat observed in the heat capacity in zero field (see Ref. Klingner
et al., 2011a) point to the first order nature of this phase transition. The entropy above both
transitions confirms a Kramers doublet as the ground state and the local character of the Yb quasi-hole. The Kondo temperature has been estimated to be lower than 1 K. Klingner (2009); Klingner
et al. (2011b) Both and shift to
lower temperatures with increasing along the and directions, whereas for remains almost constant in . For parallel to [100] and [110] and at fields higher than 0.1 T, the sharp cusp at changes
into a plateau, where remains almost constant down to a temperature (cf. curve at 0.5 T for and curve at 0.55 T for of Fig. 1). The lower transition becomes broader in as the external field is enhanced, and
it disappears for fields T along the two directions and , but a field larger than 1.5 T is necessary to suppress along . A field T is necessary to suppress to zero, where
becomes nearly constant, in all three directions.
The strong basal anisotropy observed in magnetoresistance measurements (see Ref. Mufti et al., 2010) is confirmed by the different behavior of the isofield curves taken along and . The curves look very similar for T but at higher
fields the susceptibility along keeps decreasing below , while along it increases steeply.
The scenario proposed in Ref. Mufti et al., 2010 is that the phase transition at is the one where the propagation vector Q changes from incommensurate to commensurate. On the other hand, the kink at and the features observed for
at T in the isothermal measurements would indicate a possible reorientation of the moments without any change in Q. This could explain why changes behavior above 0.4 T.
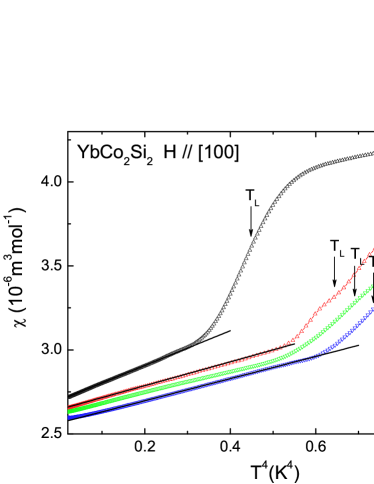
It is worth noting that, below and in low fields parallel to , the susceptibility follows a dependence, as shown in Fig. 2. This temperature dependence is due to spin-wave excitations and depends strictly on their
dispersion, which is as yet unknown in this system.
III.2 Magnetization vs. field
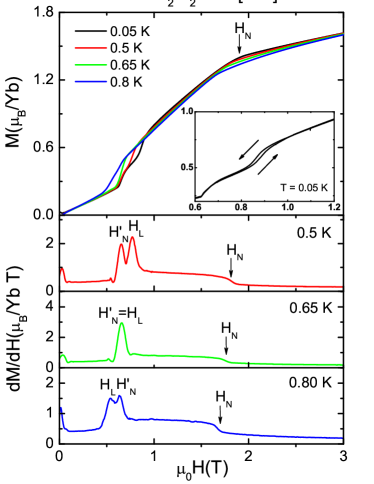
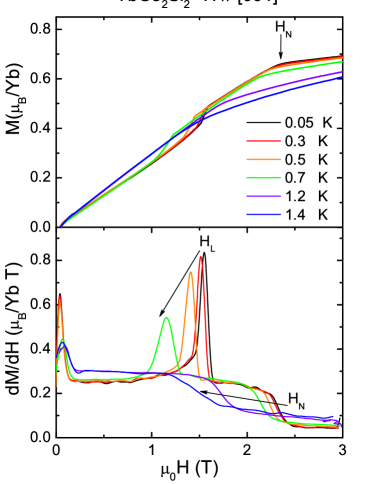
To investigate the phase transition lines in more detail, we measured the field dependence of at different temperatures. The results are shown in figures 3 to 5 with the respective derivatives . We start by describing the data collected with (Fig. 3). The isothermal curves at 0.05 K show two metamagnetic-like steps at about 0.65 T and 0.85 T, followed by a kink at T, which is associated with the transition at (upper panel). Measuring , while sweeping the field up and down, a tiny hysteresis is observed across the first two steps that is more pronouced across the one at 0.85 T (cf. inset of the same panel). At the transition is continuous. At a slightly higher temperature K, the hysteresis vanishes. By further increasing , the two steps merge into one at 0.65 K and afterwards split again at 0.8 K without showing any hysteresis.
This is well illustrated in the bottom panels of Fig. 3, where is plotted as a function of . We have assigned the critical fields of the metamagnetic-like transitions to the fields corresponding to the maxima of and for the
transition at we considered the inflection points in . Moreover, from the evolution of these anomalies in field we have associated the fields of the first and second step with the signatures seen at and , namely
and .
These signatures indicate that the nature of the phase line may be of the second order while the one of is of the first order. This do not contradict the interpretation given in Ref. Mufti et al., 2010 that at 0.65 T
the field modifies the orientation of the moments (either through a spin-flop transition or depopulating unfavoured AFM domains, that causes the strong change of slope in vs. ) without modifying the propagation vector Q, whereas at 0.85 T it is the change of Q,
that causes the tiny hysteresis effect. This scenario seems to be confirmed by neutron scattering experiments on single crystals performed in magnetic field. Mufti and et al. (2011)
The value of the magnetization just above is 1.4 Yb, which is in agreement with the saturated moment calculated by Hodges Hodges (1987) and recently by Klingner et al. , Klingner
et al. (2011a) confirming the local character
of the Yb quasi-holes. Above , increases further because of van Vleck contributions due to mixing of higher CEF levels. Kutuzov et al. (2008)
The results of the vs. measurements with along the direction are shown in Fig. 4.
At all temperatures lower than , a metamagnetic-like step is observed at almost the same field of 0.45 T with no detectable hysteresis. However, the temperatures at which these data have been taken are higher than 0.05 K (cf. inset of
Fig. 3). The expected saturation magnetization of 1.4 Yb is achieved at T for a temperature of 0.5 K, below which we did not carry out further measurements. At 1.4 K the signature of such an anomaly is very weak
and can only be observed in the derivative (cf. bottom panel of Fig. 4). Since only a metamagnetic-like transition is seen along the direction, one may ask whether this transition represents the reorientation of the moments or a change
in Q. Since this feature seems to be present also above , we tend to associate it with .
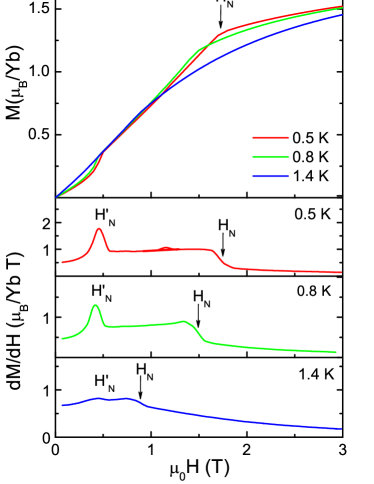
Finally, Fig. 5 shows representative curves of the magnetization as a function of the field (upper panel) and its derivative (lower panel) for . In these measurements also, only a single step could be discerned before the magnetization
reaches its saturation value of 0.68 Yb with a kink at 2.35 T for K. The saturated moment matches very well with that calculated in Ref.Klingner
et al., 2011a.
In this case we have associated the metamagnetic-like step in vs. with the phase transition at , although here no hysteresis could be resolved. This association derives directly from the shape of the phase lines plotted in Fig. 6. Both the isothermal and isofield measurements show features at the same phase transition lines where the propagation vector Q is supposed to change. In the lower panel of Fig. 5 we have plotted vs. to emphasize that the signatures at and broaden while the peak intensity is reduced, as expected from the evolution of the phase transition lines.
IV phase diagram
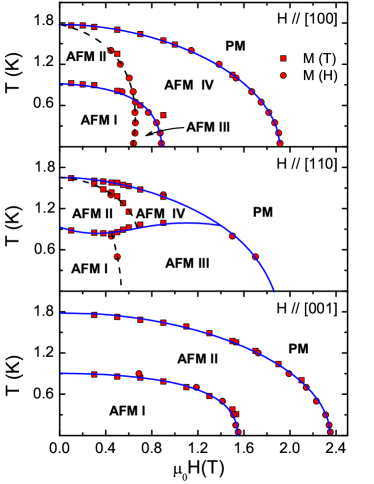
The deduced magnetic phase diagram with applied along the three crystallographic directions , and is shown in Fig. 6. The squares and circles indicate anomalies observed in vs. and vs. , respectively.
The outer second order phase-transition boundary line, which separates the AFM from the paramagnetic (PM) phase, can be followed from 1.75 K in zero field up to the critical fields , 1.88 and 2.35 T along the three directions.
The data along these lines can well be described by an empirical curve with close to 2. The exponents are displayed in the caption of Fig. 6. For
at zero field is slightly smaller than that measured along or . This is due to the fact that the isofield measurements were performed in the SQUID on a second sample of the same batch. Klingner (2009)
Inside the magnetic phase, four AFM regions can be identified when the field is applied along the basal plane (upper panels), while for only two regions have been observed (lower panel). We start our description from the lower
panel of Fig. 6. Since the two AFM phase transitions at and in zero field have been established to be of the second and first order and involve a change of the propagation vector Q, Klingner
et al. (2011a); Kaneko et al. (2010); Mufti and et al. (2011)
it is straightforward to draw continuous lines on the points and consider the two regions AFM I and II as regions with different Q. On the other hand, for the line seems to split in field separating the regions AFM II
and IV and AFM I and III by a second-order-like phase transition indicated by a kink at or a metamagnetic-like step at without hysteresis (see Figs. 1 and 3). In addition, the boundaries between the phases
I and II and between the phases III and IV appear to be first order lines (see Fig. 3). For this reason we have drawn a continuous line, which we think separates the regions with different Q. A similar interpretation can be considered
for , but in this case the line separating the two magnetic structures is almost constant in temperaure. Recent neutron scattering experiments
performed in magnetic field seem to support such a scenario. Mufti and et al. (2011) Taking into account all our findings
and the results of Refs. Mufti et al., 2010; Kaneko et al., 2010; Mufti and et al., 2011 we might interpret our data as follows: Region II is characterized by AFM order with an incommensurate arrangement of the moments, which then assumes a commensurate structure
in region I through a first order phase transition. By applying a magnetic field along , the arrangement of the moments undergoes a metamagnetic-like transition
at changing the propagation vector and becoming fully polarized above 2.35 T.
The same feature is expected across the continuous line inside the magnetic ordered phase for (upper panel of Fig. 6),
e.g. betweeen the AFM III and AFM IV. For and the magnetic field modifies the orientation of the moments at (dashed lines in Fig. 6),
either through a spin-flop transition or depopulating unfavoured AFM domains, without modifying the propagation vector Q. However, in Ref. Mufti and et al., 2011 a
significant difference between the behavior of the magnetoresistance across the dashed lines for temperatures lower and higher than was observed: For
the magnetoresistance shows a kink at suggesting a continuous transition, e.g. a depopulation of unfavoured AFM domains, while for the magnetoresistance
shows a distinct drop inferring a spin-flop transition, possibly into a structure with a ferromagnetic component.
The fact that only for no reorientation of the moments is observed, suggests that the moments may lie in directions close to the basal plane, as previously suggested by Hodges. Hodges (1987)
Our interpretation assumes that the AFM structure allows multiple domains and that the dashed lines in Fig. 6 may indicate a simple domains depopulation effect.
Another and more suggestive possibility is that of a double-Q structure as has been found, e.g., in GdNi2B2C. Jensen and Rotter (2008)
The same principle holds for such a kind of structure in which the field somehow favors one or the other propagation vector.
V Ac-susceptibility
Finally, we would like to briefly compare ac-susceptibility measurements on YbCo2Si2 with those performed on YbRh2Si2. Westerkamp et al. (2008) In the latter compound a maximum was observed in the temperature dependence of in magnetic field and it was associated with an energy scale interpreted as the energy where the Kondo effect breaks down due to the presence of a field-induced QCP at . The line vanishes for at the QCP. Gegenwart et al. (2007) In YbCo2Si2 we observe a similar effect, i.e., maxima in which are indicated by arrows in Fig. 7. Plotting the maxima on the phase diagram (inset of the same figure) we can deduce from the evolution of the points that the similar energy scale for YbCo2Si2 is not approaching the critical field . In YbCo2Si2 the maxima undoubtedly represent the thermal excitations of the upper level of the Zeeman split ground state doublet.
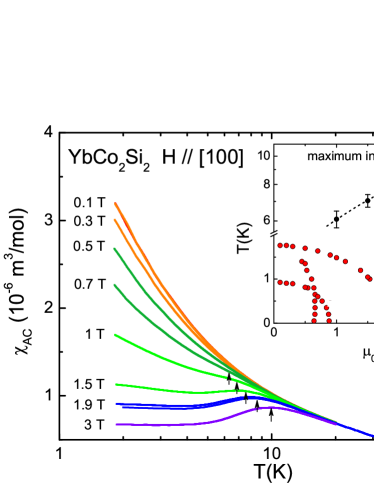
Since YbCo2Si2 is a system where the Yb quasi-holes are almost localized while in YbRh2Si2 they are almost delocalized, a straightforward comparison between the two systems cannot be made. However, it would be interesting to study the evolution of this energy scale while varying the Co content, as has already been done in Refs. Westerkamp et al., 2008 and Friedemann et al., 2009.
VI Conclusions
We have explored the magnetic phase diagram of YbCo2Si2 by means of isothermal and isofield magnetization measurements with the magnetic field oriented along the crystallographic directions , and . In a small field T two AFM phase transitions were detected at K and K, in the form of a sharp cusp and a sudden drop in . These signatures confirm that the phase transitions are second order at and first order at . The shape of the magnetization curve is similar to that observed in YbRh2Si2 pointing to the AFM nature of the phase transition at in YbRh2Si2. The AFM order is completely suppressed by fields close to 2 T where the magnetization reaches its saturation values and which match quite well with those calculated for the ground state proposed in Ref. Klingner et al., 2011a and confirm the trivalent state of the Yb ions in YbCo2Si2. Inside the AFM phase, two main regions can be identified along all directions where the propagation vector Q assumes two different values. For parallel to and (the magnetic structure is anisotropic in the basal plane), however, these regions are separated by another line, which seems to correspond to the line where the magnetic moments reorient, i.e. either through a spin-flop transition or by changing the domains population; in the case of an AFM double-Q structure we would observe the same features and neutron scattering experiments are needed to shed light on this point. For parallel to only two AFM phases have been observed, inferring that the moments likely lay in directions close to the basal plane.
VII Acknowledgment
We are indebed to C. Klausnitzer, U. Ließ and T. Lühmann for technical support and K. Kaneko, N. Mufti O. Stockert and M. Rotter for useful discussions.
References
- Klingner et al. (2011a) C. Klingner, C. Krellner, M. Brando, C. Geibel, and F. Steglich, New Journal of Physics 13, 083024 (2011a).
- Stewart (1984) G. R. Stewart, Rev. Mod. Phys. 56, 755 (1984).
- Trovarelli et al. (2000) O. Trovarelli, C. Geibel, S. Mederle, C. Langhammer, F. M. Grosche, P. Gegenwart, M. Lang, G. Sparn, and F. Steglich, Phys. Rev. Lett. 85, 626 (2000).
- Schuberth et al. (2009) E. Schuberth, M. Tippmann, M. Kath, C. Krellner, C. Geibel, T. Westerkamp, C. Klingner, and F. Steglich, Journal of Physics: Conference Series 150, 042178 (2009).
- Pedrero et al. (2010) L. Pedrero, M. Brando, C. Klingner, C. Krellner, C. Geibel, and F. Steglich, J. of Phys.: Conference Series 200, 012157 (2010).
- Klingner (2009) C. Klingner, Diploma thesis, Technical University, Dresden (2009).
- Klingner et al. (2011b) C. Klingner, C. Krellner, M. Brando, C. Geibel, F. Steglich, D. V. Vyalikh, K. Kummer, S. Danzenbächer, S. L. Molodtsov, C. Laubschat, et al., Phys. Rev. B 83, 144405 (2011b).
- Gegenwart et al. (2002) P. Gegenwart, J. Custers, C. Geibel, K. Neumaier, T. Tayama, K. Tenya, O. Trovarelli, and F. Steglich, Phys. Rev. Lett. 89, 056402 (2002).
- Gegenwart et al. (2007) P. Gegenwart, T. Westerkamp, C. Krellner, Y. Tokiwa, S. Paschen, C. Geibel, F. Steglich, E. Abrahams, and Q. Si, Science 315, 969 (2007).
- Schröder et al. (2000) A. Schröder, G. Aeppli, R. Coldea, M. Adams, O. Stockert, H. Lohneysen, E. Bucher, R. Ramazashvili, and P. Coleman, Nature 407, 351 (2000).
- Ishida et al. (2003) K. Ishida, D. E. MacLaughlin, B. L. Young, K. Okamoto, Y. Kawasaki, Y. Kitaoka, G. J. Nieuwenhuys, R. H. Heffner, O. O. Bernal, W. Higemoto, et al., Phys. Rev. B 68, 184401 (2003).
- Knebel et al. (2006) G. Knebel, R. Boursier, E. Hassinger, G. Lapertot, P. G. Niklowitz, A. Pourret, B. Salce, J. P. Sanchez, I. Sheikin, P. Bonville, et al., J. Phys. Soc. Jpn. 75, 114709 (2006).
- Mederle et al. (2001) S. Mederle, R. Borth, C. Geibel, F. M. Grosche, G. Sparn, O. Trovarelli, and F. Steglich, J. Magn. Magn. Mater. 226-230, 254 (2001).
- Westerkamp et al. (2008) T. Westerkamp, P. Gegenwart, C. Krellner, C. Geibel, and F. Steglich, Physica B: Condensed Matter 403, 1236 (2008).
- Friedemann et al. (2009) S. Friedemann, T. Westerkamp, M. Brando, N. Oeschler, S. Wirth, P. Gegenwart, C. Krellner, C. Geibel, and F. Steglich, Nature Phys. 5, 465 (2009).
- Hodges (1987) J. A. Hodges, EPL (Europhysics Letters) 4, 749 (1987).
- Goremychkin and Osborn (2000) E. A. Goremychkin and R. Osborn (2000), vol. 87, pp. 6818–6820.
- Mufti et al. (2010) N. Mufti, C. Klingner, L. Pedrero, M. Brando, K. Kaneko, C. Krellner, O. Stockert, and C. Geibel, physica status solidi (b) 247, 743 (2010).
- Kaneko et al. (2010) K. Kaneko, O. Stockert, N. Mufti, K. Kiefer, C. Klingner, C. Krellner, C. Geibel, and F. Steglich, J. of Phys.: Conference Series 200, 032031 (2010).
- Mufti and et al. (2011) N. Mufti and et al., unpublished (2011).
- Sakakibara et al. (1994) T. Sakakibara, H. Mitamura, T. Tayama, and H. Amitsuka, Jpn. J. Appl. Phys. 33, 5067 (1994).
- Kutuzov et al. (2008) A. S. Kutuzov, A. M. Skvortsova, S. I. Belov, J. Sichelschmidt, J. Wykhoff, I. Eremin, C. Krellner, C. Geibel, and B. I. Kochelaev, Journal of Physics: Condensed Matter 20, 455208 (2008).
- Jensen and Rotter (2008) J. Jensen and M. Rotter, Phys. Rev. B 77, 134408 (2008).