Unusual Central Engine Activity in the Double Burst GRB 110709B
Abstract
The double burst, GRB 110709B, triggered Swift/BAT twice at 21:32:39 UT and 21:43:45 UT, respectively, on 9 July 2011. This is the first time we observed a GRB with two BAT triggers. In this paper, we present simultaneous Swift and Konus-WIND observations of this unusual GRB and its afterglow. If the two events originated from the same physical progenitor, their different time-dependent spectral evolution suggests they must belong to different episodes of the central engine, which may be a magnetar-to-BH accretion system.
Subject headings:
gamma-ray burst: general1. Introduction
Gamma-Ray Bursts (GRBs) have been thought to be non-repeatable events through both observation and theoretical understanding. The general picture of a GRB is as follows: (1) A “central engine” consisting of a rapidly rotating black hole (BH) and a nuclear-density accretion disk is formed from a progenitor system, which invokes either core-collapse of a massive star (Woosley 1993; MacFadyen & Woosley 1999; Fryer et al. 2007) or merger of two compact stellar objects such as NS-NS or BH-NS (Paczýnski, 1986; Eichler et al., 1989; Paczýnski, 1991; Narayan et al., 1992). (2) Relativistically expanding ejecta composed of many mini-shells with a wide-range of Lorentz factors are launched by the central engine. Internal shocks (Rees & Mészáros, 1994) are formed during the collisions of those shells and produce the observed prompt GRB emission (mostly in Gamma-ray band). Observationally this is the phase when GRBs trigger gamma-ray band detectors. (3) The ejecta are further decelerated by an ambient medium (e.g., interstellar medium; ISM) and produce a long-term broadband afterglow through an external-forward shock (Mészáros & Rees 1997; Sari et al. 1998) and/or external-reverse shock (Mészáros & Rees 1997, 1999; Sari & Piran 1999a,b). (4) In some cases, the central engine can be restarted during the afterglow phase and X-ray flares are produced through dissipation of a late wind launched from a long-lasting central engine (Burrows et al. 2005a; Zhang et al. 2006; Fan & Wei 2005; Ioka et al. 2005; Wu et al. 2005; Falcone et al. 2006; Romano et al. 2006a; Lazzati & Perna 2007; Maxham & Zhang 2009; see Zhang 2007 for review). Although X-ray flares are generally regarded to arise from the same physical region as prompt emission, they release their energy mostly in the soft X-ray band.
GRB 110709B triggered the Burst Alert Telescope on-board Swift (Gehrels et al. 2004) twice. Each of the triggers, separated by 11 minutes, consists of an otherwise typical long GRB light curve in the hard X-ray/gamma-ray band. X-ray observations during the second burst show that this event also produced bright soft X-ray emission. This provides a rare opportunity to conduct a detailed broadband study of the central engine properties.
In this paper, we first report the Swift and Konus-WIND observations of GRB 110709B in §2. Then we present multi-wavelength spectroscopy and timing studies in §3. The physical implications on the central engine properties are discussed in §4. We draw our conclusions in §5.
2. Observations and Data Analysis
2.1. Swift Data
GRB 110709B first triggered the Burst Alert Telescope (BAT; Barthlmy et al. 2005) on-board Swift at 21:32:39 UT on 9 July 2011 (Cummings et al. 2011a). Swift slewed immediately to the burst. The two narrow field instruments, the X-ray Telescope (XRT; Burrows et al. 2005b) and the Ultraviolet Optical telescope (UVOT; Roming et al. 2005) on-board Swift began to observe the field at seconds and seconds, respectively, where is the BAT trigger time. A bright X-ray afterglow was localized at , with an uncertainty of 14 (90% confidence, Beardmore et al. 2011). No reliable optical source was found within the XRT error circle (Holland et al. 2011a,b).
Interestingly, at 21:43:25 UT on 9 July 2011, 11 minutes after the first trigger, the BAT was triggered again and located a second event from the same location (Barthelmy et al. 2011). The second outburst has comparable intensity and light curve characteristics to the first outburst. Regarding the two outbursts as two episodes of a single burst, the separation (11 minutes) is the longest compared to other multi-episode GRBs measured by Swift. In this paper, we use the term “double burst” to stress the unusual nature of this double-trigger GRB. We will use the term “the first sub-burst” to refer to the first outburst and “the second sub-burst” to refer to the second outburst. However, as we will show below, the two events are clearly related, indicating that they originated from the same physical progenitor system (see Drago & Pagliara 2007 for a statistical study of similar GRBs with long quiescent phases).
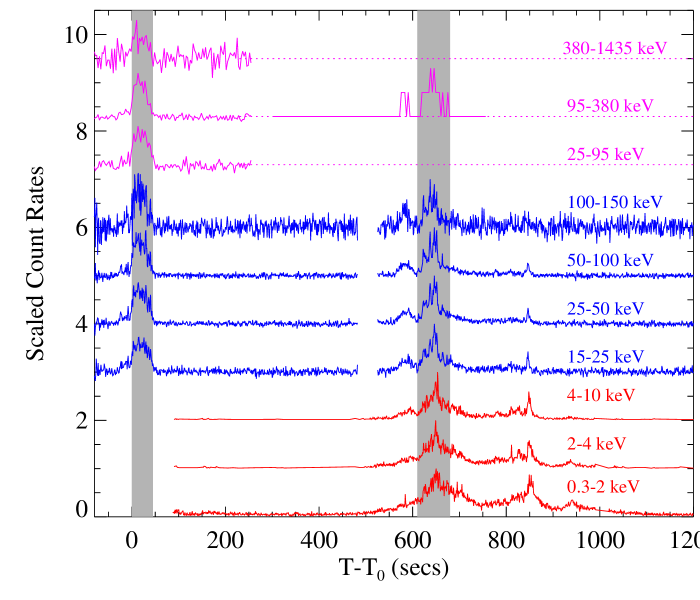
We processed the Swift/BAT data using standard HEAsoft tools (version 6.11). As shown in Fig. 1, the first sub-burst lasted from seconds to seconds with seconds. The second sub-burst lasted from seconds to about seconds with seconds (Cummings et al. 2011b). There was no flux detectable in BAT from about seconds to about seconds. We extracted the BAT spectra in several slices. The lower panel in Fig. 1 shows the photon indices obtained by fitting the spectra with a simple power law model. It is obvious that both sub-bursts have strong hard-to-soft spectral evolution. The photon indices range from to . The BAT band (15-150 keV) fluences of the first and second sub-bursts are and respectively.

We processed the Swift/XRT data using our own IDL codes which employ the standard HEAsoft analysis tools. For technical details please refer to Zhang et al. 2007. Fig. 2 shows the XRT light curve and spectral evolution. The prolonged and energetic flaring activity continues up to seconds, which corresponds to the second sub-burst time period. The light curve after the flare can be fitted by a broken power-law with , and a break time (). Assuming GRB 110709B is at the average redshift (z2) of Swift GRBs, its rest frame break time, (=), and the corresponding X-ray luminosity, (), are consistent with of the - correlation of previous Swift GRBs (Dainotti et al. 2010). The X-ray spectrum can be fitted with an absorbed power-law with total column , which includes the Galactic foreground (D’Elia et al. 2011). Strong spectral evolution was observed in the second sub-burst phase, where the photon indices vary significantly from to . The spectrum after has no significant evolution, with an average photon index . The total fluence in XRT band (0.3-10 keV) is .
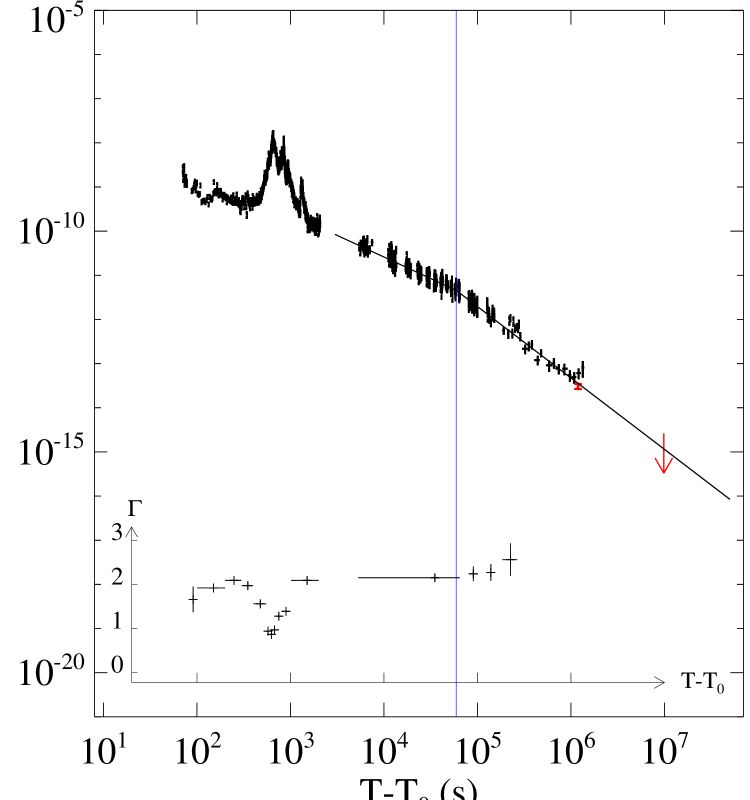
In order to check whether the break in the XRT light curve is due to curvature caused by an incorrect reference time effect (e.g., Yamazaki 2009 and Liang et al. 2009, 2010), we plotted the XRT light curve in reference to the trigger time of the second sub-burst. We found that the , and do not significantly change within 1-sigma range. We thus conclude that the break is intrinsic.
2.2. Konus-Wind Data
GRB 110709B triggered detector S1 of the Konus-WIND gamma-ray spectrometer (Apterkar et al. 1995) at 21:32:44.567 s UT on 9 July 2011 (Golenetskii et al. 2011). Konus-WIND recorded the first sub-burst with high-resolution data. The of the first sub-burst in Konus-WIND energy band (20 keV - 5 MeV) is s. The fluence in the same energy range is . The second sub-burst fell into a telemetry gap but was recorded by the instrument’s spare count rate measurement channel (Fig. 3). The overlap detection of the first sub-burst allows a BAT+Konus-WIND multi-wavelength study.
3. Multi-wavelength timing and spectroscopy properties
3.1. Joint Spectral Fit
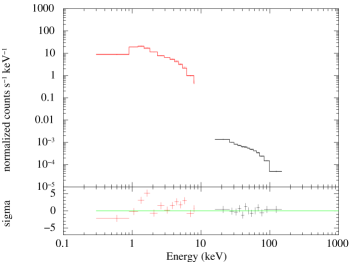
As shown in Fig 3, the first sub-burst was simultaneously observed by Konus-WIND and Swift/BAT, so we are able to perform joint spectral fitting using the spectra of those two instruments. We divide the time period of the first sub-burst into 5 time slices. The exact time ranges of each slice are listed in Table 1. For the first four slices, the best fit model is a cut-off power-law (CPL, cutoffpl in Xspec 12). For the 5th slice, the best fit model is a simple power-law (PL, powerlaw in Xspec 12). The time-dependent fitting results are presented in Table 1. The time-integrated spectrum (3.594 s to 44.810 s ) can also be fitted with a cut-off power-law model with , and (Fig. 4). The second sub-burst was simultaneously observed by Swift/BAT and Swift/XRT. Similarly with the first sub-burst, we are able to perform joint spectral fitting using the spectra of those two instruments. We divide the time period of the second sub-burst into 5 slices (listed in Table 1). We fit the spectrum of each slice using absorbed cut-off power-law model. An underlying simple power-law decaying component was also taken into account and subtracted using the same strategy as in Falcone et al. 2007. The time-dependent fitting results are presented in Table 1. The time-averaged (550s to 1000 s) BAT+XRT spectra are well fitted by the absorbed cut-off power-law model with , and (Fig. 5).
The spectral evolution during the whole double burst shows an overall hard-to-soft trend. In Fig. 6, we plot the modeled spectral energy distribution in different time intervals, which demonstrates the intrinsic spectral shape evolution. Fig. 7 & 8 show the evolution of and respectively. Although strong spectral evolution is exhibited by both sub-bursts, their time-dependent behaviors are very different. For example, as shown in Fig 7, the of the first sub-burst decays to while the of the second sub-burst decays to (or if we shift reference time of the second sub-burst to its trigger time). The different time-dependent spectral of the two sub-bursts may suggest that the two sub-bursts are from different stages of the same central engine (see §4 for more discussions).


| Time interval | Model | Inst. | |||
|---|---|---|---|---|---|
| s | keV | ||||
| (3.594,12.042) | CPL | 127/128 | BAT+KW | ||
| (12.042,20.230) | CPL | 135/128 | BAT+KW | ||
| (20.230,28.426) | CPL | 156/128 | BAT+KW | ||
| (28.426,36.618) | CPL | 111/128 | BAT+KW | ||
| (36.618,44.810) | PL | 132/129 | BAT+KW | ||
| (3.594,44.810) | CPL | 125/129 | BAT+KW | ||
| (550,600) | CPL | 263/303 | BAT+XRT | ||
| (600,650) | CPL | 360/418 | BAT+XRT | ||
| (650,700) | CPL | 343/365 | BAT+XRT | ||
| (700,800) | CPL | 438/456 | BAT+XRT | ||
| (800,1000) | CPL | 512/501 | BAT+XRT | ||
| (550,1000) | CPL | 687/679 | BAT+XRT |
3.2. - Relation and Implication for Redshift
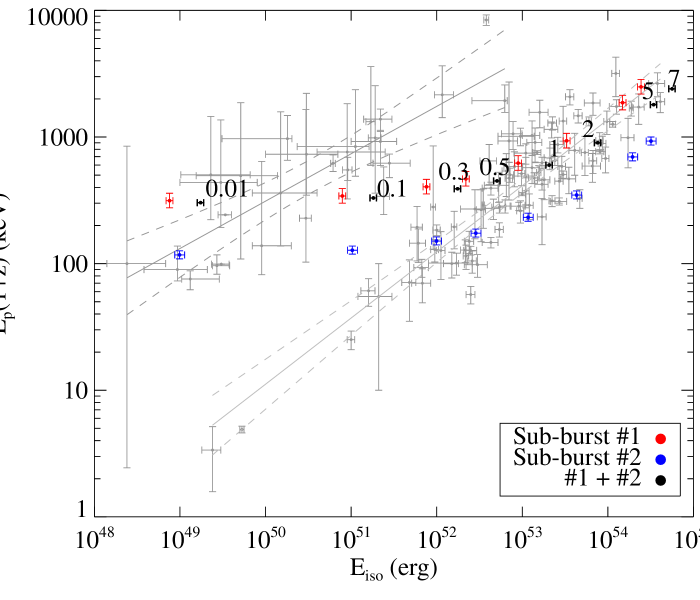
There has been no redshift measurement for GRB 110709B, so the rest-frame peak energy, , and the isotropic energy, , are unknown. On the other hand, one can assume it has a redshift and plot the corresponding and on the (Amati relation; Amati et al. 2002) diagram. The well-known Amati relation suggests that most long (or type II; Zhang et al. 2009) bursts follow the track (Amati et al. 2002, Zhang et al. 2009). Since GRB 110709B is obviously a long burst (especially with two long sub-bursts), in principle it should fall into the same track as other typical long (type II) bursts. In Fig. 9, we assign GRB 110709B onto the - diagram by assuming its redshift is in the range of . It is interesting to note that, at the average redshift () of Swift GRBs, GRB 110709B is well consistent with the previous Amati relation.
3.3. Spectral Lag
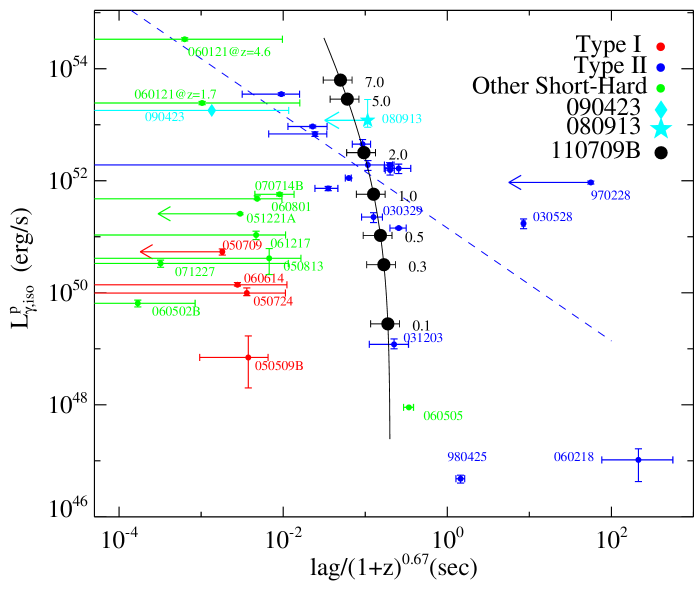
Spectral lags, which are caused by the fact that softer Gamma-ray photons usually arrive later than hard photons, are always significant in long (type II) GRBs (Norris et al. 2000; Gehrels et al. 2006; Liang et al. 2006; Zhang et al. 2009), but are typically negligible for short (type I) GRBs (Norris & Bonnell 2006; Zhang et al. 2009). In order to get high signal-to-noise ratio, we only select the brightest part (Episode I and II, as shown in Fig. 3 and listed in Table 2) of each sub-burst to calculate lags. For the first sub-burst, we extracted 32ms-binned light curves in the following four BAT energy bands: keV, keV, keV and keV and 64ms-binned light curves in the following three Konus-WIND bands: keV, keV and keV. Then, using the CCF (cross-correlation function; Norris et al. 2000, Ukwatta et al. 2010) method, we calculate the lags between any two light curves in the neighboring and next-to-neighbor energy bands within each instrument in Episode I. The uncertainty of lags are estimated by Monte Carlo simulation (see e.g., Peterson et al. 1998, Ukwatta et al. 2010) and are illustrated in Fig. 10 and 11. For the second sub-burst, we extracted 32ms-binned light curves in the same four BAT energy bands as mentioned above and three XRT energy bands: keV, keV and keV. Then using the same method we calculated the spectral lags between these energy bands. Our results are shown in Table 2. Some lags are not well-constrained possibly due to low signal-to-noise levels and the combination of multiple pulses. Yet the typical values of ms between keV and keV for the first sub-burst is similar with other long (type II) GRBs (Zhang et al. 2009). In Fig 12, we plot the luminosity-lag diagram by assuming the double burst is at redshift . We found that at the average redshift () of Swift GRBs, GRB 110709B falls into the “main track” of typical long/Type II GRBs in the luminosity-lag diagram.


| Energy Channels | Lag | |||
| (ms) | ||||
| Inst. | Episode I | Episode II | ||
| keV | keV | (0s,45s) | (640s, 660s) | |
| XRT | 0.3-2 | 2-4 | - | |
| XRT | 2-4 | 4-10 | - | |
| XRT | 0.3-2 | 4-10 | - | |
| BAT | 15-25 | 25-50 | ||
| BAT | 25-50 | 50-100 | ||
| BAT | 50-100 | 100-150 | ||
| BAT | 15-25 | 50-100 | ||
| BAT | 25-50 | 100-150 | ||
| KW | 25-95 | 95-380 | - | |
| KW | 95-380 | 380-1435 | - | |
| KW | 25-95 | 380-1435 | - | |
3.4. A Dark Burst ?
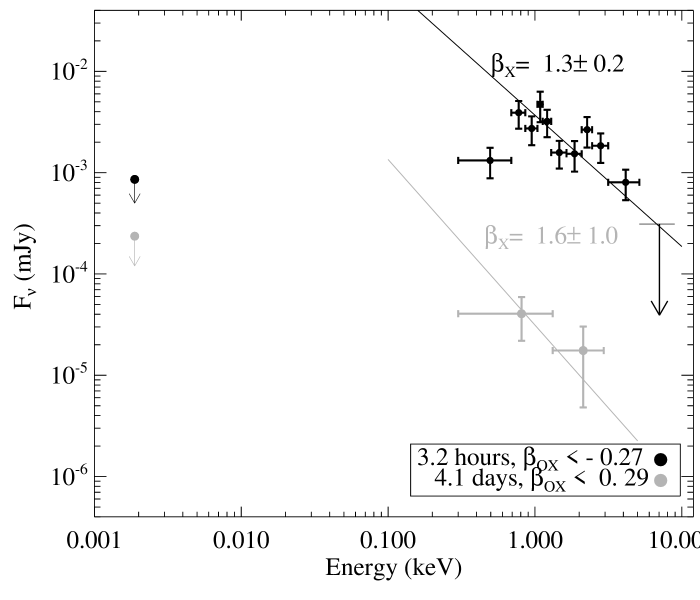
There is no optical counterpart or host galaxy observed by UVOT or any other ground telescopes for GRB 110709B. Furthermore, no cataloged extragalactic galaxy was found within radius in the NASA/IPAC Extragalactic Database (NED). Using the optical afterglow upper limits reported by Fong & Berger (2011), we plot the optical-to-X-ray SED at 3.2 hours and 4.1 days (t is relative to trigger time ) in Fig. 13. The corresponding (spectral index is defined by .) are and for the two epochs. Since bursts with are defined as “dark” (Jakobsson et al. 2004, van der Horst et al. 2009, Greiner et al. 2011), GRB 110709B is clearly an unusual dark burst with an even negative (at hours). Furthermore, the EVLA detection of the radio counterpart of GRB 110709B gives further support that GRB 110709B is a dark burst (Zauderer & Berger 2011). With a large extragalactic soft X-ray absorption (§2.1), the absence of the optical afterglow detection probably indicates a very dusty ISM environment of GRB 110709B so its optical afterglow is highly extinguished. Alternatively, it may also indicate a high redshift origin (Fong & Berger 2011) or very different radiation mechanisms between the X-ray and optical components (D’Elia & Stratta, 2011).
4. Implications for the Central Engine
Long-term central engine activities have been proved by the commonly detected X-ray flares which occur at hundreds of seconds after the burst trigger. This double burst GRB 110709B suggests that the long-term active central engine not only powers X-ray flares but also can power a second burst. Generally speaking, in order to produce a second “burst” as is observed in GRB 110709B, the central engine must restart with comparable or even larger energy. This is challenging for the following popular theoretical X-ray flare models:
-
•
Fragmentation in the massive star envelope. The collapse of a rapidly rotating stellar core leads to fragmentation (King et al. 2005). If the delayed accretion of fragmented debris leads a second burst, the debris must have comparable masses with the materials in the initial major accretion. This behavior has not been seen to date in numerical simulations (e.g., Masada et al. 2007; Lee et al. 2009; Metzger et al. 2008; Lee et al. 2009).
-
•
Fragmentation in the accretion disk. Fragmentation of an accretion disk and subsequent accretion of the fragmented blobs may power X-ray flares in both short and long GRBs (Perna et al. 2006). In order to power a second burst instead of X-ray flares, the fragmented out part of the disk should have a comparable mass to that of the inner part of the disk, which is difficult to achieve. This model also predicts that later accretion (accretion of a blob farther away from the black hole) tends to spread in a longer duration, which is suitable to interpret X-ray flares, but not the double burst.
-
•
Magnetic barrier around the accretor. Proga & Zhang (2006) argued that a magnetic barrier near the black hole may act as an effective modulator of the accretion flow. The delayed outflow can power the X-ray flares. It is difficult for this model to account for the extreme energetics of the second sub-burst, since it is expected that a magnetic barrier can only block a smaller accretion rate, and hence, can only power a less violent episode such as X-ray flares.
On the other hand, the long quiescent gap between the two sub-bursts leads us to re-think the 2-stage fallback collapsar scenario that has been used to interpret GRB precursors (Wang & Mészáros, 2007). In that scenario, the precursor is produced by a weak jet formed during the initial core collapse, possibly related to MHD processes associated with a short-lived proto-neutron star, while the main burst is produced by a stronger jet fed by fallback accretion onto the black hole resulting from the collapse of the neutron star. We found that the assumed proto-neutron star rotational energy of a few times ergs in Wang & Mészáros, 2007 would also be sufficient, when beaming is taken into account, to power the first sub-burst of GRB 110709B. In fact, simple estimates indicate that maximally rotating proto-neutron stars could reach rotational energies as high as several erg. Here, we propose a magnetar-to-BH scenario as follows:
(1) A magnetar is formed and produces the first sub-burst by releasing its rotation energy via electromagnetic and gravitational radiation in seconds (rest frame). A magnetar, rather than a lower field neutron star, is required not only to produce the high luminosity () and ( 0.6-1 MeV) of the first sub-burst (Zhang & Mészáros, 2001; Metzger et al. 2011), but also to overcome the ram pressure of the fallback matter (Wang & Mészáros, 2007). For a typical magnetar with proto-neutron star radius and mass , the ram pressure can be written as , where is the free-fall velocity and is the mass infalling rate in units of . The magnetic field pressure can be written as . Comparing the two, one 111Generally speaking, a relatively weaker magnetic field or a relatively longer initial rotation period leads to a longer magnetar spin-down time scale, and hence, the emission duration (Zhang & Mészáros, 2001). For comparison, to interpret the long plateau ( ks) in the X-ray light curve of GRB 070110, the magnetic field of a millisecond-period magnetar needs to be (Troja et al. 2007). For the case of GRB 060218 the initial spin-down period should be longer (e.g., ms instead of ms) due to the low GRB energy constraint (Soderberg et al. 2006; Mazzali et al. 2006; Toma et al. 2007). See Lyons et al. (2010), Rowlinson et al. (2010) and Fan et al. (2011) for more individual examples. can get . Such a magnetized jet internally dissipates and powers the observed gamma-ray emission (e.g. Zhang & Yan 2011; Metzger et al. 2011).
(2) After the magnetar slows down, the magnetic outflow stresses decrease, so the ram pressure of the infalling matter becomes dominant. Thus the activity of the magnetar is suppressed during the accretion process. The accretion onto the magnetar does not lead to GRB emission, since the hot NS likely launches a dirty neutrino-driven wind with heavy baryon loading. In order to form a BH, a total accreting mass of is needed. Assuming a redshift z=2, the accretion rate is about , which is consistent with theoretical predictions in the supernova fallback scenario (see e.g., MacFadyen et al. 2001).
(3) The accretion finally leads the magnetar to collapse to a black hole. The second sub-burst is produced either from a baryonic or a magnetic jet. The spectrum will be softer either because the accretion leads the gas near the central engine to be more baryon-loaded so that the jet is slower or because the pre-existing channel from the first sub-burst may not have time to close so that the wide channel results in a slower jet and a softer spectrum. The spectral evolution of the two stages would be expected to be different, since they are due to different physical process. These model features appear to be in concordance with the observed facts (see Fig 7).
5. Discussion
5.1. A Lensed Burst?
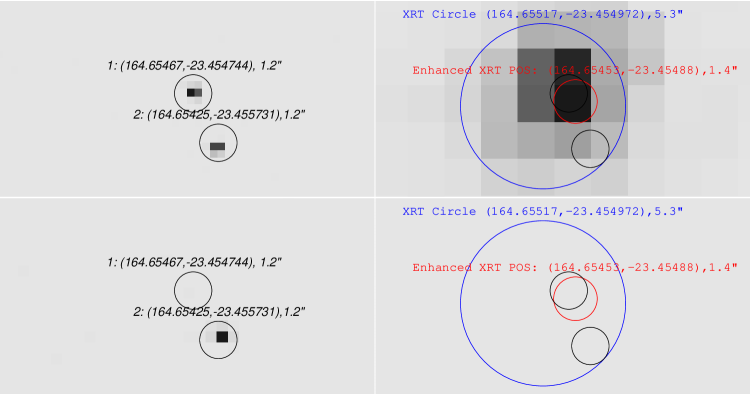
The similarity of the two sub-bursts raises the question of whether they could be produced by gravitational lensing of a single GRB located behind a foreground galaxy. To investigate this possibility, we first examined Chandra observations of GRB 110709B at 14:15:04 UT on 23 July 2011 (day 14; 15.05 ks exposure time; Observation ID 12921) and at 19:50:34 UT on 31 October 2011 (day 114; 10 ks exposure time; Observation ID 14237). We downloaded the public Chandra data from the Chandra archive222http://cda.harvard.edu/chaser and processed them using the standard CIAO tools (version 4.3). The first Chandra observation has two X-ray point sources in the field of GRB 110709B, with nearly identical brightness ( , 0.2-8 keV) and separated by only 3.4 arcseconds (Fig. 14). Source 1 is located 0.67 arcseconds from the refined XRT position, within the refined XRT error circle. Both sources are within the XRT point-spread function (18 arcseconds Half-Power-Diameter), and the sum of their fluxes is consistent with the total XRT flux measured during the first epoch, while the flux of Source 1 is consistent with the extrapolation of the XRT light curve (Fig. 2). The field was unobservable by both Chandra and Swift from about 8 August 2011 until 28 October 2011. In the second Chandra observation, taken shortly after the field emerged from the Chandra Sun (pitch angle) constraint, Source 1 has vanished, while Source 2 is still present, with a slightly lower count rate of s-1 (0.2-8 keV), consistent with being a background X-ray source such as an AGN. The upper limit for the Source 1 flux is still consistent with the extrapolation of the XRT light curve (Fig. 2). The fact that Source 1 vanished while Source 2 did not clearly rules out any possibility that the two Chandra X-ray sources in the double burst field are due to gravitational lensing.
On the other hand, assuming the time delay ( 11 minutes) between two sub-bursts is caused by gravitational lensing, we calculated that the angular separation of the two lensed images would be arcsecond (Walker & Lewis 2003), which is beyond Chanda best resolution capacity ( 0.5 arcsecond). We found that a typical dwarf galaxy at would be able to serve as the massive lensing object and cause such a separation. In this scenario, the difference between the pulse structure of the two sub-bursts can be understood by taking into account a structured jet and the so-called nanolensing effect (Walker & Lewis 2003). However the different and spectral evolution (see §3) of the two sub-bursts are still difficult to explain. We thus disfavor the gravitational lensing explanation for this burst.
5.2. A huge precursor, a huge X-ray flare, or a long quiescent gap?
GRB 110709B is a unique event. It is one out of 613 GRBs detected by Swift/XRT so far (as of 30 December 2011; Evans et al. 2009, 2011). Since nearly half of Swift GRBs have X-ray flares (Maxham & Zhang, 2009), it is roughly one out of GRBs with flares.
Comparing with other GRBs, one may wonder whether this is a burst with a huge precursor (the first sub-burst), a huge X-ray flare (the second sub-burst), or simply a long GRB that has an extremely long quiescent gap in between. We address these possibilities in turn.
-
•
A huge precursor? A good fraction333Observationally, this fraction is highly dependent on the definition of precursor and may suffer from instrumental bias. For example, Koshut et al. (1995) search a BATSE (Burst Alert and Transient Source Experiment) GRB sample and found the fraction is . On the other hand, by using a different definition, Lazzati (2005) analyzed a sample of bright, long BATSE GRBs and found the fraction is . of GRBs have a precursor leading the main burst. A precursor is generally defined as an emission episode whose peak intensity is much lower than that of the main episode, and with a quiescent separation period from the main episode (Koshut et al. 1995; Burlon et al. 2008, 2009; Troja et al. 2010). Precursors may or may not trigger the Gamma-ray detectors (Lazzati 2005). Moreover, the peak energy ( of the spectrum) of the precursors is almost always softer than the emission. Some good examples of GRBs with typical precursors are GRBs 041219A (Götz et al. 2011), 050820A (Cenko et al. 2006) and 060124444We note that the pulse structures of the main emission phase ( s) of GRB 060124 and the second sub-burst of GRB 110709B are quite similar, namely a short duration pulse followed by the main emission, then an extra soft X-ray flare. See Fig. 4 in Romano et al. 2006 for comparison. (Romano et al. 2006b). By contrast, the first sub-burst of GRB 110709B has a comparable intensity and harder than the second sub-burst, which is very different from a precursor. Nonetheless, some precursor models (e.g., Wang & Mészáros, 2007) may give hints to the theoretical explanation of the double emission episode behavior of GRB 110709B (see §4).
-
•
A giant X-ray flare? As discussed in §1, X-ray flares are generally thought to be related to late time central engine activities. The shapes of X-ray flares are always soft in spectrum and smooth () in time profile (Burrows et al. 2005a; Chincarini et al. 2007; Falcone et al. 2007). In contrast, the X-ray emission from the second sub-burst of GRB 110709B shows a spiky time profile and a higher (up to keV) than those of a typical X-ray flare. Its X-ray fluence is comparable ( 50%) to the BAT fluence of the first sub-burst. The only giant X-ray flare that reaches a fluence comparable to prompt emission was GRB 050502B (Burrows et al. 2005a; Falcone et al. 2006). However, the flare of GRB 050502B was much softer, and smoother. We thus regard the X-ray emission from the second sub-burst is more analogous to prompt emission. Using the popular X-ray flare model to interpret the second sub-burst is challenging as discussed in §4.
-
•
A long quiescent gap? GRB 110709B has a very long quiescent gap ( s). We note that this gap is unusual but not unprecedented. For example, significant long quiescent periods have been observed in some other long GRBs, such as GRB 070721B ( s ; Ziaeepour et al. 2007) and GRB 091024B ( s; Gruber et al. 2011). On the other hand, GRB 110709B is unique in the sense that the two sub-bursts separated by the gap have somewhat similar pulse shapes, comparable emission durations, comparable peak intensities, and comparable fluences. We thus regard GRB 110709B as a unique double burst. Nevertheless, there are still some similarities between it and other bursts with long gaps (especially GRB 091024, which has three comparable emission episodes). The model we propose in §4 might be applicable to those bursts as well.
6. Summary
GRB 110709B is the first GRB with two Swift/BAT triggers. We present in this paper a comprehensive study on Gamma-ray and X-ray observations of this unusual GRB and its afterglow. No optical afterglow or host galaxy has been detected for this burst. By putting this burst at redshift (average redshift of Swift GRBs), we found it can be a typical long (Type II) bursts which follows previous empirical relations (such as Amata relation, lag-luminosity relation) quite well. The dark burst nature of GRB 110709B may suggest a very dusty environment or high redshift origin or different radiation mechanisms between X-ray and optical band. Although separated by 11 minutes, the two sub-bursts may physically originate from the same central engine, which apparently requires extreme two-step activities that may be related to magnetar-to-BH accretion.
References
- (1)
- Amati et al. (2002) Amati, L., Frontera, F., Tavani, M., et al. 2002, A&A, 390, 81
- Aptekar et al. (1995) Aptekar, R. L., Frederiks, D. D., Golenetskii, S. V., et al. 1995, Space Sci. Rev., 71, 265
- Barthelmy et al. (2005) Barthelmy, S. D., Barbier, L. M., Cummings, J. R., et al. 2005, Space Sci. Rev., 120, 143
- Barthelmy et al. (2011) Barthelmy, S. D., Burrows, D. N., Cummings, J. R., et al. 2011, GRB Coordinates Network, 12124, 1
- Beardmore et al. (2011) Beardmore, A. P., Evans, P. A., Goad, M. R., & Osborne, J. P. 2011, GRB Coordinates Network, 12136, 1
- Burlon et al. (2008) Burlon, D., Ghirlanda, G., Ghisellini, G., et al. 2008, ApJ, 685, L19
- Burlon et al. (2009) Burlon, D., Ghirlanda, G., Ghisellini, G., Greiner, J., & Celotti, A. 2009, A&A, 505, 569
- Burrows et al. (2005) Burrows, D. N., Romano, P., Falcone, A., et al. 2005a, Science, 309, 1833
- Burrows et al. (2005) Burrows, D. N., Hill, J. E., Nousek, J. A., et al. 2005b, Space Sci. Rev., 120, 165
- Cenko et al. (2006) Cenko, S. B., et al. 2006, ApJ, 652, 490
- Chincarini et al. (2007) Chincarini, G., Moretti, A., Romano, P., et al. 2007, ApJ, 671, 1903
- Cummings et al. (2011) Cummings, J. R., Barthelmy, S. D., Burrows, D. N., et al. 2011a, GRB Coordinates Network, 12122, 1
- Cummings et al. (2011) Cummings, J. R., Barthelmy, S. D., Baumgartner, W. H., et al. 2011b, GRB Coordinates Network, 12144, 1
- Dainotti et al. (2010) Dainotti, M. G., Willingale, R., Capozziello, S., Fabrizio Cardone, V., & Ostrowski, M. 2010, ApJ, 722, L215
- Drago & Pagliara (2007) Drago, A., & Pagliara, G. 2007, ApJ, 665, 1227
- D’Elia & Stratta (2011) D’Elia, V., & Stratta, G. 2011, arXiv:1108.1054
- D’Elia et al. (2011) D’Elia, V., Stratta, G., & Cummings, J. R. 2011, GRB Coordinates Network, 12142, 1
- Eichler et al. (1989) Eichler, D., Livio, M., Piran, T., & Schramm, D. N. 1989, Nature, 340, 126
- Evans et al. (2009) Evans, P. A., Beardmore, A. P., Page, K. L., et al. 2009, MNRAS, 397, 1177
- Evans et al. (2011) Evans, P. A., et al. 2011, GRB Coordinates Network, 12709, 1
- Falcone et al. (2006) Falcone, A. D., Burrows, D. N., Lazzati, D., et al. 2006, ApJ, 641, 1010
- Falcone et al. (2007) Falcone, A. D., Morris, D., Racusin, J., et al. 2007, ApJ, 671, 1921
- Fan & Wei (2005) Fan, Y. Z., & Wei, D. M. 2005, MNRAS, 364, L42
- Fan et al. (2011) Fan, Y.-Z., Zhang, B.-B., Xu, D., Liang, E.-W., & Zhang, B. 2011, ApJ, 726, 32
- Fong & Berger (2011) Fong, W., & Berger, E. 2011, GRB Coordinates Network, 12155, 1
- Fryer et al. (2007) Fryer, C. L., et al. 2007, PASP, 119, 1211
- Gehrels et al. (2004) Gehrels, N., Chincarini, G., Giommi, P., et al. 2004, ApJ, 611, 1005
- Gehrels et al. (2006) Gehrels, N., Norris, J. P., Barthelmy, S. D., et al. 2006, Nature, 444, 1044
- Golenetskii et al. (2011) Golenetskii, S., Aptekar, R., Frederiks, D., et al. 2011, GRB Coordinates Network, 12135, 1
- Götz et al. (2011) Götz, D., Covino, S., Hascoët, R., Fernandez-Soto, A., Daigne, F., Mochkovitch, R., & Esposito, P. 2011, MNRAS, 413, 2173
- Greiner et al. (2011) Greiner, J., Krühler, T., Klose, S., et al. 2011, A&A, 526, A30
- Gruber et al. (2011) Gruber, D., et al. 2011, A&A, 528, A15
- Holland & Cummings (2011) Holland, S. T., & Cummings, J. R. 2011a, GRB Coordinates Network, 12140, 1
- Holland & Cummings (2011) Holland, S. T., & Cummings, J. R. 2011b, GRB Coordinates Network, 12157, 1
- Ioka et al. (2005) Ioka, K., Kobayashi, S., & Zhang, B. 2005, ApJ, 631, 429
- Jakobsson et al. (2004) Jakobsson, P., Hjorth, J., Fynbo, J. P. U., et al. 2004, ApJ, 617, L21
- King et al. (2005) King, A., O’Brien, P. T., Goad, M. R., et al. 2005, ApJ, 630, L113
- Koshut et al. (1995) Koshut, T. M., Kouveliotou, C., Paciesas, W. S., et al. 1995, ApJ, 452, 145
- Lazzati (2005) Lazzati, D. 2005, MNRAS, 357, 722
- Lazzati & Perna (2007) Lazzati, D., & Perna, R. 2007, MNRAS, 375, L46
- Lee et al. (2009) Lee, W. H., Ramirez-Ruiz, E., & López-Cámara, D. 2009, ApJ, 699, L93
- Lei et al. (2008) Lei, W.-H., Wang, D.-X., Zou, Y.-C., & Zhang, L. 2008, ChJAA, 8, 404
- Liang et al. (2006) Liang, E.-W., Zhang, B.-B., Stamatikos, M., et al. 2006, ApJ, 653, L81
- Liang et al. (2009) Liang, E.-W., Lü, H.-J., Hou, S.-J., Zhang, B.-B., & Zhang, B. 2009, ApJ, 707, 328
- Liang et al. (2010) Liang, E.-W., Yi, S.-X., Zhang, J., et al. 2010, ApJ, 725, 2209
- Lyons et al. (2010) Lyons, N., O’Brien, P. T., Zhang, B., et al. 2010, MNRAS, 402, 705
- MacFadyen & Woosley (1999) MacFadyen, A. I. & Woosley, S. E. 1999, ApJ, 524, 262
- MacFadyen et al. (2001) MacFadyen, A. I., Woosley, S. E., & Heger, A. 2001, ApJ, 550, 410
- Masada et al. (2007) Masada, Y., Kawanaka, N., Sano, T., & Shibata, K. 2007, ApJ, 663, 437
- Maxham & Zhang (2009) Maxham, A. & Zhang, B. 2009, ApJ, 707, 1623
- Mazzali et al. (2006) Mazzali, P. A., Deng, J., Nomoto, K., et al. 2006, Nature, 442, 1018
- Mészáros & Rees (1997) Mészáros, P. & Rees, M. J. 1997, ApJ, 482, L29
- Mészáros & Rees (1999) —. 1999, MNRAS, 306, L39
- Metzger et al. (2008) Metzger, B. D., Piro, A. L., & Quataert, E. 2008, MNRAS, 390, 781
- Metzger et al. (2011) Metzger, B. D., Giannios, D., Thompson, T. A., Bucciantini, N., & Quataert, E. 2011, MNRAS, 413, 2031
- Narayan et al. (1992) Narayan, R., Paczynski, B., & Piran, T. 1992, ApJ, 395, L83
- Norris et al. (2000) Norris, J. P., Marani, G. F., & Bonnell, J. T. 2000, ApJ, 534, 248
- Norris & Bonnell (2006) Norris, J. P., & Bonnell, J. T. 2006, ApJ, 643, 266
- Paczýnski (1986) Paczýnski, B. 1986, ApJ, 308, L43
- Paczýnski (1991) —. 1991, Acta Astronomica, 41, 257
- Perna et al. (2006) Perna, R., Armitage, P. J., & Zhang, B. 2006, ApJ, 636, L29
- Peterson et al. (1998) Peterson, B. M., Wanders, I., Horne, K., et al. 1998, PASP, 110, 660
- Proga & Zhang (2006) Proga, D., & Zhang, B. 2006, MNRAS, 370, L61
- Rees & Mészáros (1994) Rees, M. J. & Mészáros, P. 1994, ApJ, 430, L93
- Romano et al. (2006) Romano, P., Moretti, A., Banat, P. L., et al. 2006a, A&A, 450, 59
- Romano et al. (2006) Romano, P., Campana, S., Chincarini, G., et al. 2006b, A&A, 456, 917
- Roming et al. (2005) Roming, P. W. A., Kennedy, T. E., Mason, K. O., et al. 2005, Space Sci. Rev., 120, 95
- Rowlinson et al. (2010) Rowlinson, A., O’Brien, P. T., Tanvir, N. R., et al. 2010, MNRAS, 409, 531
- Sari et al. (1998) Sari, R., Piran, T., & Narayan, R. 1998, ApJ, 497, L17
- Sari & Piran (1999) Sari, R., & Piran, T. 1999a, ApJ, 520, 641
- Sari & Piran (1999) Sari, R., & Piran, T. 1999b, ApJ, 517, L109
- Soderberg et al. (2006) Soderberg, A. M., Kulkarni, S. R., Nakar, E., et al. 2006, Nature, 442, 1014
- Toma, Ioka, Sakamoto, & Nakamura (2007) Toma, K., Ioka, K., Sakamoto, T., & Nakamura, T. 2007, ApJ, 659, 1420
- Troja et al. (2007) Troja, E., Cusumano, G., O’Brien, P. T., et al. 2007, ApJ, 665, 599
- Troja et al. (2010) Troja, E., Rosswog, S., & Gehrels, N. 2010, ApJ, 723, 1711
- Ukwatta et al. (2010) Ukwatta, T. N., Stamatikos, M., Dhuga, K. S., et al. 2010, ApJ, 711, 1073
- van der Horst et al. (2009) van der Horst, A. J., Kouveliotou, C., Gehrels, N., et al. 2009, ApJ, 699, 1087
- Walker & Lewis (2003) Walker, M. A., & Lewis, G. F. 2003, ApJ, 589, 844
- Wang & Mészáros (2007) Wang, X.-Y., & Mészáros, P. 2007, ApJ, 670, 1247
- Woosley (1993) Woosley, S. E. 1993, ApJ, 405, 273
- Wu et al. (2005) Wu, X. F., Dai, Z. G., Huang, Y. F., & Lu, T. 2005, ApJ, 619, 968
- Yamazaki (2009) Yamazaki, R. 2009, ApJ, 690, L118
- Zauderer & Berger (2011) Zauderer, A., & Berger, E. 2011, GRB Coordinates Network, 12190, 1
- Zhang (2007) Zhang, B. 2007, ChJAA, 7, 1
- Zhang & Mészáros (2001) Zhang, B., & Mészáros, P. 2001, ApJ, 552, L35
- Zhang & Yan (2010) Zhang, B., Yan, H., 2011, ApJ, 726, 90
- Zhang et al. (2006) Zhang, B., Fan, Y. Z., Dyks, J., Kobayashi, S., Mészáros, P., Burrows, D. N., Nousek, J. A., & Gehrels, N. 2006, ApJ, 642, 354
- Zhang et al. (2009) Zhang, B., Zhang, B.-B., Virgili, F. J., et al. 2009, ApJ, 703, 1696
- Zhang et al. (2007) Zhang, B.-B., Liang, E.-W., & Zhang, B. 2007, ApJ, 666, 1002
- Ziaeepour et al. (2007) Ziaeepour, H., Barthelmy, S. D., Palmer, D., et al. 2007, GCN Report, 73, 2