Surface spin fluctuations probed with flux noise and coherence
in Josephson phase qubits
Abstract
We measure the dependence of qubit phase coherence and surface spin induced flux noise on inductor loop geometry. While wider inductor traces change neither the flux noise power spectrum nor the qubit dephasing time, increased inductance leads to a simultaneous increase in both. Using our protocol for measuring low frequency flux noise, we make a direct comparison between the flux noise spectrum and qubit phase decay, finding agreement within 10% of theory. The dependence of the measured flux noise on inductor geometry is consistent with a noise source correlation length between 6 and 400 m.
Superconducting qubits Clarke and Wilhelm (2008) are rapidly approaching the requirements needed for fault tolerant quantum computation, with recent experiments demonstrating a set of information storage, logic gates, and coherence improvements DiCarlo et al. (2010); Neeley et al. (2010); Wang et al. (2011); Paik et al. (2011). However, in recent demonstrations of both multi-qubit gates with phase qubits Bialczak et al. (2010); Mariantoni et al. (2011) and error correction with transmons Reed et al. (2011), the fidelity of the quantum process was limited by individual qubit dephasing times . This dephasing results from low frequency fluctuations in the magnetic flux used to tune the devices’ transition frequency . Traditionally, flux, transmon, and quantronium qubits have addressed this problem by idling at “sweet spots” where the first order sensitivity of device frequency to bias flux, , is zero Chiorescue et al. (2003); Koch et al. (2007a); Vion et al. (2002). This approach has limitations, however, as qubits have to be moved from their idle points to participate in multi-qubit quantum gates. Furthermore, this approach to the flux noise problem constrains the qubit design space, as devices must be carefully engineered to have a sweet spot.
Anomalous low frequency flux noise in superconducting devices has a long history in both experiment and theory Wellstood et al. (1987); Choi et al. (2009); Faoro and Ioffe (2008); Koch et al. (2007b); Sendelbach et al. (2008, 2009). Experiments with SQUIDs have found that the flux noise power spectral density , which scales with frequency approximately as , is insensitive to device size and materials; in fact no strong dependence on any device parameter has been found. Recent experiments have identified spins on the metal surfaces as the noise source Sendelbach et al. (2008, 2009), but its exact microscopic mechanism remains unknown. Experiments with qubits have measured the dependence of dephasing on the bias point, characterized by Yoshihara et al. (2006); Ithier et al. (2005); Kakuyanagi et al. (2007), and have made direct Bialczak et al. (2007) and indirect Bylander et al. (2011) measurements of the noise spectrum, but no experiment has carefully compared dephasing times with a direct measurement of the low frequency flux noise, nor has any experiment demonstrated a means of improving independently of the bias point.
In this Letter, we present measurements of dephasing times and flux noise in phase qubits designed to improve . In a circuit with increased inductance, we find an improvement in phase coherence at all bias points. We introduce a protocol for directly measuring low frequency flux noise and use this protocol to make a clear and quantitative comparison between qubit dephasing and the measured noise spectrum. With this protocol, we also report the first strong dependence of the flux noise on device geometry.
In order to motivate our redesigned qubits, we first review dephasing theory. Dephasing is caused by random fluctuations in the qubit’s transition frequency , characterized by a spectral density . For a Ramsey fringe experiment, the theoretical prediction for the time dependent decay of the qubit population probability is Martinis et al. (2003)
| (1) |
where is a lower cutoff frequency equal to the inverse of the total experiment time foo . In phase qubits, frequency fluctuations are dominated by flux noise with a nearly spectral density, , Bialczak et al. (2007), resulting in a frequency noise spectral density . Inserting this into Eq. (1), performing the integral for the case , and adding the contribution from energy loss (), yields
| (2) |
The log factor is weakly dependent on and has a numerical value of 24 in the experimental range _su . Defining the dephasing time by the equation
| (3) |
we find
| (4) |
where is the inductance of the qubit loop and is the loop current. Evidently can be increased by decreasing the sensitivity , but this incurs a decrease in the qubit’s nonlinearity , defined as . Nonlinearity is a critical figure of merit, as greater nonlinearity allows for shorter control pulses and therefore more quantum gates during the qubit’s lifetime Lucero et al. (2008). We therefore re-express in terms of according to Martinis et al. (2003), and substitute into Eq. (4), yielding
| (5) |
Here depends on other device parameters, such as capacitance and junction critical current, which control the device’s operating frequency range. As we do not wish to change the device frequency, must remain fixed. Similarly, as we wish to improve without sacrificing nonlinearity, we regard as a scaling parameter. There remain two ways to improve : raise or decrease .
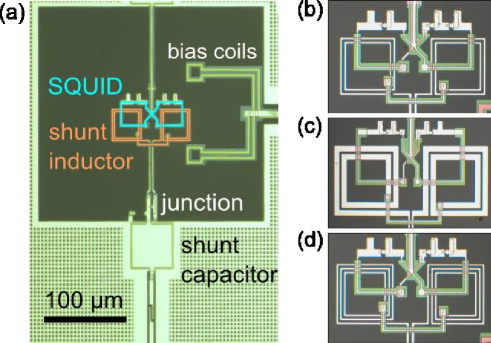
Each of these two methods was implemented though a redesign of the qubit inductor loop. The devices are pictured in Fig. 1. The standard phase qubit Martinis (2009); Neeley et al. (2008) is shown in Fig. 1a, with a close-up of the inductor coils in Fig. 1b. Coils of the first redesign are shown in Fig. 1c. Theories attributing flux noise to localized, uncorrelated magnetic moments of unpaired electron spins on the metal surfaces predict that scales as where is the radius of the metal loop and is its width Bialczak et al. (2007); Sendelbach et al. (2008). Therefore, to lower , we increased the trace widths from the standard 1.5 m to 6.0 m. The second redesign is shown in Fig. 1d. In this device, we increase the inductance of the loop by adding turns, increasing from 710 pH to 1330 pH. Increased inductance should reduce noise currents driven by noise flux and lead to better as per Eq. (5).
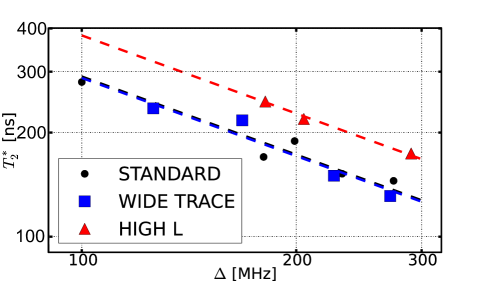
In the first set of experiments we measured at several flux bias points that varied . The exponential energy decay time and nonlinearity are first measured in separate experiments Martinis et al. (2002); Lucero et al. (2010). We then measure a Ramsey decay curve and fit the data to Eq. (3) so that the contribution from is appropriately removed in obtaining the Gaussian decay constant .
The results shown in Fig. 2 reveal that the dependence of the extracted values of on is consistent with the expected -3/4 power law. This indicates that scales inversely with the qubit frequency sensitivity, as predicted by Eq. (4). The wide trace devices show no difference in from the standard design over the measured range of operating points. Because the inductance of the wide trace design is equal to the inductance of the standard design, the lack of change in suggests that was not lowered by the increase in trace width, consistent with previous results in SQUIDs Wellstood et al. (1987). The high inductance device showed an increase in by 30% relative to the standard design at all bias points. This is our first main result: increased inductance improves the qubit’s dephasing time independently of the bias point, and without sacrificing any other figure of merit.
The disparity between the 1.30 measured improvement and the 1.87 improvement predicted by Eq. (5), based on the designed increase in , suggests that the high inductance device had an increase in flux noise. According to Eq. (5) the relative improvement in is expected to be
| (6) |
For the measured increase of 1.30 and the designed inductance increase of 1.87, Eq. (6) predicts an increase in noise amplitude of .
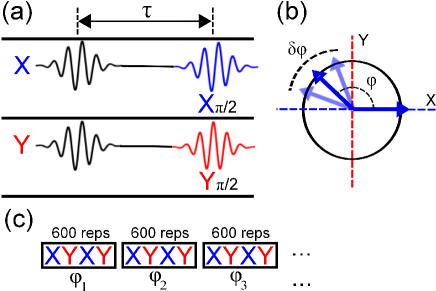
We next test these predictions for the relative noise changes against a direct measurement of the flux noise. The Ramsey fringe measurement is sensitive to the time dependent fluctuations of the qubit frequency averaged over the entire data acquisition time, and therefore measures integrals of the noise spectral density. To directly probe , one can instead track the qubit frequency in real time and then produce a spectrum with Fourier transform methods. A previous experiment with phase qubits implemented this idea by measuring the time dependent fluctuations of the position of the qubit resonance peaks Bialczak et al. (2007). The present experiment refines this idea: instead of measuring spectroscopically, we use the free precession of the qubit state in the equator of the Bloch sphere. The angle traversed by the state in a fixed time is . By choosing and measuring through partial tomography we obtain . Repetition of this measurement for several hours produces a time series . This measurement protocol, which we call the Ramsey tomography oscilloscope (RTO), is illustrated in Fig. 3. The RTO requires little calibration and can be implemented in any qubit system.
The time series is converted to a periodogram using the discrete Fourier transform, and the result is appropriately normalized to produce the power spectral density of frequency noise _su . The sensitivity is measured separately, and the flux noise spectral density is obtained from the frequency noise spectral density according to . Results are shown in Fig. 4. Note in Fig. 4a that the spectra contain little statistical noise, in contrast to the data of Ref. Bialczak et al. (2007) where the measured power spectra wandered by almost an order of magnitude within each decade of frequency.
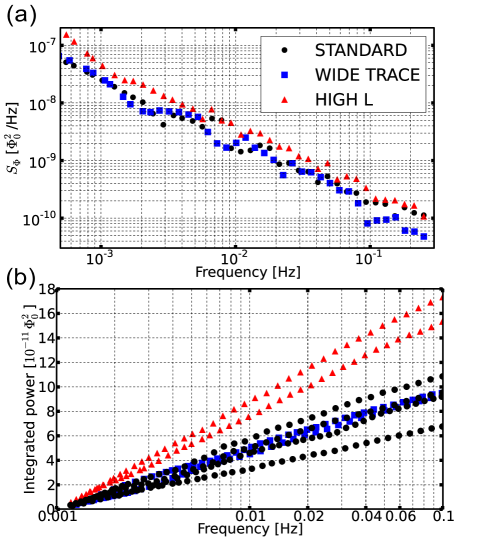
The power spectra for each type of device scale as over the measured band and have extrapolated amplitudes at 1 Hz between 3.5 and 5.0 . The spectra in Fig. 4a directly show that the high inductance device has more flux noise than the other two devices. Still, a clearer picture is obtained if we integrate the power spectral density to produce a plot of cumulative power. To avoid complications from aliasing and spectral leakage from DC, we omit the upper and lower edges of the measured frequency band, integrating only over the range to Hz where the measurement is the least susceptible to these effects Harris (1978). From the integrated power shown in Fig. 4b, it is clear that the wide trace and normal designs have the same level of noise, while the high inductance device shows a 1.7 increase in noise power.
For the wide trace devices, the lack of change in noise level relative to the standard devices is consistent with the results of the Ramsey fringe experiments in which these two designs had the same values of . For the high inductance device, the -fold increase in noise amplitude found in the RTO is in approximate agreement with the results from the Ramsey fringe experiments and Eq. (6), which predict an increase of 1.4.
We have also used the RTO to measure cross correlation in the noises of two phase qubits separated by 500 m on the same chip. We find that the measured correlation is no greater than that found for two independently simulated noise signals _su .
The scaling of the noise power with inductance, and the lack of scaling with trace aspect ratio, have implications for models of the flux noise. The lack of change with aspect ratio is incompatible with models predicting , such as the independent surface spins proposed in Ref. Bialczak et al. (2007), or single electrons interacting via the superconducting condensate as proposed in Ref. Faoro and Ioffe (2008). This may indicate a correlation length larger than the trace width. If the noise sources were correlated over the entire length of the coil, we would expect the noise power to scale quadratically with the number of coil turns, while for uncorrelated sources it would scale linearly. The high inductance devices had 50% greater number of turns than the standard devices, and we found a noise power increase of 70%, closer to the uncorrelated case. The near linear scaling is also evidence that the noise sources produce local fields; non-local fields would allow each source to couple spin into multiple turns of the coil, making the scaling of noise power with number of turns super-linear. A possible interpretation of all of these results is that the noise sources are localized, but have a correlation length that is greater than the 6 m trace width and smaller than the 400 m total length of the high inductance coil.
Thus far we have discussed the relative dephasing times and flux noise levels. It remains to check whether the the absolute measured noise levels accounts for the observed dephasing times. This is done by comparing the value of extracted from a fit to the Ramsey data with the value found directly using the RTO. Note that previous experiments with qubits have been unable to make this comparison because an accurate measurement of the flux noise was unavailable. As described by Eq. (1) and the surrounding discussion, the exact form of the Ramsey fit function depends on the scaling power . In particular, it would be inappropriate to fit the Ramsey data to Eq. (2); that equation was derived under the assumption that is equal to 1, whereas we found in the RTO that is closer to 1.1. To take the scaling power into account properly, we numerically evaluate the integral in Eq. (1) for , and use the resulting fit function to extract _su . For all devices and bias points we find that the values of extracted in this way agree with to within . We emphasize that properly accounting for the measured slope of the noise spectral density when fitting the Ramsey curves is essential in obtaining agreement between the Ramsey and RTO experiments. For example, if we take we find .
In conclusion, we have found that increased loop inductance is a viable means to improve superconducting qubit phase coherence independently of bias point. We have introduced the RTO protocol for directly measuring flux noise, and used this protocol to make a direct comparison between measured flux noise and qubit dephasing times. There we find that the noise level extracted from Ramsey decay agrees with the direct measurement only when the exact slope of the noise spectrum is considered. From another point of view, this sensitivity means that Ramsey decay times can only be accurately predicted when the scaling power of the noise is known. Using the RTO we compared the flux noise in devices with widened traces and increased number of inductor turns. With no change found in the wide traces, but a nearly linear increase in noise with number of turns, we conclude that the noise sources may be correlated over distances greater than the 6 m trace width, but smaller than the 400 m length of the inductor coils. Clearly, the correlation length of the flux noise sources is a key parameter that should be studied in further experiments.
We thank Robert McDermott for discussions on flux noise in superconductors. This work was supported by Intelligence Advanced Research Projects Activity (IARPA) under ARO award W911NF-08-1-0336 and under Army Research Office (ARO) award W911NF-09-1-0375. M. M. acknowledges support from an Elings Postdoctoral Fellowship. Devices were made at the University of California Santa Barbara Nanofabrication Facility, a part of the NSF-funded National Nanotechnology Infrastructure Network.
References
- Clarke and Wilhelm (2008) J. Clarke and F. K. Wilhelm, Nature 453 (2008).
- DiCarlo et al. (2010) L. DiCarlo, M. Reed, L. Sun, B. Johnson, J. Chow, J. Gambetta, L. Frunzio, S. Girvin, M. Devoret, and R. Schoelkopf, Nature 467, 574 (2010).
- Neeley et al. (2010) M. Neeley et al., Nature 467, 570 (2010).
- Wang et al. (2011) H. Wang et al., Phys. Rev. Lett. 106, 060401 (2011).
- Paik et al. (2011) H. Paik et al., arXiv:1105.4652 (2011).
- Bialczak et al. (2010) R. C. Bialczak et al., Nature Phys 6, 409 (2010).
- Mariantoni et al. (2011) M. Mariantoni et al., Science 334, 61 (2011).
- Reed et al. (2011) M. Reed, L. DiCarlo, S. Nigg, L. Sun, L. Frunzio, S. Girvin, and R. Schoelkopf, arXiv:1109.4948 (2011).
- Chiorescue et al. (2003) I. Chiorescue, Y. Nakamura, C. J. P. M. Harmans, and J. E. Mooij, Science 299 (2003).
- Koch et al. (2007a) J. Koch, T. M. Yu, J. Gambetta, A. A. Houck, D. I. Schuster, J. Majer, A. Blais, M. H. Devoret, S. M. Girvin, and R. J. Schoelkopf, Phys. Rev. A 76, 042319 (2007a).
- Vion et al. (2002) D. Vion, A. Aassime, A. Cottet, P. Joyez, H. Pothier, C. Urbina, D. Esteve, and M. H. Devoret, Science 295 (2002).
- Wellstood et al. (1987) F. C. Wellstood, C. Urbina, and J. Clarke, Appl. Phys. Lett. 50 (1987).
- Choi et al. (2009) S.K. Choi, D.-H. Lee, S. G. Louie, and J. Clarke, Phys. Rev. Lett. 103, 197001 (2009).
- Faoro and Ioffe (2008) L. Faoro and L. B. Ioffe, Phys. Rev. Lett. 100, 227005 (2008).
- Koch et al. (2007b) R. H. Koch, D. P. DiVincenzo, and J. Clarke, Phys. Rev. Lett. 98, 267003 (2007b).
- Sendelbach et al. (2008) S. Sendelbach, D. Hover, A. Kittel, M. Mück, J. M. Martinis, and R. McDermott, Phys. Rev. Lett. 100, 227006 (2008).
- Sendelbach et al. (2009) S. Sendelbach, D. Hover, M. Mück, and R. McDermott, Phys. Rev. Lett. 103, 117001 (2009).
- Yoshihara et al. (2006) F. Yoshihara, K. Harrabi, A. Niskanen, Y. Nakamura, and J. S. Tsai, Phys. Rev. Lett. 97 (2006).
- Ithier et al. (2005) G. Ithier et al., Phys. Rev. B 72, 134519 (2005).
- Kakuyanagi et al. (2007) K. Kakuyanagi, T. Meno, S. Saito, H. Nakano, K. Semba, H. Takayanagi, F. Deppe, and A. Shnirman, Phys. Rev. Lett. 98, 047004 (2007).
- Bialczak et al. (2007) R. C. Bialczak et al., Phys. Rev. Lett. 99, 187006 (2007).
- Bylander et al. (2011) J. Bylander, S. Gustavsson, F. Yan, F. Yoshihara, K. Harrabi, G. Fitch, D. G. Cory, Y. Nakamura, J.-S. Tsai, and W. D. Oliver, Nature Phys 7, 565 (2011).
- Martinis et al. (2003) J. M. Martinis, S. Nam, J. Aumentado, K. M. Lang, and C. Urbina, Phys. Rev. B 67, 094510 (2003).
- (24) This formula was derived in Martinis et al. (2003) as an approximation for the case of small noise. It is exact for Gaussian noise.
- (25) See supplemental material.
- Lucero et al. (2008) E. Lucero, M. Hofheinz, M. Ansmann, R. C. Bialczak, N. Katz, M. Neeley, A. D. O’Connell, H. Wang, A. N. Cleland, and J. M. Martinis, Phys. Rev. Lett. 100, 247001 (2008).
- Martinis (2009) J. M. Martinis, Quantum Information Processing 8, 81 (2009).
- Neeley et al. (2008) M. Neeley, M. Ansmann, R. C. Bialczak, M. Hofheinz, N. Katz, E. Lucero, A. O’Connell, H. Wang, A. N. Cleland, and J. M. Martinis, Phys. Rev. B 77, 180508 (2008).
- Martinis et al. (2002) J. M. Martinis, S. Nam, J. Aumentado, and C. Urbina, Phys. Rev. Lett. 89, 117901 (2002).
- Lucero et al. (2010) E. Lucero et al., Phys. Rev. A 82, 042339 (2010).
- Harris (1978) F. J. Harris, Proc. IEEE 66, 51 (1978).