Search for the rare decays at LHCb
Abstract:
A search for the and decays is presented using pb-1 of collisions at = 7 TeV collected by the LHCb experiment at the Large Hadron Collider at CERN. The measured upper limit for the branching ratio of the decay is () at 90 % (95 %) confidence level (CL), while in the case of the decay the measured upper limit is () at 90 % (95 %) CL. A combination with the 2010 dataset results in () at 90 % (95 %) CL.
1 Introduction
Measurements at low energies may provide interesting indirect constraints on the masses of particles that are too heavy to be produced directly. This is particularly true for Flavour Changing Neutral Currents (FCNC) processes which are highly suppressed in the Standard Model (SM) and can only occur through higher order diagrams. The SM prediction for the branching ratios () of the FCNC decays and have been computed to be and respectively [1]. However New Physics (NP) contributions can significantly enhance these values.
The best published limits from the Tevatron at CL are obtained using 6.1 fb-1 by the D0 collaboration [2], and using 2 fb-1 by the CDF collaboration [3]. The CDF collaboration has also presented a preliminary result [4] with 6.9 fb-1 in which an excess of candidates is reported, compatible with a ()= .
The LHCb collaboration has previously obtained the limits () and () at 95 CL based on 37 pb-1 of luminosity collected in the 2010 run [5]. We present here a measurement based on 300 pb-1 of integrated luminosity collected between March and June 2011.
2 Analysis strategy
The general structure of the analysis is similar to the one described in Ref. [5] and is detailed in Ref. [6].
The selection procedure treats signal and control/normalization channels in the same way in order to minimize the systematic uncertainties. Assuming the SM branching ratio and the cross-section, measured within the LHCb acceptance, of b [7], approximately () events are expected to be reconstructed and selected in the analysed sample.
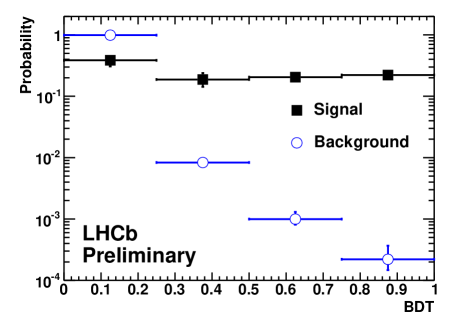
After the selection, each event is given a probability to be signal or background in a two-dimensional space defined by two independent likelihoods: the invariant mass and the output of a Boosted Decision Tree (BDT) from the TMVA package [8]. The combination of variables entering the BDT is optimized using Monte Carlo (MC) simulation. The following variables have been used: the lifetime, impact parameter and transverse momentum of the , the minimum impact parameter significance of the muons, the distance of closest approach between the two muons, the degree of isolation of the two muons with respect to any other track in the event, the cosine of the polarization angle, the isolation and the minimum of the muons. The BDT distribution is then transformed in order to be flat for the signal and peaked at 0 for the background.
The calibration of the invariant mass and the BDT likelihoods are obtained from data using control samples. The signal BDT shape is obtained from events free from trigger biases while the background shape is obtained using sideband candidates. The resulting distributions are shown in Fig. 1.
The parameters describing the invariant mass line shape of the signal are extracted from data using control samples. The average mass values are obtained from and exclusive samples. The and mass resolutions are estimated by interpolating the ones obtained with the dimuon resonances ( and ) and cross-checked via a fit to the invariant mass distribution of the inclusive decays and of the exclusive decay. The interpolation yields .
The number of expected signal events is obtained by normalizing to channels of known branching ratios, , , and , that are selected in a way as similar as possible to the signal.
The probability for a background event to have a given BDT and invariant mass value is obtained by a fit of the mass distribution of events in the mass sidebands, in bins of BDT. Different fit functions and mass ranges are used to compute the systematics uncertainties. The two-dimensional space formed by the invariant mass and BDT is binned, and for each bin we compute how many events are observed in data, how many signal events are expected for a given hypothesis and luminosity, and how many background events are expected for a given luminosity. The compatibility of the observed distribution of events in all bins with the expected one for a given hypothesis is computed using the CLs method [9], which allows to exclude a given hypothesis at a given confidence level.
In order to avoid unconscious biases, the data in the mass region defined by and have been blinded until the completion of the analysis.
3 Results
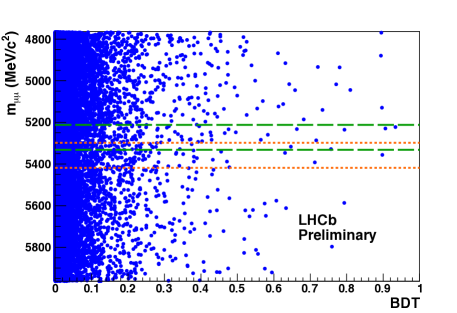
The distribution of events in the invariant mass versus BDT plane is reported Fig. 2. The expected limit at 90 (95) % CL for the is in the case of background only hypothesis. When adding signal events according to the SM branching fraction, these limits become . The observed values for the channel is with a CLb value of 0.80. The observed events are in good agreement with the background expectations and the presence of events according to SM predictions.
For the , the expected limit at 90 (95) % CL is in the case of background only hypothesis. The observed values is with a CLb value of 0.79. The comparison of the observed distribution of events with the expected background distribution results in a p-value (1-) of 20 % (21 %) for the () decays. In the case of , the slightly low p-value is due to an excess of the observed events in the most sensitive BDT bin with respect to the background expectations. A larger data sample will allow to clarify the situation. In the case of , when a signal is included at the level expected in the Standard Model, the p-value increases to 50 %.
Finally, the limit is combined with the one published from the 2010 data to obtain () ¡ at 90 % (95 %) CL. This 90 % CL upper limit is still 3.8 times above the standard model prediction.
References
- [1] A.J. Buras, G. Isidori and P. Paradisi, “EDMs vs CPV in mixing in two Higgs doublet models with MFV”, arXiv:1007.5291 [hep-ph] (2010).
- [2] V. Abazov et al. [D0 Collaboration], “Search for the rare decay ”, Phys. Lett. B 693 (2010) 539.
- [3] T. Aaltonen et al. [CDF Collaboration], “Search for and Decays with 2 of Collisions” Phys. Rev. Lett. 100 (2008) 101802.
- [4] T. Aaltonen et al. [CDF Collaboration], “Search for and Decays with CDF-II” , arXiv:1107.2304v1 [hep-ex] (2011).
- [5] R. Aaji et al. [LHCb Collaboration], “Search for the rare decays and ”, Phys. Lett. B 699 (2011) 330.
- [6] R. Aaji et al. [LHCb Collaboration], LHCb-CONF-2011-037.
- [7] R. Aaij et al. [LHCb Collaboration], “Measurement of (pp X) at =7 TeV in the forward region”, Phys. Lett. B 694 (2010) 209.
- [8] TMVA, Toolkit for Multi Variate analysis with ROOT, http://tmva.sourceforge.net.
- [9] A. Read, “Presentation of Search Results: The Technique”, J. Phys. G 28 (2002) 2693.