A Successful Broad-band Survey for Giant \lya Nebulae I: Survey Design and Candidate Selection
Abstract
Giant \lya nebulae (or \lya “blobs”) are likely sites of ongoing massive galaxy formation, but the rarity of these powerful sources has made it difficult to form a coherent picture of their properties, ionization mechanisms, and space density. Systematic narrow-band \lya nebula surveys are ongoing, but the small redshift range covered and the observational expense limit the comoving volume that can be probed by even the largest of these surveys and pose a significant problem when searching for such rare sources. We have developed a systematic search technique designed to find large \lya nebulae at within deep broad-band imaging and have carried out a survey of the 9.4 square degree NOAO Deep Wide-Field Survey (NDWFS) Boötes field. With a total survey comoving volume of 108 h Mpc3, this is the largest volume survey for \lya nebulae ever undertaken. In this first paper in the series, we present the details of the survey design and a systematically-selected sample of 79 candidates, which includes one previously discovered \lya nebula.
Subject headings:
galaxies: formation — galaxies: evolution — galaxies: high-redshift — galaxies: surveys1. Introduction
Giant radio-quiet \lya nebulae (e.g., Francis et al., 1996; Steidel et al., 2000; Palunas et al., 2004; Matsuda et al., 2004; Dey et al., 2005; Saito et al., 2006; Nilsson et al., 2006; Smith & Jarvis, 2007; Greve et al., 2007; Yang et al., 2009) likely provide an observational window into the physics of ongoing massive galaxy formation. As large as 100 kpc across, \lya nebulae emit copious \lya emission ( erg s-1), signaling the presence of highly energetic phenomena. \lya nebulae are sometimes surrounded by or associated with young, star-forming galaxy populations and obscured AGN (e.g., Chapman et al., 2001; Basu-Zych & Scharf, 2004; Matsuda et al., 2004; Dey et al., 2005; Geach et al., 2007, 2009, Prescott et al. 2012c, submitted) and have been shown to reside in overdense environments (Matsuda et al., 2004, 2005, 2009; Saito et al., 2006; Prescott et al., 2008; Yang et al., 2009, 2010). Studying \lya nebulae can provide important insight into the process of galaxy formation, but after a decade of study, we have not yet developed a complete understanding of the dominant power source or, even more fundamental, the space density of \lya nebulae.
The problem lies in having such a small sample - only a few dozen large ( kpc) \lya nebulae are currently known - and in attempting to measure the space density of a rare population over restricted volumes. Radio-quiet \lya nebulae were first discovered in targeted narrow-band imaging studies of known overdensities (e.g., Francis et al., 1996; Steidel et al., 2000; Matsuda et al., 2004). Since then, the sample has slowly grown as a result of ever more expensive narrow-band surveys over increasingly wide areas (e.g., Nilsson et al., 2006; Smith & Jarvis, 2007; Saito et al., 2006; Yang et al., 2009, 2010; Matsuda et al., 2011). Building a sufficient sample of such rare objects over a wide range of environments and accurately measuring their space density requires surveying larger comoving volumes than are typically feasible via standard narrow-band imaging.
We have therefore taken a complementary approach by developing a systematic search algorithm to find luminous \lya nebulae at using deep broad-band imaging and have tested the technique using archival imaging data from the NOAO Deep Wide-Field Survey (NDWFS; Jannuzi & Dey, 1999). We describe our systematic broad-band \lya nebula survey in three papers. This paper (Paper I) discusses the survey design and candidate selection approach. In Section 2, we describe the algorithm used to select \lya nebulae. Section 3 presents the sample of 39 first priority and 40 second priority \lya nebula candidates selected from archival imaging of the Boötes Field of NDWFS and discusses the potential sources of contamination. In Section 4, we address the complementarity of our approach relative to traditional narrow-band surveys, and we conclude in Section 5. Discussions of (a) our successful spectroscopic follow-up campaign and (b) the survey selection function and implied \lya nebula number density are presented in the two subsequent papers in this series (Prescott et al. 2012b and Prescott et al. 2013, in preparation; hereafter, Paper II and III).
We assume the standard CDM cosmology (, , ); 1″ corresponds to a physical scales of 8.5-7.6 kpc for redshifts of . All magnitudes are in the AB system.
2. Survey Design
While most of the early examples of the \lya nebula class were found via narrow-band surveys of known galaxy overdensities, one of the largest \lya nebulae was discovered in a very different manner (LABd05; Dey et al., 2005). This \lya nebula at came to light during a study of strong 24m sources detected by the Spitzer Space Telescope in the NDWFS Boötes field. Strikingly, this source had a diffuse, extended morphology and very blue colors in deep broad-band imaging. The authors suspected and spectroscopically confirmed that \lya line and blue continuum emission were dominating the broad-band flux and that the diffuse morphology indicated the presence of a giant, spatially extended \lya nebula.
Inspired by this discovery, we developed a search for \lya nebulae designed to work on deep broad-band imaging and applied it to the 9 square degree NDWFS Boötes field dataset. Using a deep, wide-area, ground-based imaging survey like NDWFS allows us to probe an enormous comoving volume with existing data and significantly reduce the amount of new telescope time required to complete the program. In that sense, our survey is complementary to the more sensitive but smaller volume narrow-band \lya nebulae surveys (e.g., Matsuda et al., 2004; Saito et al., 2006; Smith & Jarvis, 2007; Yang et al., 2009, 2010; Matsuda et al., 2011). In this section we describe the NDWFS dataset and introduce the search algorithm used to select a sample of \lya nebulae candidates.
2.1. NDWFS Broad-band Data
Our survey technique was built and tested using the broad-band optical imaging from NDWFS, data which are available through the NOAO Science Archive.111NOAO Science Archive: http://archive.noao.edu/nsa/ The and -band images of the 9.4 square degree Boötes field were obtained using the Mayall 4m Telescope and the MOSAIC 1 prime focus camera. The Boötes field was originally selected as a field suitable for a deep extragalactic survey because of its low 100m background and N(Hi) column density along the line of sight, and for being well positioned from Kitt Peak National Observatory during a period of the year with historically good observing conditions. The entire Boötes field was covered using stacked observations of 27 overlapping MOSAIC pointings. The resulting median seeing was 1.10″ and 1.10″ in the and bands, respectively, and the median point-source depths were 26.3 and 25.2 AB mag (5; 2″ diameter apertures). The median 1 surface brightness limit is 28.9 mag arcsec-2 (1.1″ diameter apertures), which corresponds (in the case of pure line emission) to a line flux surface brightness limit of erg s-1 cm-2 arcsec-2. The data were reduced by the NDWFS team using IRAF222NDWFS Data Processing: http://www.noao.edu/noao/noaodeep/.
2.2. The Search Algorithm
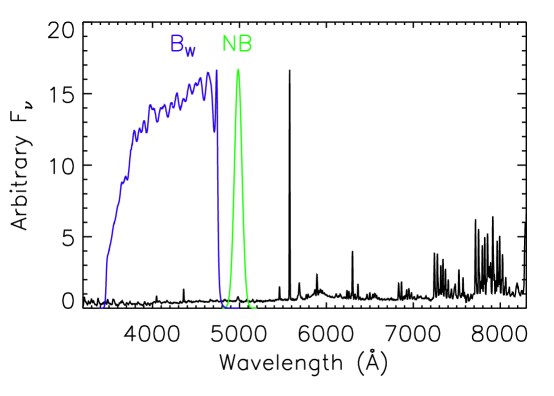
The goal of our systematic survey was to find large, luminous \lya nebulae similar to LABd05. The search pipeline uses a blue broad-band image — in the case of the NDWFS, the -band — as the primary search image and is tuned to find diffuse, spatially extended, low surface brightness objects. It is most sensitive to extended sources for which a bright \lya emission line boosts the broad-band flux relative to the very dark sky in the blue (Figure 1), i.e., the largest and brightest \lya nebulae. A redder band — the -band in the case of NDWFS — is used to derive secondary color information.
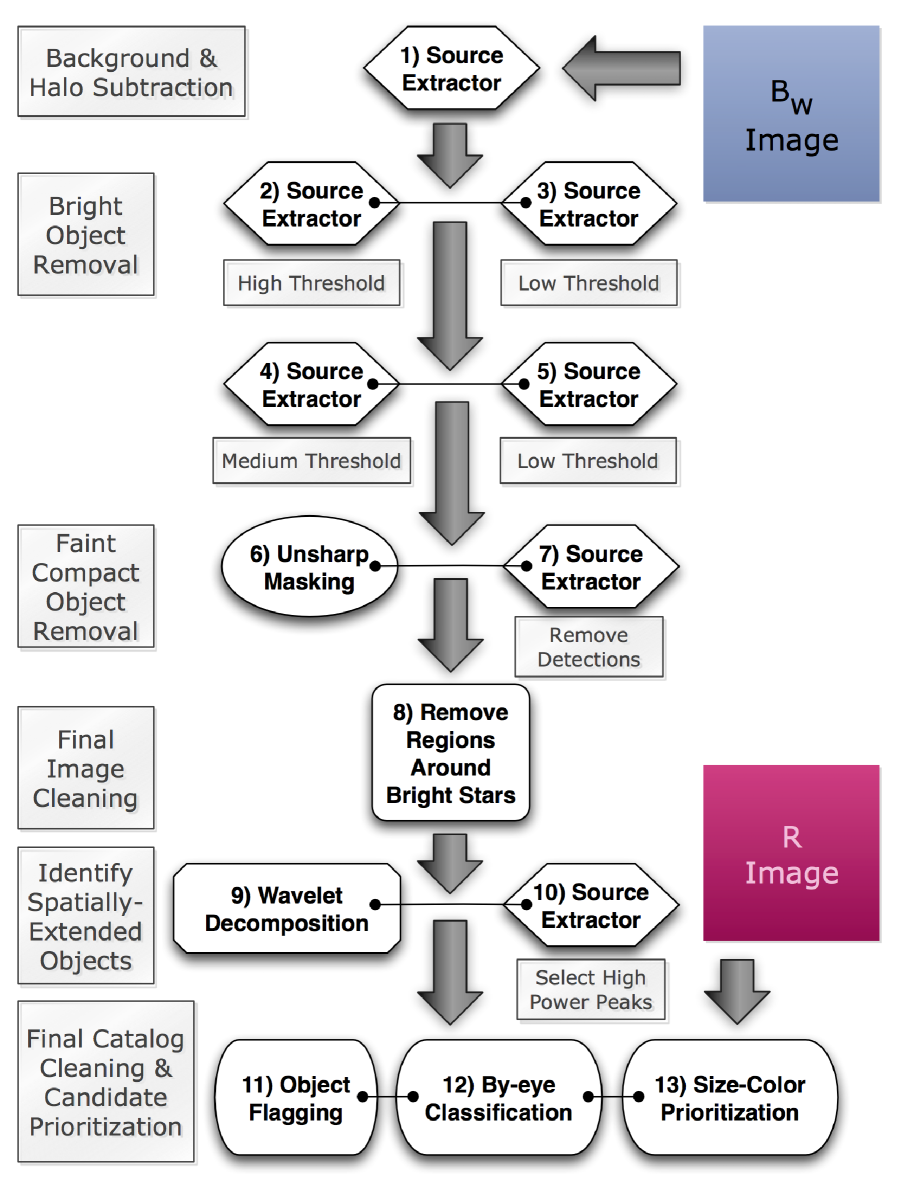
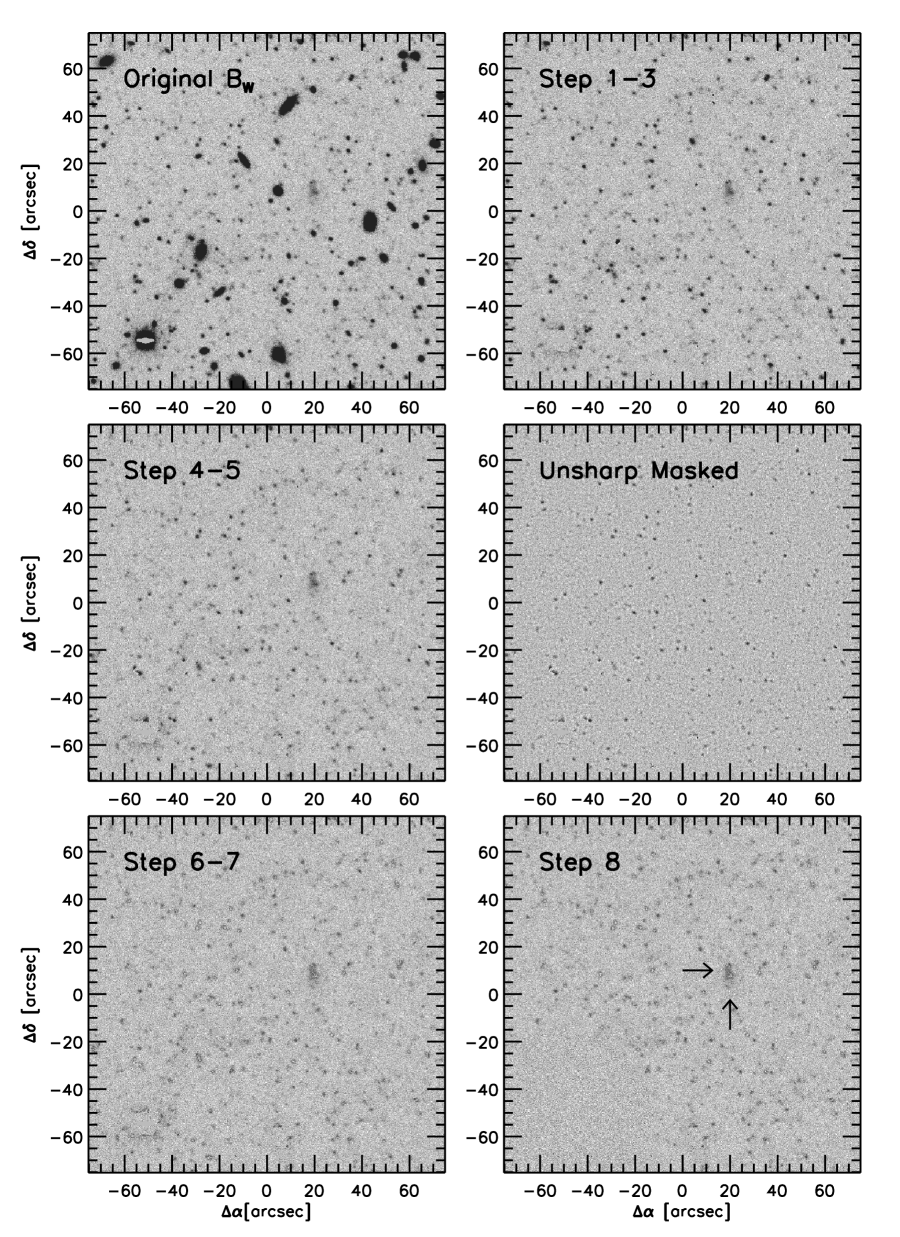
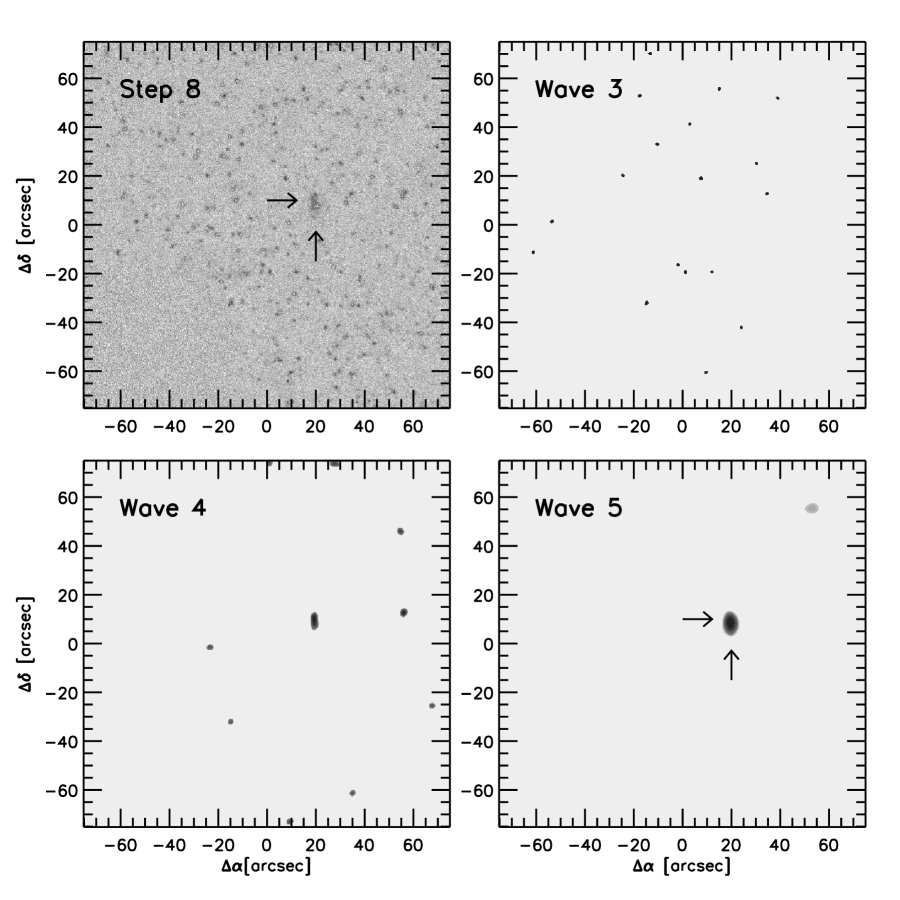
Given the depth and the size of the imaging survey, in designing our search algorithm it was important to minimize the number of contaminant objects while retaining objects likely to be \lya nebulae. Our search strategy therefore involved first subtracting off bright galaxies and compact objects and then using a wavelet deconvolution algorithm to select diffuse, spatially extended, low surface brightness objects with blue colors. The search pipeline steps are described in detail below and illustrated using a flowchart333Flowchart created using Omnigraffle: http://www.omnigroup.com/products/omnigraffle/ in Figure 2. Figures 3 and 4 show the pipeline at work on the image region near LABd05.
2.2.1 Background and Halo Subtraction
Step 1: The first step is to remove the sky background using a background map generated by Source Extractor (Version 2.4.4; Bertin & Arnouts, 1996). We used a high detection threshold (detect_thresh 10 per pixel), set background parameters (back_size 64 and back_filtersize 3), and required a minimum of 5 connected pixels (detect_minarea 5). This background map, which includes a contribution from the halos around bright stars, was subtracted from the search image.
2.2.2 Bright Object Removal
In order to remove bright stars and galaxies that may contaminate the final candidate list, we employed the following procedure.
Step 2: We first ran Source Extractor with a high detection threshold (detect_thresh10 per pixel) and a minimum of 5 connected pixels (detect_minarea5) in order to generate a catalog of bright sources.
Step 3: We then ran Source Extractor with a very low threshold (detect_thresh per pixel) in order to generate a deep segmentation map, i.e., a map of all object pixels, that would include pixels in the faint wings of bright stars and galaxies. This iteration used the assoc mode in which the catalog from Step 2 was used as an input to Source Extractor and only those detections that match were included in the catalog. Detected sources were matched against the input catalog in a weighted fashion based on measured pixel position (x_image, y_image), the object flux (flux_auto), and a search radius (assoc_radius2 pixels). Using the deep segmentation maps from this step and the image rms maps, we replaced regions identified with bright stars and galaxies with patches of sky noise.
Step 4: We ran Source Extractor on the “cleaned” image from Step 3 but this time with an intermediate threshold (detect_thresh6 per pixel, determined based on visual inspection) to further remove stars and galaxies.
Step 5: We ran Source Extractor on the image from Step 4 with the assoc feature in order to generate the corresponding deep segmentation map. Again, the detections are replaced with sky noise.
2.2.3 Faint Compact Object Removal
Step 6: We next used unsharp masking to remove fainter objects with compact morphology. An unsharp masked image was produced by smoothing the image from Step 5 using an pixel kernel and then subtracting the smoothed image from the original Step 5 image. In this process, diffuse emission was removed, leaving only compact sources in the unsharp masked image.
Step 7: We performed another assoc Source Extractor run on the unsharp masked image in which we only allowed matched detections to be included in the catalog, i.e., anything detected in both the Step 5 image and the unsharp masked image was reported. We removed these object regions by replacing them with sky noise, and in this way removed additional faint compact sources from the image.
2.2.4 Final Image Cleaning
Step 8: To avoid artifacts (e.g., saturated columns, poorly-subtracted halos) from bright stars being selected as sources later in the pipeline, we replaced the regions around bright stars ( mag in the USNO-A2.0 catalog) out to a radius of 150 pixels (″) with sky noise. This step removed 0.68 square degrees from the final survey area.
2.2.5 Identification of Spatially Extended Objects
Step 9: We then applied a wavelet decomposition algorithm to decompose the image into maps showing the power on a number of different spatial scales.
The basic idea behind wavelet decomposition is to decompose the image into a set of “wavelet planes,” each of which contains the flux of sources with power on that scale and the sum of which is the original image (ignoring losses). The power of the wavelet decomposition approach is to reduce the interference of small scale objects when looking for large scale structures.
We use the wavelet decomposition code wvdecomp444wvdecomp was written by Alexey Vikhlinin; zhtools documentation and source code: http://hea-www.harvard.edu/RD/zhtools/. to filter the image across six size scales (, , , , ). Here we give a brief description of the algorithm; a detailed discussion of the code is given in the zhtools documentation. The wvdecomp algorithm uses an à trous wavelet kernel which is defined as the difference between two functions ( and ) that each roughly resemble a Gaussian of width . On each scale, the kernel is sensitive to objects of the same size ().
The algorithm begins by convolving the image with the smallest wavelet kernel. Any features that are insignificant in the convolved image are zeroed and the result is subtracted from the original image, causing a majority of the flux from small features comparable in size to the smallest wavelet kernel to be removed. The process is repeated with larger and larger wavelet kernels, and the results from each step are saved as wavelet power maps or “wavelet planes.” To minimize the loss of information at each step, two thresholds are specified in running the code: a detection threshold, tmax, and a filtering threshold, tmin, both defined in terms of the image noise. A source detected on a given scale above tmin is counted as significant only if the source local maximum also exceeds tmax.
Step 10: We used the known \lya nebula LABd05 to empirically determine the appropriate scale for large \lya nebulae. Using one final run of SourceExtractor, we generate a catalog of sources in the wavelet power map and select those with wavelet power peaks above 4, chosen to minimize the number of total candidates while preserving sources like LABd05.
2.2.6 Final Catalog Cleaning and Candidate Prioritization
Step 11: Sources drawn from low exposure time regions of the survey (4000 sec) as well as those found in regions that had been flagged in previous steps were removed from the candidate list. This step removed 0.28 square degrees from the final survey area.
Step 12: Postage stamps of candidates were inspected visually and classified by eye using morphological flags, where star denotes a star halo, galaxy denotes a galaxy halo, tidal/arm indicates tidal tails or spiral arms, group corresponds to a tight grouping of compact sources selected as a single large source, and diffuse indicates spatially extended diffuse emission. The 2266 sources selected by the morphological search pipeline were categorized as follows: 738 star sources, 491 galaxy sources, 170 tidal/arm sources, 459 group sources, and 408 diffuse sources. We removed those objects categorized as star, galaxy, and tidal/arm from the candidate sample (1399 sources), since these are easy to classify unambiguously by eye. As the distinction between categories group and diffuse is more subjective, both category group and diffuse objects were included in the final sample (867 sources).
2.2.7 Candidate Selection
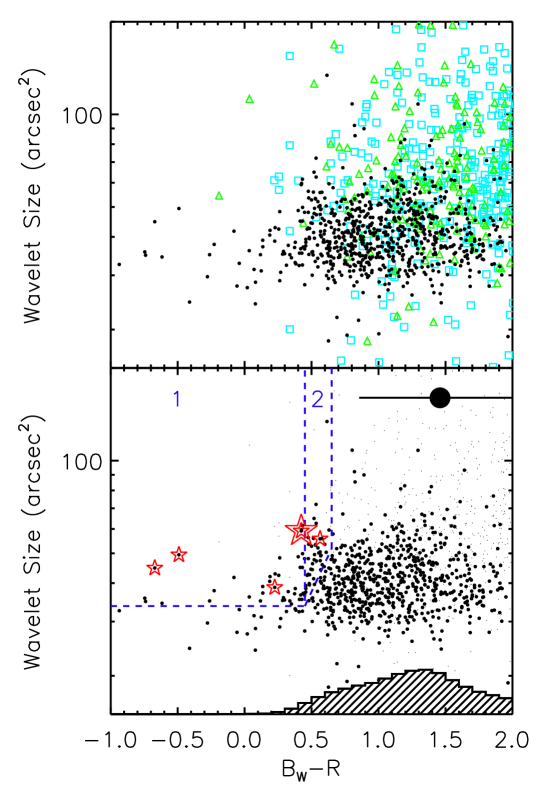
Step 13: The final sample was then prioritized based on color and size, giving priority to blue candidates with large sizes. Figure 5 shows the size and color distribution of the candidate sample. We measured colors in the original images using large apertures (30 pixel, 7.7″ diameter, i.e., roughly 60 kpc; aperture sky subtraction). The size of each source, for the purposes of selecting candidates, was taken to be the size measured in the wavelet power map (isoarea_world in square degrees), as determined by SourceExtractor during the final search (Step 10). While representative, this “wavelet size” should not be taken to be the true size of the object. The wavelet size typically underestimates the nebular extent in cases where some portion of that object has been rejected during the pipeline (due to compact sources within or adjacent to the diffuse emission). In addition, as we are attempting to detect line emission within the broad band, the measured sizes will underestimate the true nebular size. We investigate this in more detail in Paper II.
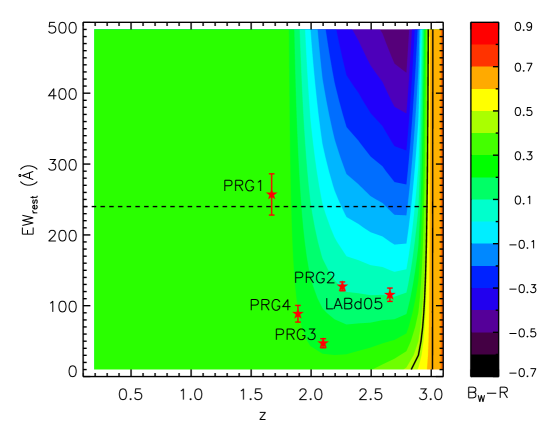
The majority of the morphologically-selected candidates are red (), but a small subset show blue colors, which could either result from a strong emission line within the band (\lya at ), from very blue continuum emission, or a combination. Figure 6 shows the expected color for a model source with a given redshift and \lya equivalent width generated by adding a Gaussian emission line to a flat spectrum source (). Unlike narrow-band \lya nebula surveys, our survey is not formally equivalent width limited. Other than at the high redshift end of the survey (), sources of any equivalent width will fall within our color selection window as long as they are spatially extended enough and bright enough in to be selected via the morphological search pipeline. However, given the distribution of field galaxy colors we expect that sources with bluer colors are more likely to be \lya nebulae. Given the number of candidates we expected to be able to target during our spectroscopic follow-up campaign, we therefore defined our first priority region as and isoarea_world arcsec2 and a second priority region as and Log(isoarea_world) arcsec2 (Figure 5). Our spectroscopic follow-up observations (using the MMT/Blue Channel Spectrograph with a full wavelength range of Å) are able to detect line emission from \lya nebulae down to , leading to a total survey redshift range of . The details of our selection function will be treated in Paper III.
3. Candidate Sample
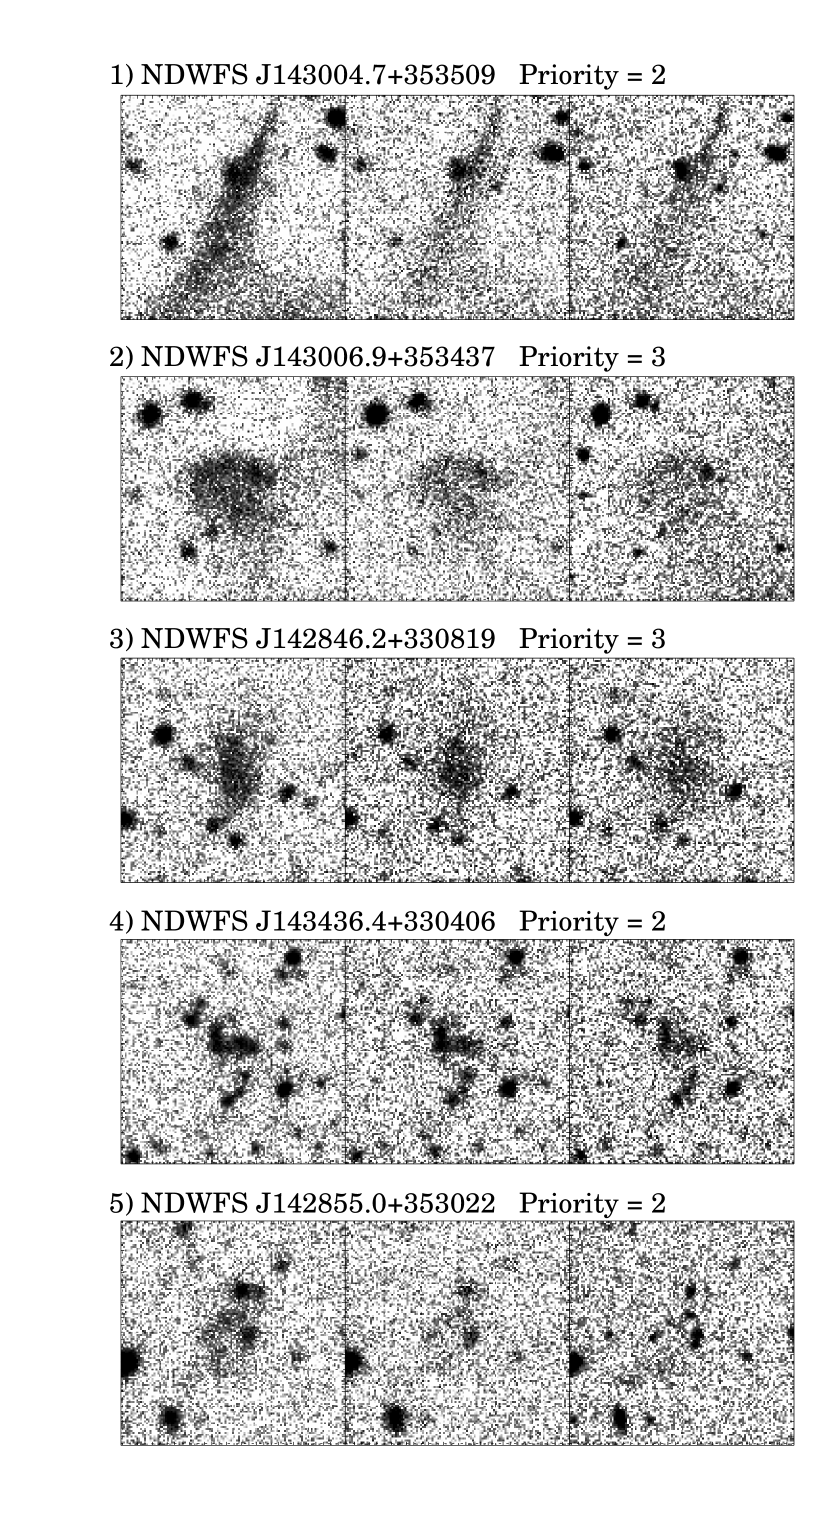
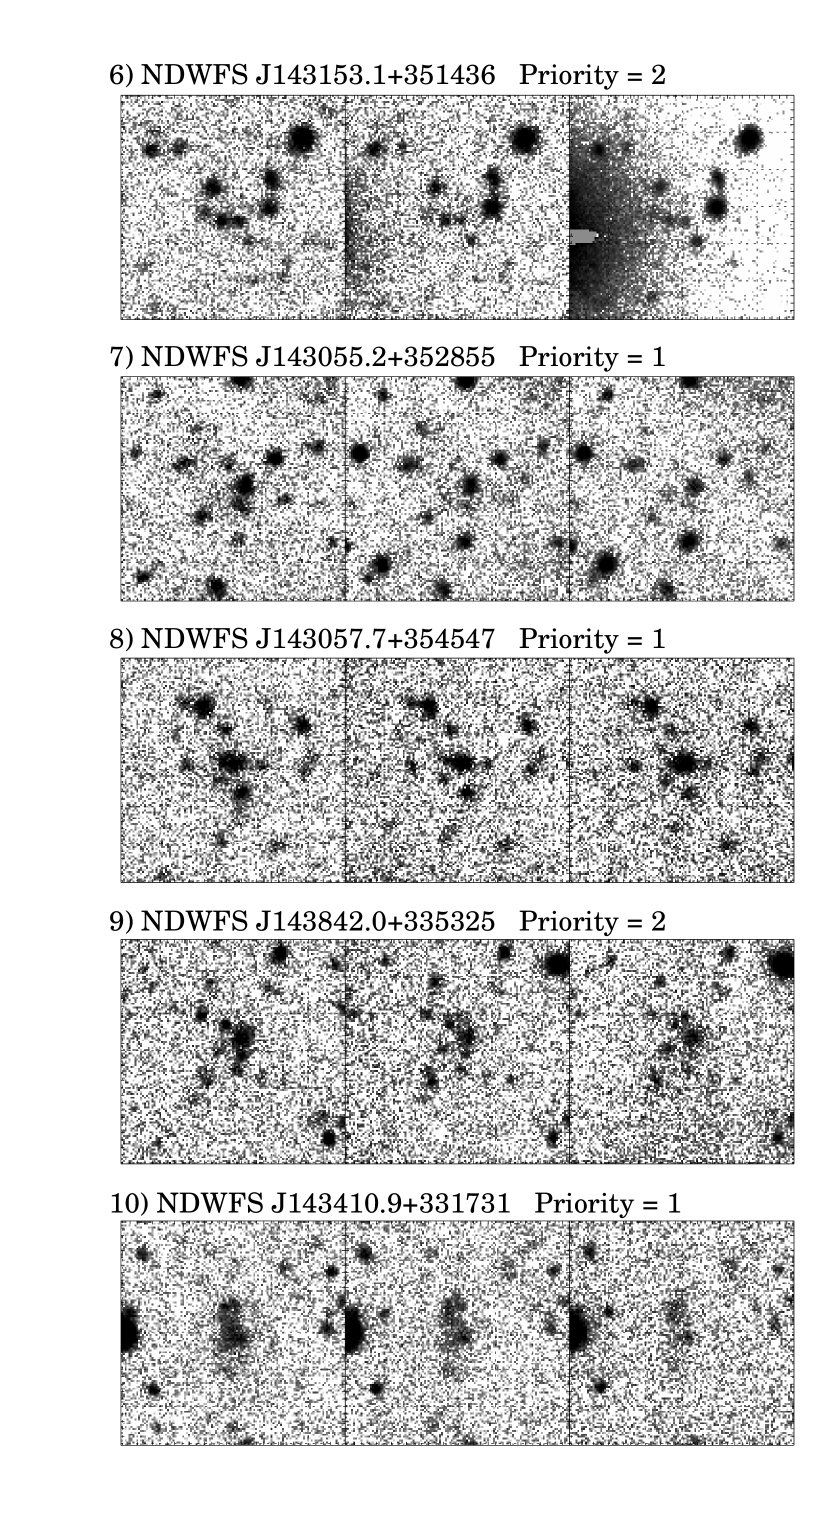
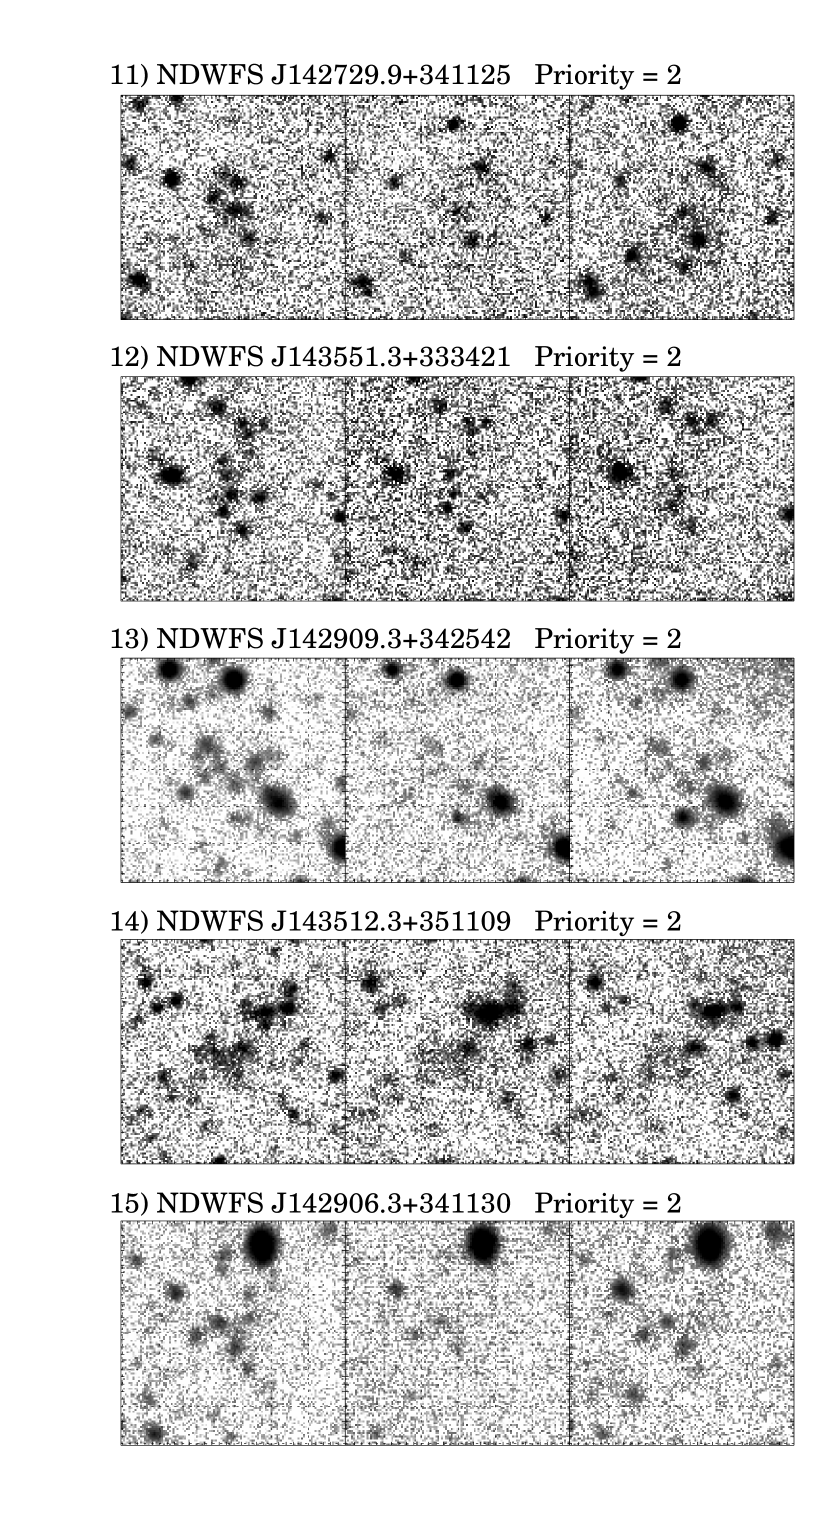
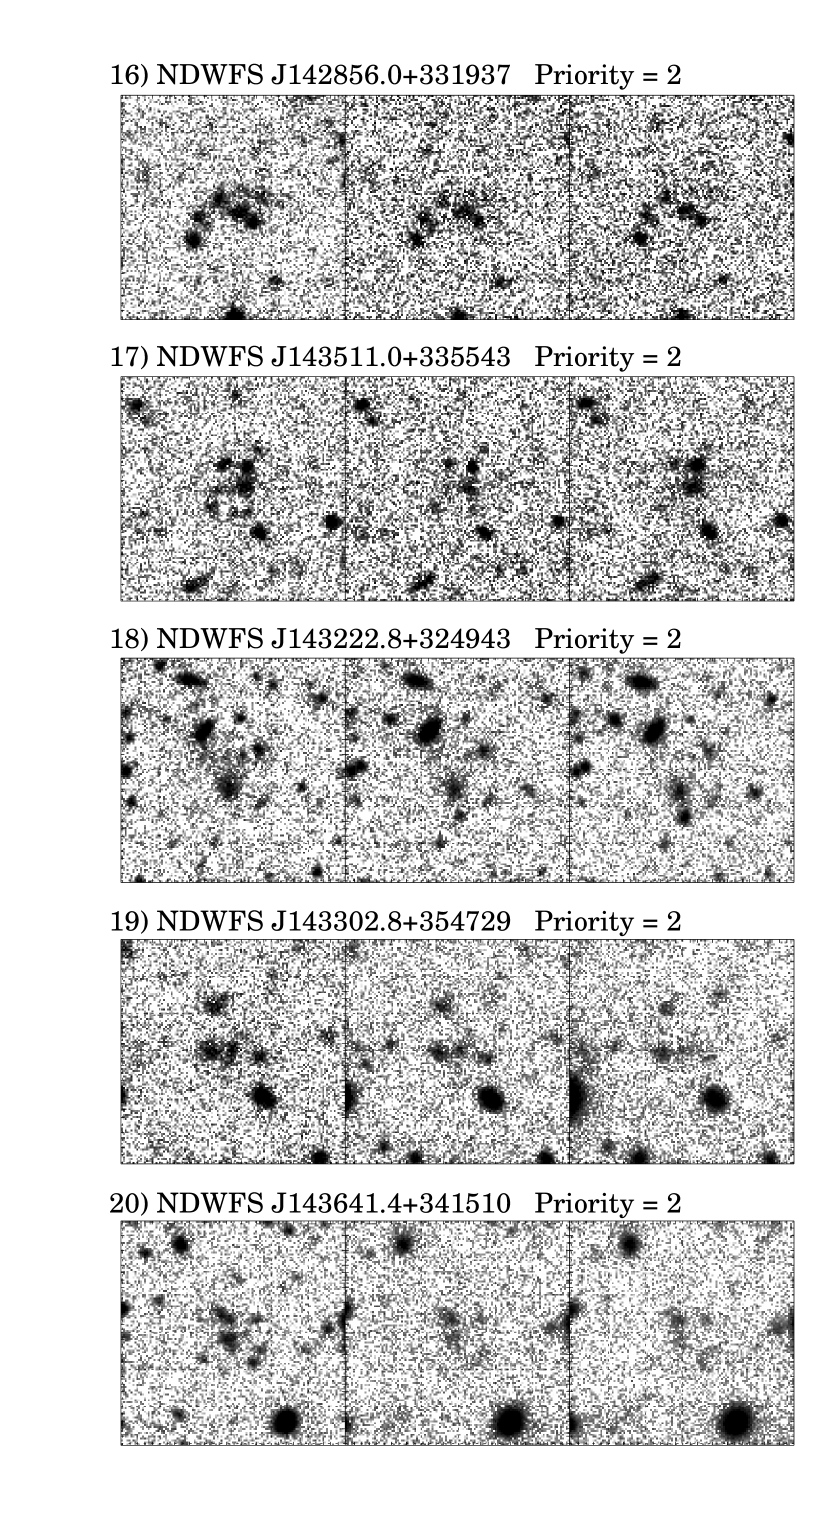
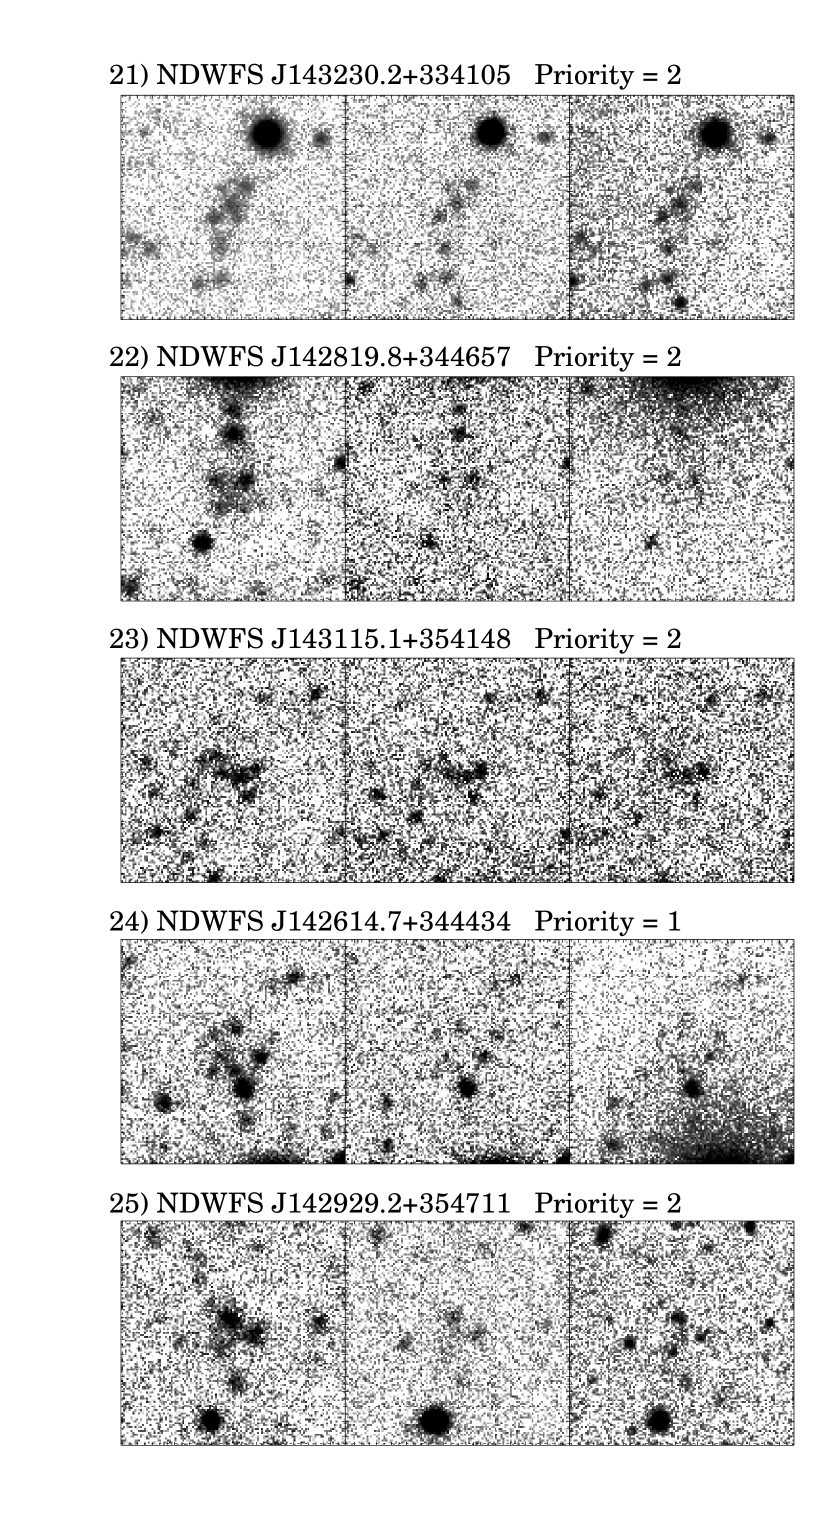
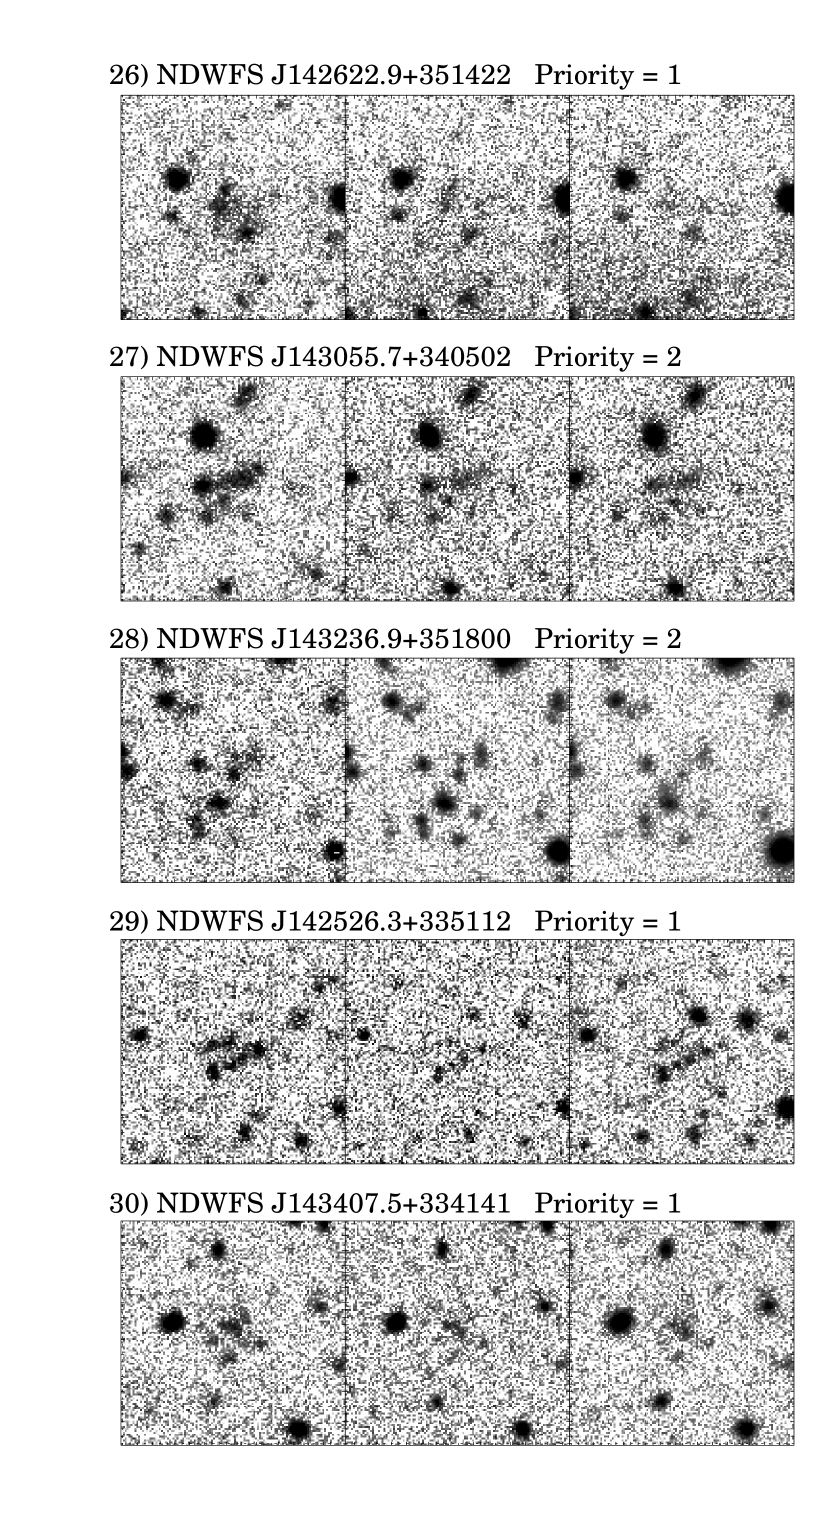
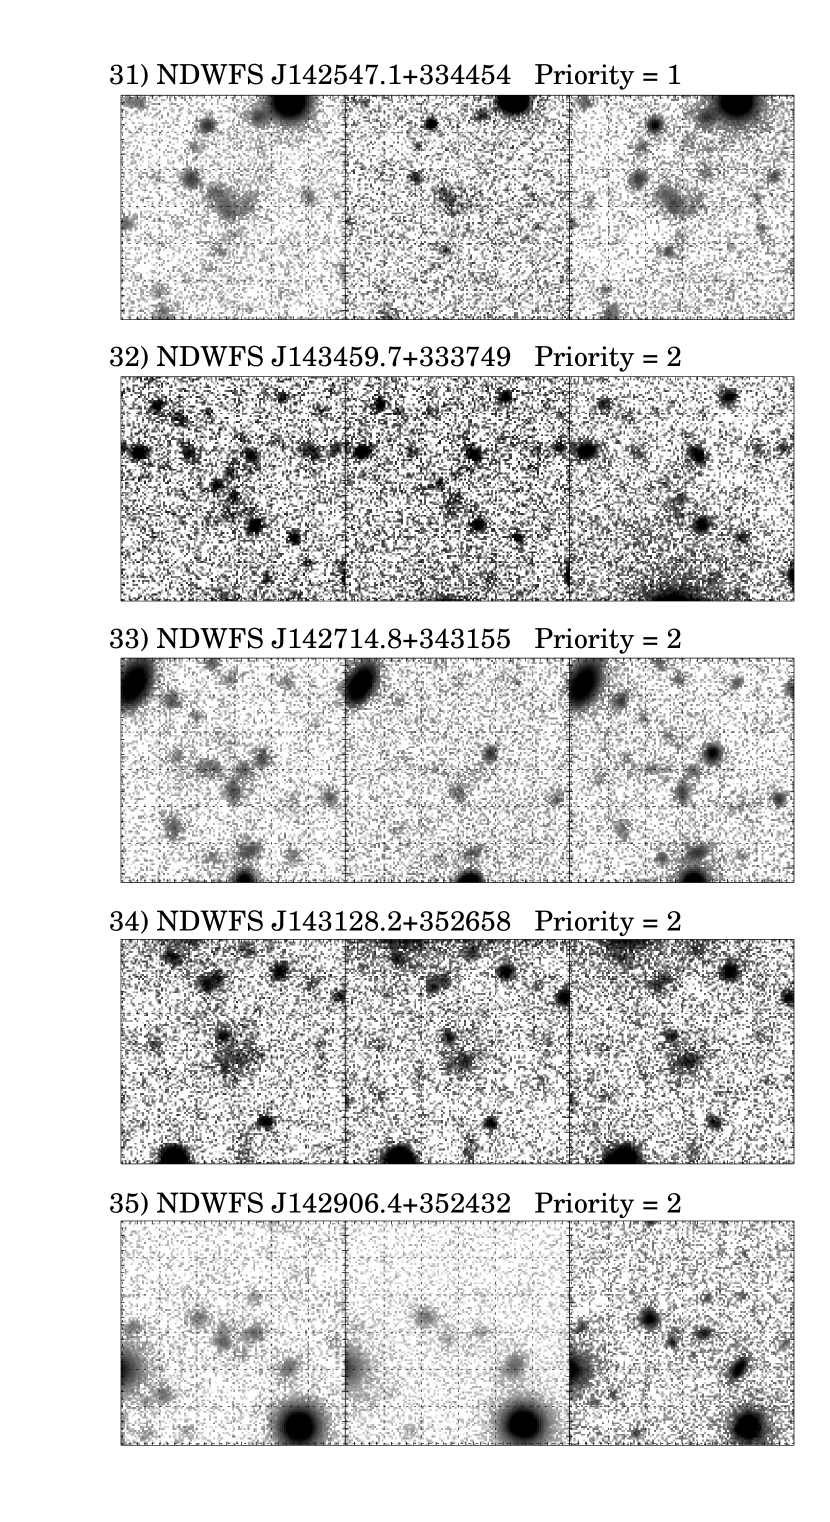
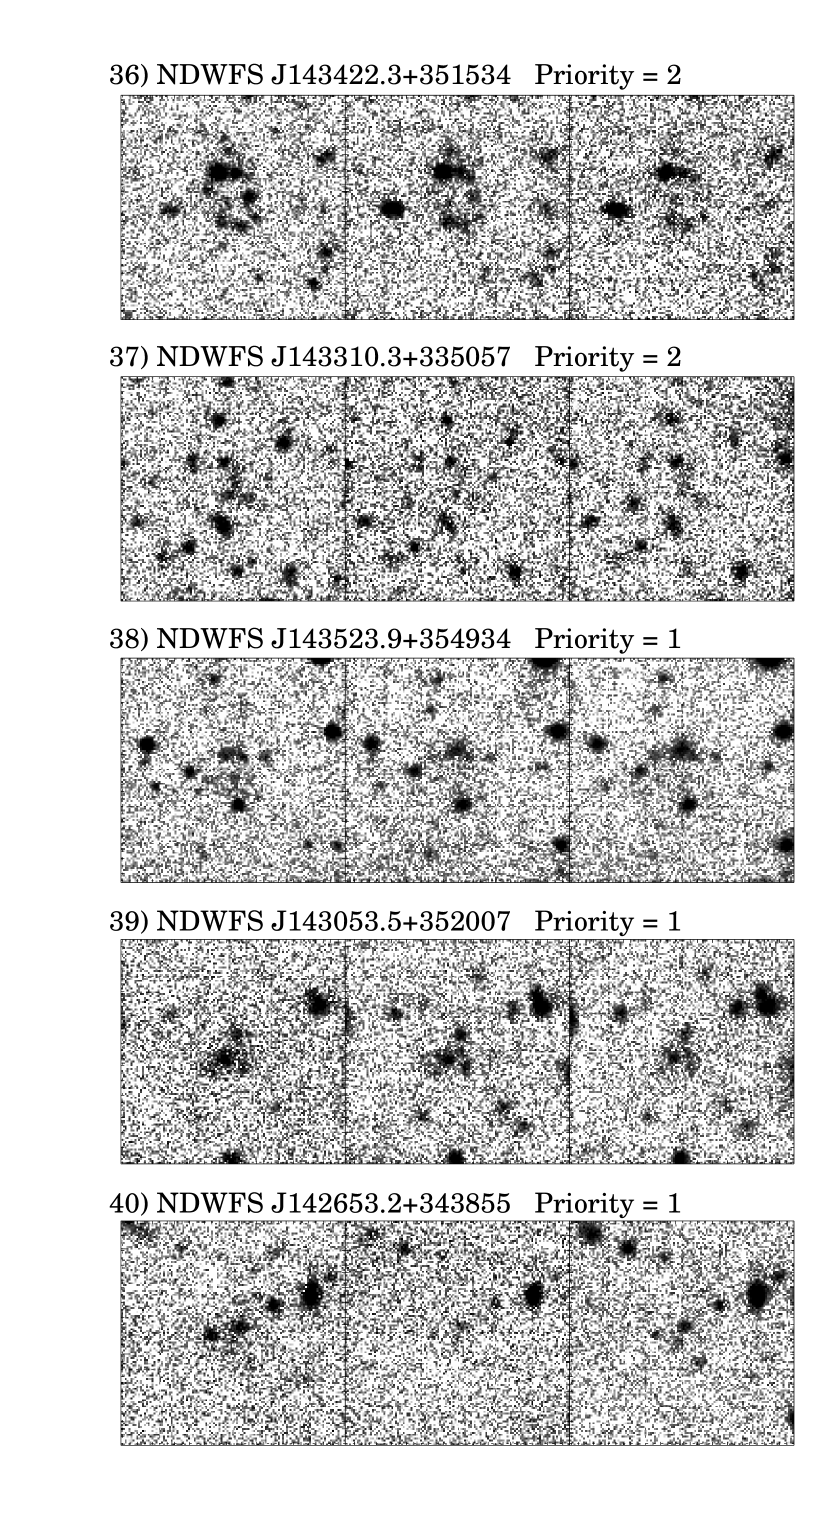
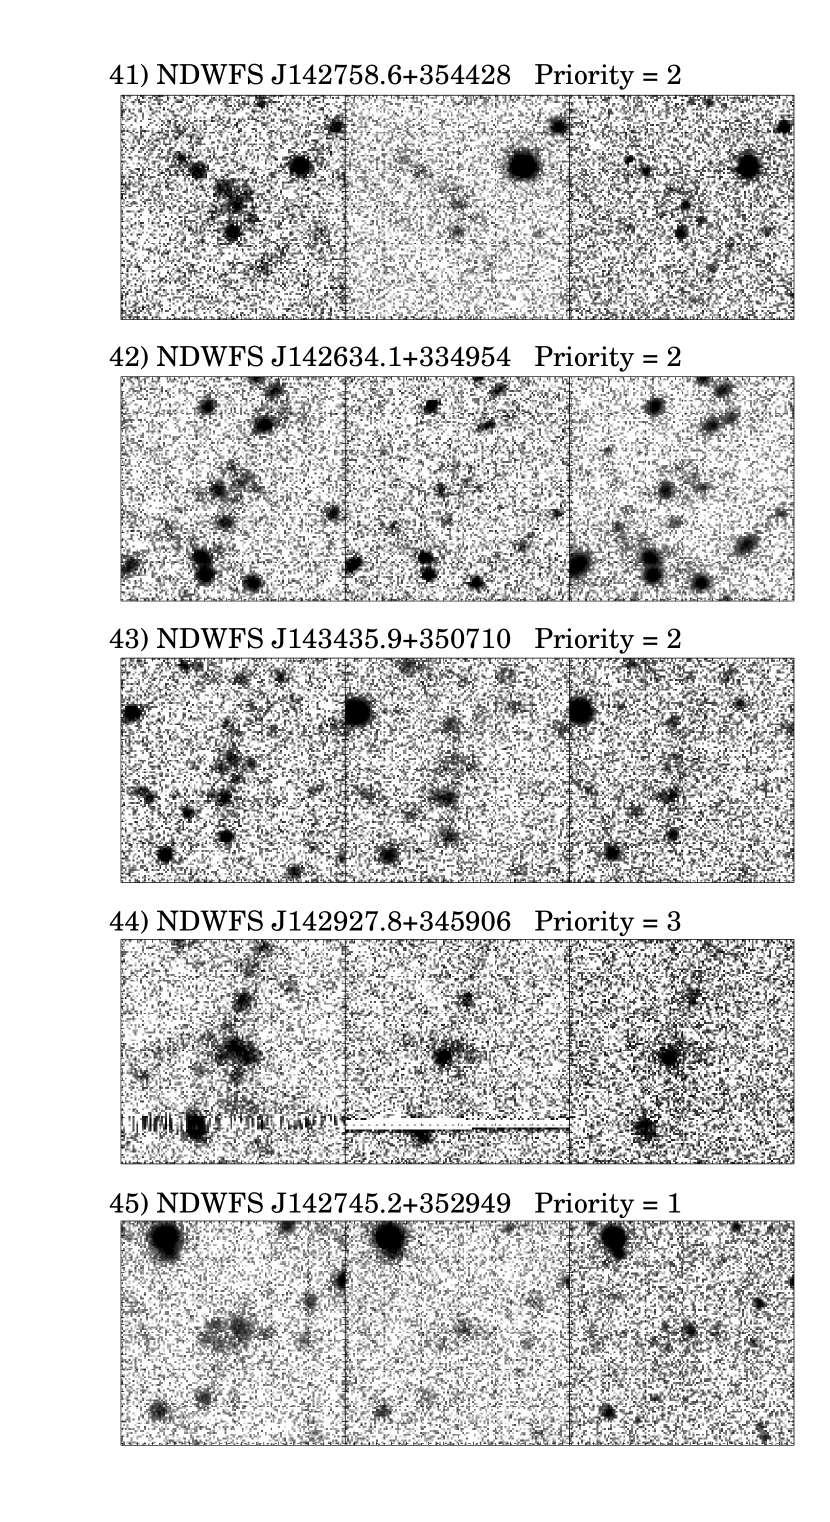
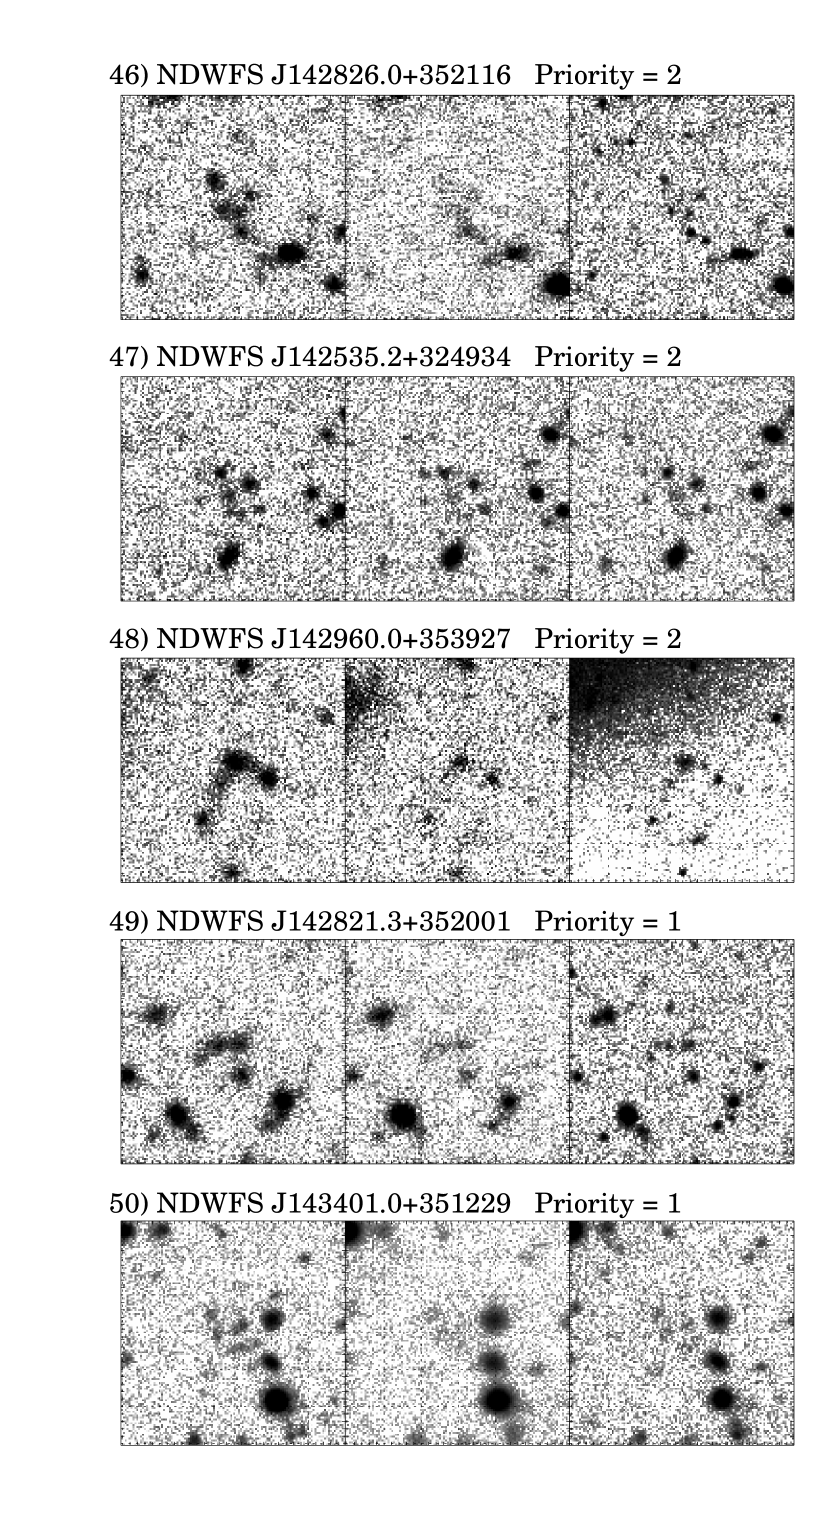
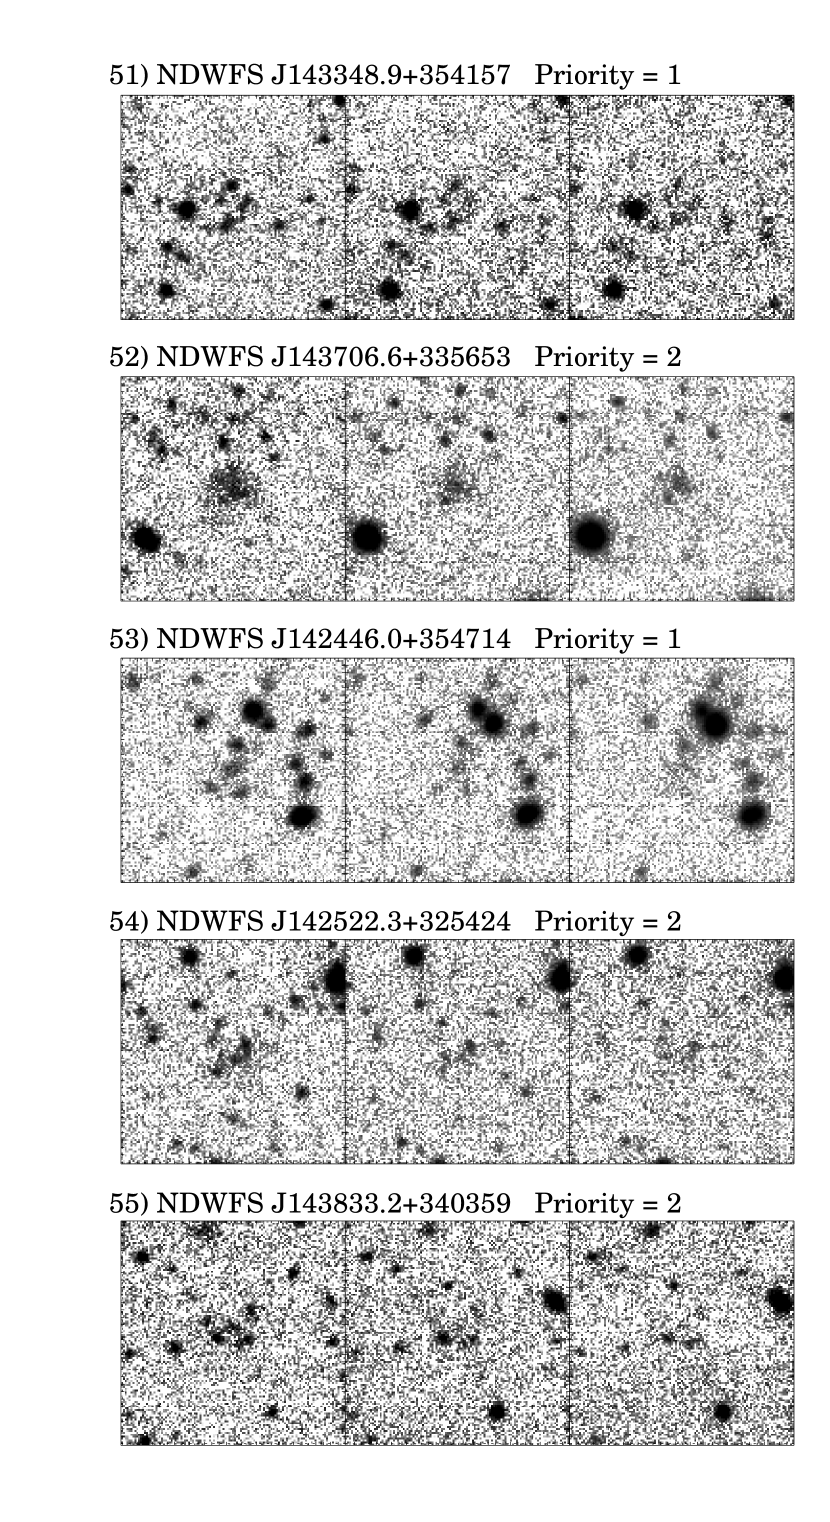
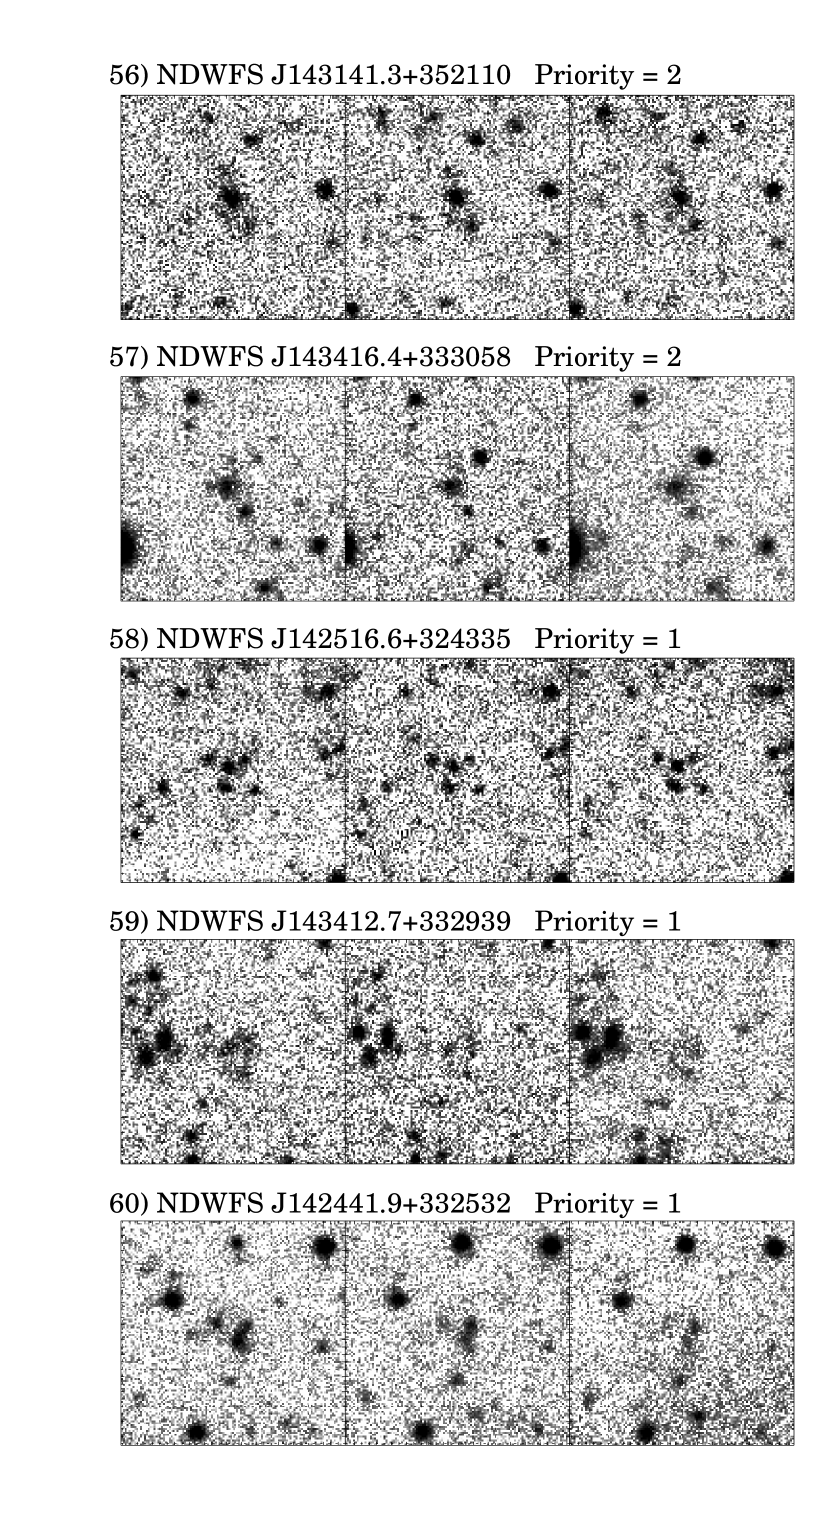
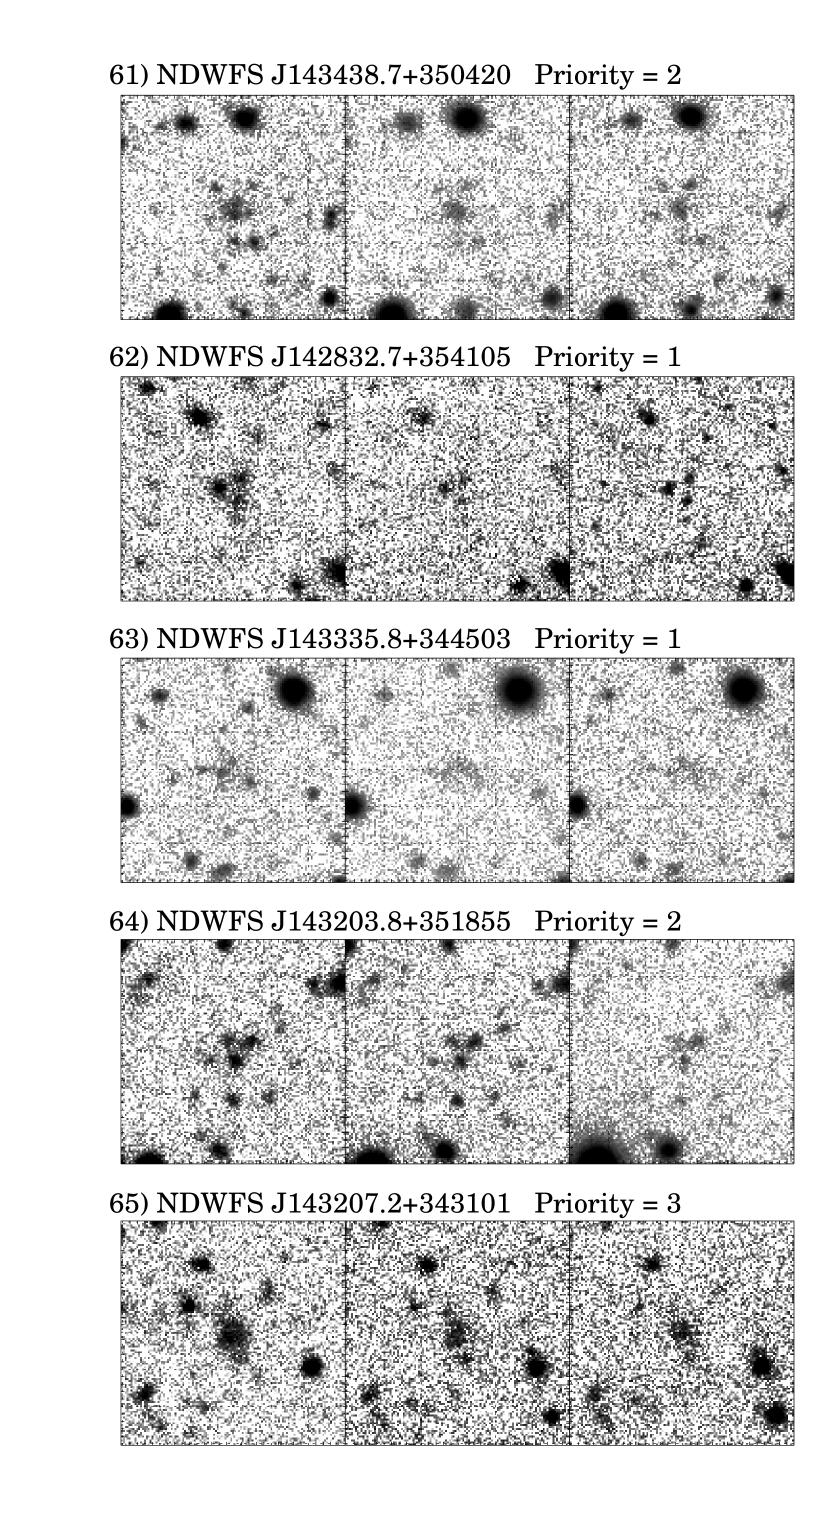
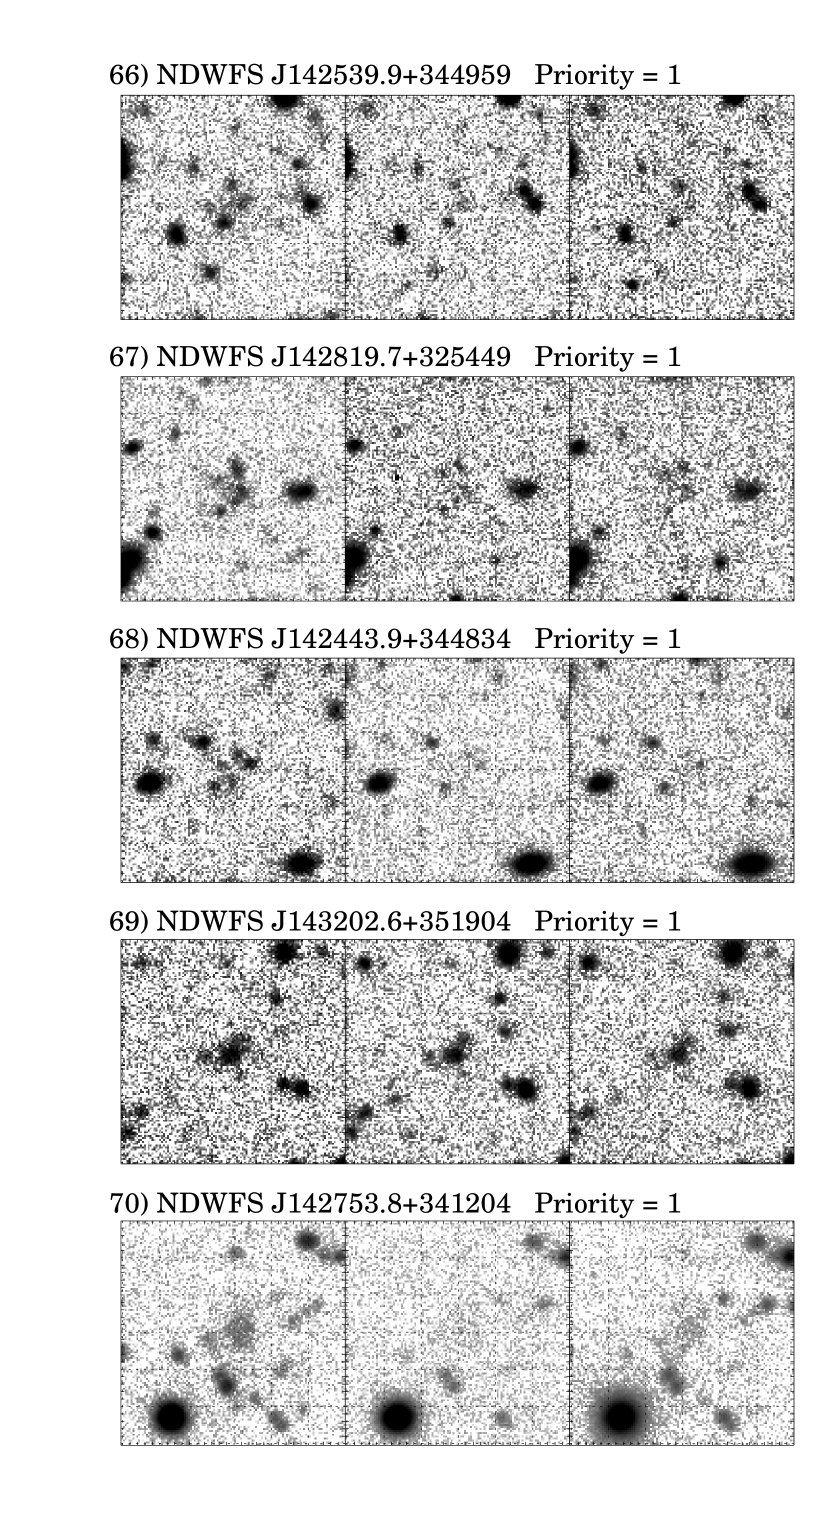
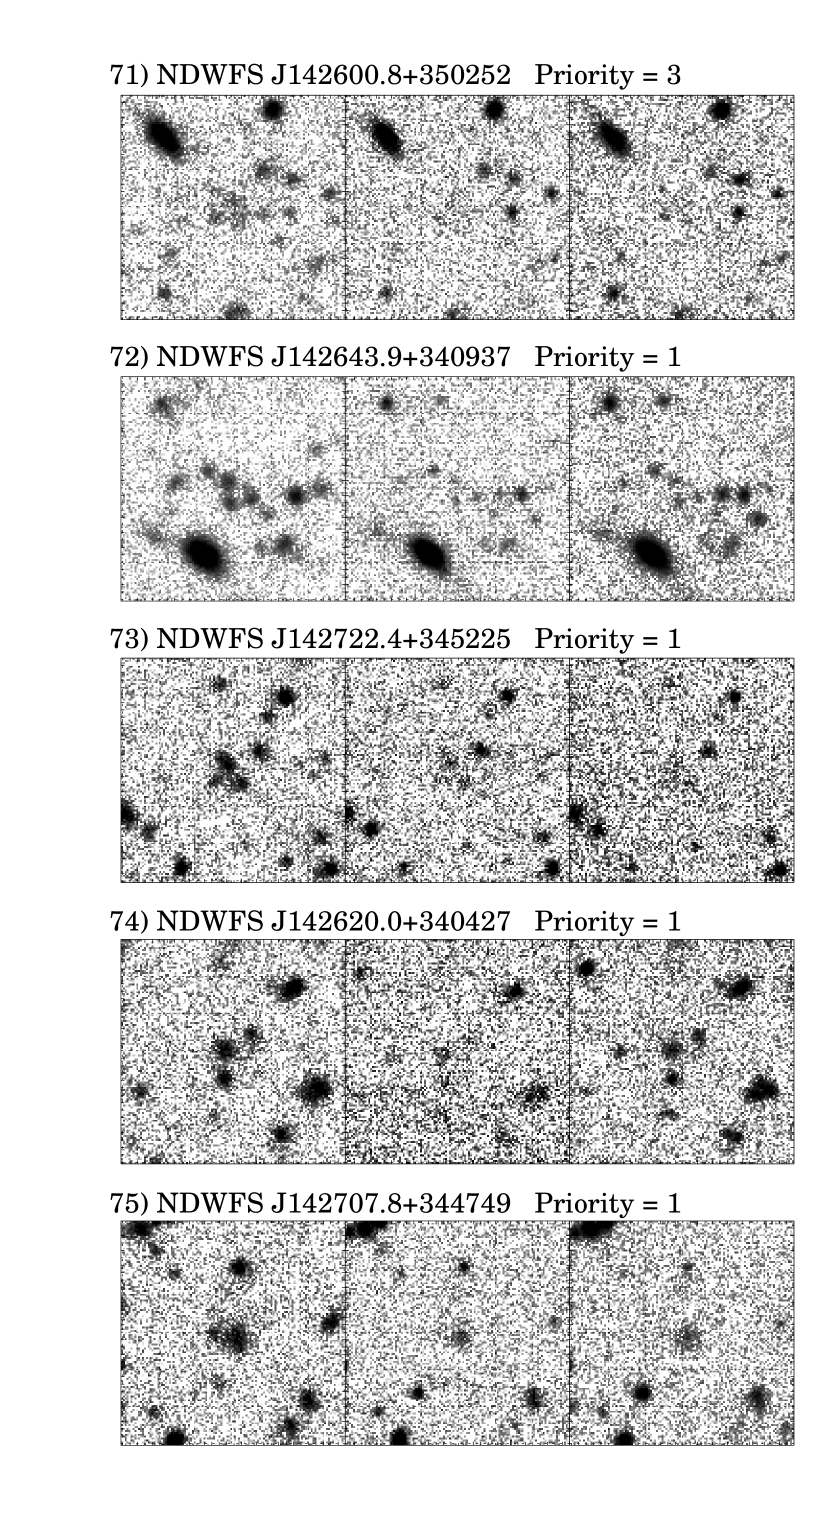
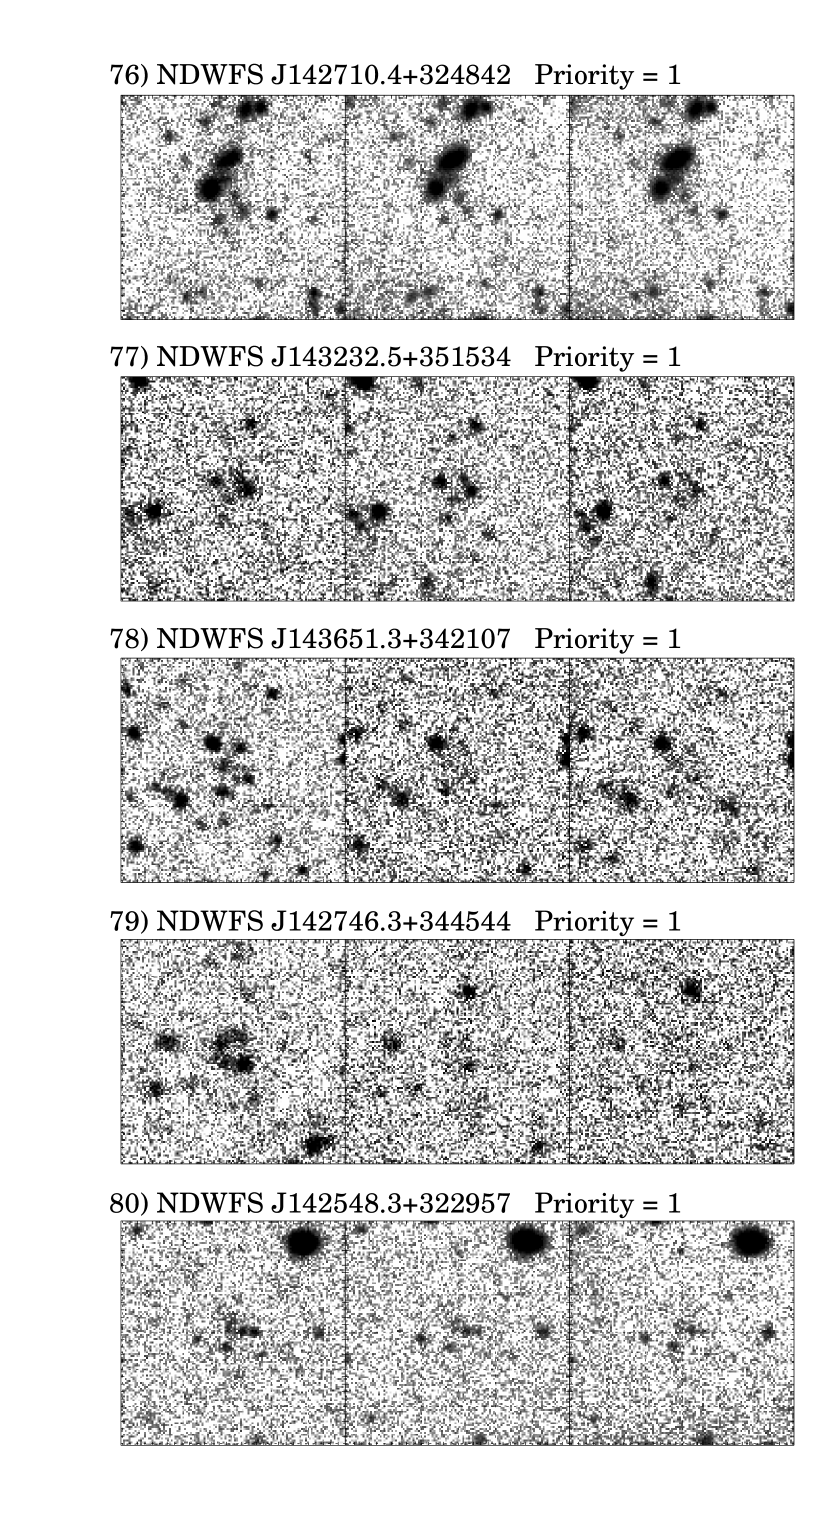
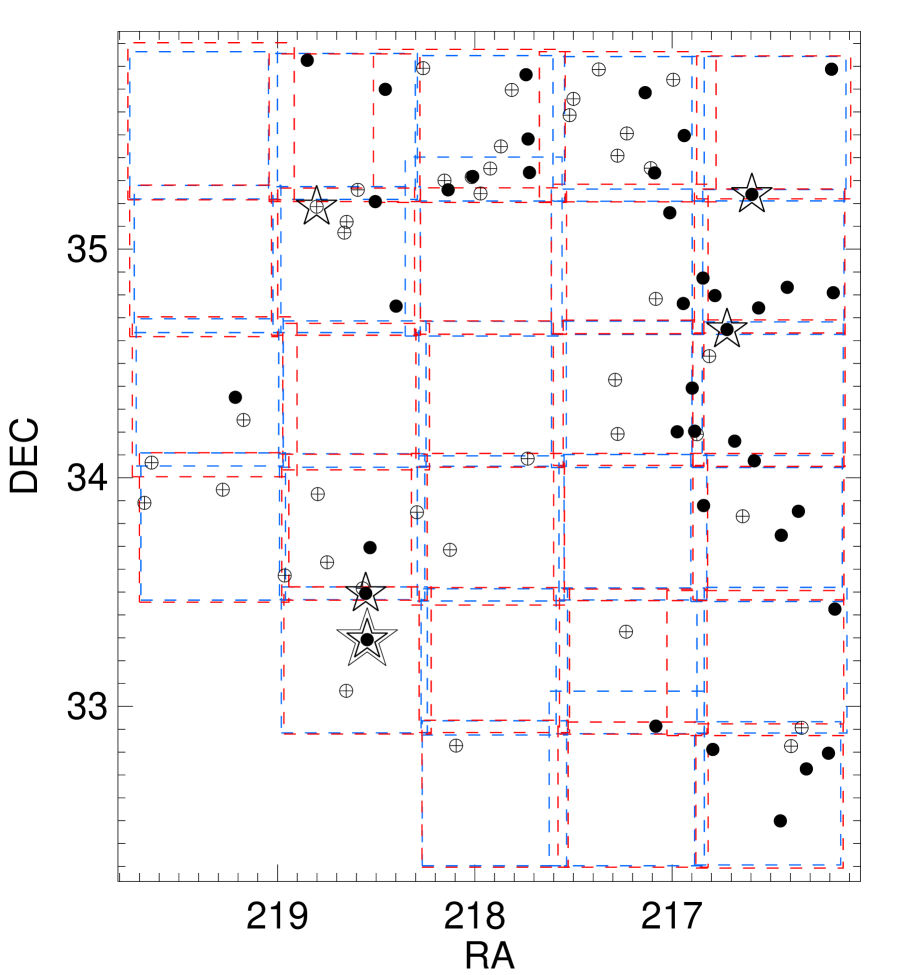
Our final candidate sample consists of 39 first priority and 40 second priority sources over a search area of 8.5 square degrees (Table LABEL:tab:select). Of the 39 first priority sources, 32 have a morphological category of group and 7 are in the category diffuse; for the 40 second priority sources, 31 are in the group category and 9 in the diffuse category. The distribution of \lya nebulae candidates on the sky is shown in Figure 7, and postage stamps of the , , and -band imaging of all candidates are shown in Appendix A. Due to the fact that we included both category group and diffuse sources in the final catalog, the candidates span a range of morphologies from clumpy to diffuse. In particular, a number of the very blue sources appear to be a close grouping of compact sources selected as one. While at first glance these compact groups do not have the diffuse appearance we expect for \lya nebulae, it could be unwise to remove them because the full morphological range spanned by the \lya nebula class is not well-known and some \lya nebulae are known to include compact sources (e.g., young galaxies; Prescott et al. 2012c, submitted). For these reasons we did not apply any further morphological selection criteria to the main sample. In addition to our 79 systematically-selected first and second priority samples, we also flagged 6 additional candidates with promising morphologies from outside these regions as a test of our color-selection approach. Of the third priority sources, which are included for reference in Table LABEL:tab:select and Appendix A, 5 have a morphological category of diffuse and 1 is in the category group.
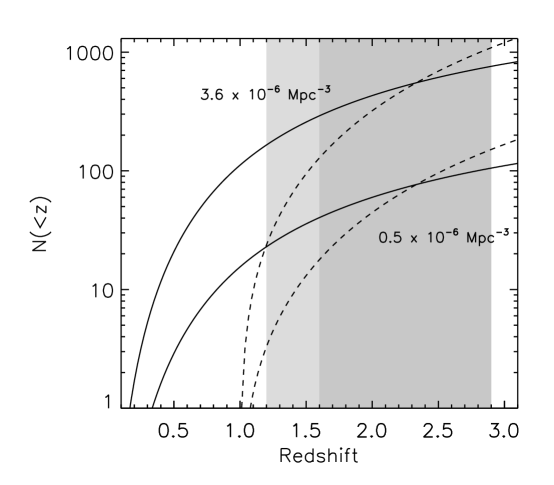
Based on previous narrow-band \lya nebulae surveys, we can predict the number of \lya nebulae we would expect to find within our full survey volume. Figure 8 shows the cumulative number of \lya nebulae expected assuming a constant comoving volume density as a function of redshift of Mpc-3 (the range spanned by the estimates of Yang et al., 2009) and a 100% detection success rate. This non-evolving model would predict approximately 60-400 \lya nebulae over the redshift range of our survey (). As the comoving volume density of \lya nebulae is unlikely to remain constant over cosmic time (Keel et al., 2009), for comparison we also plot the cumulative number of \lya nebulae expected within our survey area assuming that the comoving volume density increases linearly as a function of redshift (dashed lines). In reality the selection function, completeness, and efficiency of our survey are different from that of narrow-band surveys such as Yang et al. (2009) and the evolution of the \lya nebula comoving volume density is unknown; we address these issues in more detail in Paper III.
3.1. Potential Contaminants
Due to the wide bandpass of the filter, there are several populations that may contaminate our \lya nebula candidate sample. The morphological selection method will tend to pick out any source of low surface brightness extended emission that cannot be easily identified, e.g., a low surface brightness galaxy (LSB) or low surface brightness nebulae within the Galaxy. In principle, lower redshift sources with [Oii]3727,3729 emission in the selection band () are a contaminant population, much as they are in \lya-emitting galaxy surveys. In addition, galaxies and \lya nebulae in the redshift desert (i.e., ) may be selected as candidates in our survey if they exhibit extended blue continuum emission or a close grouping of compact sources. In these cases, \lya would be positioned blueward and [Oii] redward of the wavelength range of our follow-up spectroscopy, leading us to detect faint, spatially extended, blue continuum emission with no emission lines to provide confirmation of the redshift.
While this range of different populations could contaminate our sample in principle, not all of them will contribute substantially in practice. We do not expect to find many LSBs because the colors of \lya nebulae are likely to be bluer than typical LSB colors (i.e., ; Haberzettl et al., 2007); any blue LSBs would be expected to show optical emission lines and therefore easily identified in follow-up spectroscopy. If compact groupings of [Oii]-emitters or extended [Oii] nebulae were to be selected via our morphological search, the position of [Oii] in the , [Oiii] in the band, and H in the or band would give the object redder colors, which would not be included in the final sample. On the other hand, a primary contaminant population will be galaxies or \lya nebulae in the redshift range that appear in optical spectroscopy as spatially extended continuum-only sources. From Figure 8, we would expect of order 20-180 such sources, or roughly 25% of the predicted \lya nebulae sample over the entire redshift range (), assuming no evolution in the intrinsic number density. With line emission outside the optical window, however, follow-up observations with HST will be necessary to confirm whether or not any continuum-only sources are in fact lower redshift \lya nebulae.
4. Discussion
4.1. A Successful Broad-band Ly Nebula Survey
Our systematic broad-band \lya nebula search was designed to find luminous \lya nebulae similar to LABd05. Subsequent spectroscopic follow-up of a subset of our morphological candidate sample showed that, in addition to recovering the previously-discovered large \lya nebula at (LABd05; Dey et al., 2005), this novel approach was able to successfully locate 4 new large \lya nebulae over the NDWFS Boötes field at , , , and (PRG1, PRG2, PRG3, PRG4; Prescott, 2009). Of particular note, our broad-band search identified the first spatially extended \lya+Heii nebula (PRG1; Prescott et al., 2009); located at , this system is the lowest redshift \lya nebula known, and the strong Heii emission suggests that it may contain low metallicity gas. The 5 confirmed \lya nebulae are shown for reference in Figures 5-6, 7, and 9. A full discussion of the spectroscopic follow-up campaign is presented in Paper II, and the selection function and implied space density for this survey are discussed in Paper III.
4.2. Comparisons to Other Surveys
While broad-band imaging has been used in recent years to isolate samples of \lya-emitting and \lya-absorbing galaxies based on colors (Cooke, 2009) and to find strong line-emitting nebulae at low redshifts through the Galaxy Zoo project (Lintott et al., 2009; Keel et al., 2011), our search is the first time broad-band data has been used as the basis for a semi-automated systematic morphological survey for high redshift \lya nebulae. Our \lya nebula survey is also fundamentally different and complementary to standard narrow-band surveys for \lya nebulae (Table 2). The pilot survey of the NDWFS Boötes field has shown that it is possible to find large \lya nebulae using deep broad-band imaging data. There are many advantages to this unusual approach. A broad-band search is able to efficiently cover enormous comoving volumes that would be observationally expensive when using a narrow-band filter. A narrow-band survey using a 100Å filter at would need to search over 100 square degrees to reach the same comoving volume covered in our broad-band survey of the NDWFS Boötes field ( h Mpc-3). In addition, our technique builds on existing datasets, which means that our search algorithm can be easily modified to find \lya nebulae within any deep, broad-band, wide-field imaging survey, leading to substantially lower observational overhead. Finally, while the early, successful \lya surveys often targeted known overdensities and were limited to smaller areas (Steidel et al., 2000; Matsuda et al., 2004; Francis et al., 1996; Palunas et al., 2004), introducing a bias to the number density estimates, our 8.5 square degree survey, by contrast, is unbiased in terms of environment, spanning a , a comoving transverse distance of 290 h Mpc (at the redshift midpoint, ), and a comoving line-of-sight distance of 1700 h Mpc.
At the same time, a drawback of using broad-band data to select line-emitting sources is the necessity of restricting our search to the largest, most luminous \lya nebulae and of removing compact sources in favor of diffuse emission, in order to reduce the number of contaminants. Thus, while our search successfully recovered a sample of \lya nebulae, a handful of other (fainter or more compact) \lya nebulae that were identified by traditional narrow-band searches in Boötes were not recovered by our broad-band search (Table 3).
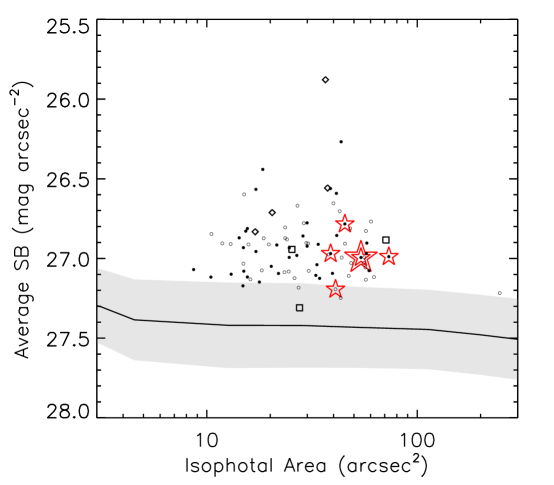
In Figure 9, we show the isophotal area and mean surface brightness estimates for the candidate sample, as derived using SourceExtractor (detect_thresh mag arcsec-2, detect_minarea) on the original imaging, for the \lya nebulae confirmed by our survey (Paper II), and for other known \lya nebula sources in the field. The sources our survey did not recover fall into two categories: either the \lya emission surrounds a much brighter compact continuum source (“core-halo” morphology) or the diffuse emission is simply too faint to be selected by our search algorithm. In the first category are the four \lya nebulae found by Yang et al. (2009) using a traditional narrow-band survey of NDWFS Boötes; all four consist of bright continuum sources (AGN in two cases) surrounded by \lya halos that are undetected in the broad-band imaging. The bright compact central sources caused these objects to be rejected and replaced with sky noise during Steps 2-3 or Steps 6-7 of the search pipeline. Intermediate-band imaging with the Subaru (Prescott et al., 2008) and Mayall Telescopes revealed three additional \lya nebulae that were not detected using the broad-band search algorithm. One case (P1) was too faint to be selected by our search algorithm, and two other cases (P2 & P3) showed core-halo morphologies with confirmed \lya emission (at and ) in the midst of several bright continuum sources. With the compact sources removed by the search pipeline, the wings of the \lya emission were still detected in the imaging in each case, but at weaker wavelet power limits than probed by the current survey.
As our search was designed to select large, luminous, and diffuse \lya nebulae, it is not surprising that more compact or fainter \lya nebulae were not selected. In future work, it will be important to understand this range of \lya nebula morphologies and whether they reflect fundamentally different sources or simply different evolutionary phases of the same underlying phenomenon.
5. Conclusions
We have designed an innovative systematic search for large \lya nebulae using deep broad-band data. Our technique is designed to find the largest and brightest \lya nebulae and is able to probe enormous comoving volumes ( h Mpc3) using existing deep broad-band datasets. In this paper, we presented details on the survey design and our sample of \lya nebula candidates selected from the NDWFS Boötes Field. Paper II of this series presents the spectroscopic follow-up and the confirmed \lya nebula sample, and Paper III will address the details of the survey selection function and the implications for the space density of \lya nebulae. In the future, we will build on the search algorithm developed in this work in order to find \lya nebulae in other deep and wide imaging fields and increase the sample of known \lya nebulae available for detailed follow-up study.
References
- Basu-Zych & Scharf (2004) Basu-Zych, A., & Scharf, C. 2004, The Astrophysical Journal, 615, L85
- Bertin & Arnouts (1996) Bertin, E., & Arnouts, S. 1996, Astronomy and Astrophysics Supplement
- Chapman et al. (2001) Chapman, S. C., Lewis, G. F., Scott, D., Richards, E., Borys, C., Steidel, C. C., Adelberger, K. L., & Shapley, A. E. 2001, The Astrophysical Journal, 548, L17
- Charlot & Fall (1993) Charlot, S., & Fall, S. M. 1993, The Astrophysical Journal, 415, 580
- Cooke (2009) Cooke, J. 2009, The Astrophysical Journal, 704, L62
- Dey et al. (2005) Dey, A., et al. 2005, The Astrophysical Journal, 629, 654
- Francis et al. (1996) Francis, P. J., et al. 1996, The Astrophysical Journal, 457, 490
- Geach et al. (2007) Geach, J. E., Smail, I., Chapman, S. C., Alexander, D. M., Blain, A. W., Stott, J. P., & Ivison, R. J. 2007, The Astrophysical Journal, 655, L9
- Geach et al. (2009) Geach, J. E., et al. 2009, The Astrophysical Journal, 700, 1
- Greve et al. (2007) Greve, T. R., Stern, D., Ivison, R. J., De Breuck, C., Kovács, A., & Bertoldi, F. 2007, Monthly Notices of the Royal Astronomical Society, 382, 48
- Haberzettl et al. (2007) Haberzettl, L., Bomans, D. J., Dettmar, R.-J., & Pohlen, M. 2007, Astronomy and Astrophysics, 465, 95
- Jannuzi & Dey (1999) Jannuzi, B. T., & Dey, A. 1999, in Photometric Redshifts and the Detection of High Redshift Galaxies, ed. R. Weymann, R., Storrie-Lombardi, L., Sawicki, M., & Brunner, Vol. 191 (Astronomical Society of the Pacific Conference Series), 111
- Keel et al. (2009) Keel, W. C., White, R. E., Chapman, S., & Windhorst, R. A. 2009, The Astronomical Journal, 138, 986
- Keel et al. (2011) Keel, W. C., et al. 2011, Monthly Notices of the Royal Astronomical Society, 420, 878
- Lilly et al. (1991) Lilly, S. J., Cowie, L. L., & Gardner, J. P. 1991, The Astrophysical Journal, 369, 79
- Lintott et al. (2009) Lintott, C. J., et al. 2009, Monthly Notices of the Royal Astronomical Society, 399, 129
- Matsuda et al. (2004) Matsuda, Y., et al. 2004, The Astronomical Journal, 128, 569
- Matsuda et al. (2005) Matsuda, Y., et al. 2005, The Astrophysical Journal, 634, L125
- Matsuda et al. (2009) Matsuda, Y., et al. 2009, Monthly Notices of the Royal Astronomical Society: Letters, 400, L66
- Matsuda et al. (2011) Matsuda, Y., et al. 2011, Monthly Notices of the Royal Astronomical Society: Letters, 410, L13
- Nilsson et al. (2006) Nilsson, K. K., Fynbo, J. P. U., Mø ller, P., Sommer-Larsen, J., & Ledoux, C. 2006, Astronomy and Astrophysics, 452, L23
- Ouchi et al. (2009) Ouchi, M., et al. 2009, The Astrophysical Journal, 696, 1164
- Palunas et al. (2004) Palunas, P., Teplitz, H. I., Francis, P. J., Williger, G. M., & Woodgate, B. E. 2004, The Astrophysical Journal, 602, 545
- Prescott (2009) Prescott, M. K. M. 2009, Phd, University of Arizona
- Prescott et al. (2009) Prescott, M. K. M., Dey, A., & Jannuzi, B. T. 2009, The Astrophysical Journal, 702, 554
- Prescott et al. (2008) Prescott, M. K. M., Kashikawa, N., Dey, A., & Matsuda, Y. 2008, The Astrophysical Journal, 678, L77
- Saito et al. (2006) Saito, T., Shimasaku, K., Okamura, S., Ouchi, M., Akiyama, M., & Yoshida, M. 2006, The Astrophysical Journal, 648, 54
- Smith & Jarvis (2007) Smith, D. J. B., & Jarvis, M. J. 2007, Monthly Notices of the Royal Astronomical Society: Letters, 378, L49
- Steidel et al. (2000) Steidel, C. C., Adelberger, K. L., Shapley, A. E., Pettini, M., Dickinson, M., & Giavalisco, M. 2000, The Astrophysical Journal, 532, 170
- Yang et al. (2010) Yang, Y., Zabludoff, A., Eisenstein, D., & Davé, R. 2010, The Astrophysical Journal, 719, 1654
- Yang et al. (2009) Yang, Y., Zabludoff, A., Tremonti, C., Eisenstein, D., & Davé, R. 2009, The Astrophysical Journal, 693, 1579
| Ly Nebula Candidates 1) | NDWFS J143004.7+353509 | 14:30:04.687 | 35:35:09.06 | 134.0 | diffuse | 23.790.05 | 0.61 | 2dd“Too Faint” indicates that the diffuse emission was too faint to be selected by our survey. “Core-Halo” describes sources with a central compact continuum source surrounded by a \lya halo; these sources are partially or completely removed from the images during pipeline steps designed to remove bright stars and compact galaxies and are not selected by our survey. |
| 2) | NDWFS J143006.9+353437 | 14:30:06.864 | 35:34:36.73 | 108.2 | diffuse | 23.050.03 | 0.80 | 3dd“Too Faint” indicates that the diffuse emission was too faint to be selected by our survey. “Core-Halo” describes sources with a central compact continuum source surrounded by a \lya halo; these sources are partially or completely removed from the images during pipeline steps designed to remove bright stars and compact galaxies and are not selected by our survey. |
| 3) | NDWFS J142846.2+330819 | 14:28:46.228 | 33:08:19.42 | 89.9 | diffuse | 23.000.03 | 0.89 | 3 |
| 4) | NDWFS J143436.4+330406 | 14:34:36.448 | 33:04:05.62 | 72.1 | group | 22.900.02 | 0.53 | 2 |
| 5) | NDWFS J142855.0+353022 | 14:28:54.998 | 35:30:21.70 | 64.9 | diffuse | 23.260.03 | 0.52 | 2 |
| 6) | NDWFS J143153.1+351436 | 14:31:53.066 | 35:14:36.45 | 62.6 | group | 23.310.04 | 0.53 | 2 |
| 7) | NDWFS J143055.2+352855 | 14:30:55.192 | 35:28:54.76 | 61.6 | group | 23.300.04 | 0.43 | 1 |
| 8) | NDWFS J143057.7+354547 | 14:30:57.662 | 35:45:47.26 | 59.6 | group | 23.090.03 | 0.43 | 1 |
| 9) | NDWFS J143842.0+335325 | 14:38:41.956 | 33:53:24.79 | 59.5 | group | 23.140.04 | 0.63 | 2 |
| 10) | NDWFS J143410.9+331731 | 14:34:10.948 | 33:17:30.80 | 59.1 | diffuse | 23.180.03 | 0.42 | 1eefootnotemark: |
| 11) | NDWFS J142729.9+341125 | 14:27:29.894 | 34:11:25.22 | 56.2 | group | 23.480.05 | 0.48 | 2 |
| 12) | NDWFS J143551.3+333421 | 14:35:51.278 | 33:34:21.03 | 55.9 | group | 23.380.05 | 0.51 | 2 |
| 13) | NDWFS J142909.3+342542 | 14:29:09.278 | 34:25:42.38 | 55.8 | group | 23.410.04 | 0.58 | 2 |
| 14) | NDWFS J143512.3+351109 | 14:35:12.336 | 35:11:08.62 | 55.7 | diffuse | 23.530.04 | 0.56 | 2fffootnotemark: |
| 15) | NDWFS J142906.3+341130 | 14:29:06.271 | 34:11:30.26 | 53.5 | group | 23.470.04 | 0.48 | 2 |
| 16) | NDWFS J142856.0+331937 | 14:28:56.013 | 33:19:36.51 | 53.5 | group | 23.380.04 | 0.60 | 2 |
| 17) | NDWFS J143511.0+335543 | 14:35:11.030 | 33:55:43.10 | 53.3 | group | 23.120.03 | 0.53 | 2 |
| 18) | NDWFS J143222.8+324943 | 14:32:22.768 | 32:49:42.67 | 53.1 | diffuse | 23.350.04 | 0.53 | 2 |
| 19) | NDWFS J143302.8+354729 | 14:33:02.844 | 35:47:29.43 | 52.7 | group | 23.420.04 | 0.50 | 2 |
| 20) | NDWFS J143641.4+341510 | 14:36:41.373 | 34:15:10.26 | 52.1 | group | 23.500.04 | 0.55 | 2 |
| 21) | NDWFS J143230.2+334105 | 14:32:30.244 | 33:41:05.46 | 50.5 | group | 23.250.03 | 0.56 | 2 |
| 22) | NDWFS J142819.8+344657 | 14:28:19.840 | 34:46:57.14 | 50.4 | group | 23.160.03 | 0.61 | 2 |
| 23) | NDWFS J143115.1+354148 | 14:31:15.055 | 35:41:47.76 | 50.1 | group | 23.540.05 | 0.55 | 2 |
| 24) | NDWFS J142614.7+344434 | 14:26:14.714 | 34:44:34.22 | 49.9 | group | 23.510.05 | 0.43 | 1 |
| 25) | NDWFS J142929.2+354711 | 14:29:29.198 | 35:47:10.78 | 49.5 | group | 23.170.03 | 0.52 | 2 |
| 26) | NDWFS J142622.9+351422 | 14:26:22.905 | 35:14:22.02 | 49.5 | diffuse | 23.200.04 | -0.49 | 1ggfootnotemark: |
| 27) | NDWFS J143055.7+340502 | 14:30:55.713 | 34:05:01.71 | 49.3 | diffuse | 23.040.03 | 0.57 | 2 |
| 28) | NDWFS J143236.9+351800 | 14:32:36.883 | 35:18:00.32 | 49.1 | group | 23.420.06 | 0.57 | 2 |
| 29) | NDWFS J142526.3+335112 | 14:25:26.332 | 33:51:12.16 | 48.7 | group | 23.350.04 | 0.40 | 1 |
| 30) | NDWFS J143407.5+334141 | 14:34:07.476 | 33:41:40.56 | 48.3 | group | 23.430.05 | 0.26 | 1 |
| 31) | NDWFS J142547.1+334454 | 14:25:47.126 | 33:44:54.13 | 48.1 | diffuse | 22.980.03 | 0.45 | 1 |
| 32) | NDWFS J143459.7+333749 | 14:34:59.702 | 33:37:48.93 | 48.1 | group | 23.680.06 | 0.48 | 2 |
| 33) | NDWFS J142714.8+343155 | 14:27:14.791 | 34:31:54.55 | 47.7 | group | 23.380.04 | 0.52 | 2 |
| 34) | NDWFS J143128.2+352658 | 14:31:28.245 | 35:26:57.91 | 47.3 | diffuse | 23.060.03 | 0.56 | 2 |
| 35) | NDWFS J142906.4+352432 | 14:29:06.398 | 35:24:32.22 | 47.2 | group | 23.500.05 | 0.54 | 2 |
| 36) | NDWFS J143422.3+351534 | 14:34:22.348 | 35:15:34.27 | 46.3 | group | 23.500.04 | 0.51 | 2 |
| 37) | NDWFS J143310.3+335057 | 14:33:10.346 | 33:50:56.94 | 45.9 | group | 23.820.07 | 0.58 | 2 |
| 38) | NDWFS J143523.9+354934 | 14:35:23.856 | 35:49:34.39 | 45.0 | group | 23.930.07 | 0.42 | 1 |
| 39) | NDWFS J143053.5+352007 | 14:30:53.488 | 35:20:06.68 | 45.0 | group | 23.020.04 | 0.43 | 1 |
| 40) | NDWFS J142653.2+343855 | 14:26:53.172 | 34:38:55.39 | 44.8 | group | 23.530.06 | -0.67 | 1iifootnotemark: |
| 41) | NDWFS J142758.6+354428 | 14:27:58.617 | 35:44:28.42 | 44.4 | group | 23.420.03 | 0.50 | 2 |
| 42) | NDWFS J142634.1+334954 | 14:26:34.106 | 33:49:53.61 | 44.3 | group | 23.540.04 | 0.51 | 2 |
| 43) | NDWFS J143435.9+350710 | 14:34:35.932 | 35:07:09.91 | 44.2 | group | 23.720.05 | 0.57 | 2 |
| 44) | NDWFS J142927.8+345906 | 14:29:27.837 | 34:59:06.14 | 43.1 | group | 23.180.03 | 1.18 | 3 |
| 45) | NDWFS J142745.2+352949 | 14:27:45.194 | 35:29:48.98 | 42.9 | group | 23.480.04 | 0.23 | 1 |
| 46) | NDWFS J142826.0+352116 | 14:28:25.999 | 35:21:15.62 | 42.7 | group | 23.580.04 | 0.48 | 2 |
| 47) | NDWFS J142535.2+324934 | 14:25:35.205 | 32:49:34.17 | 42.6 | group | 23.540.05 | 0.49 | 2 |
| 48) | NDWFS J142960.0+353927 | 14:29:59.978 | 35:39:26.89 | 42.4 | group | 23.360.03 | 0.47 | 2 |
| 49) | NDWFS J142821.3+352001 | 14:28:21.259 | 35:20:00.92 | 42.4 | group | 23.420.04 | 0.25 | 1 |
| 50) | NDWFS J143401.0+351229 | 14:34:01.034 | 35:12:29.12 | 42.0 | group | 23.910.06 | 0.19 | 1 |
| 51) | NDWFS J143348.9+354157 | 14:33:48.885 | 35:41:56.68 | 41.7 | group | 23.740.05 | -0.08 | 1 |
| 52) | NDWFS J143706.6+335653 | 14:37:06.588 | 33:56:52.65 | 41.3 | diffuse | 23.220.03 | 0.52 | 2 |
| 53) | NDWFS J142446.0+354714 | 14:24:45.998 | 35:47:14.06 | 40.5 | group | 23.680.05 | 0.19 | 1 |
| 54) | NDWFS J142522.3+325424 | 14:25:22.339 | 32:54:23.65 | 39.9 | group | 23.400.04 | 0.48 | 2 |
| 55) | NDWFS J143833.2+340359 | 14:38:33.249 | 34:03:59.32 | 39.6 | group | 23.740.06 | 0.52 | 2 |
| 56) | NDWFS J143141.3+352110 | 14:31:41.253 | 35:21:09.86 | 39.5 | diffuse | 23.170.05 | 0.48 | 2 |
| 57) | NDWFS J143416.4+333058 | 14:34:16.420 | 33:30:58.10 | 39.3 | group | 23.260.05 | 0.46 | 2 |
| 58) | NDWFS J142516.6+324335 | 14:25:16.629 | 32:43:35.47 | 39.0 | group | 23.130.04 | 0.14 | 1 |
| 59) | NDWFS J143412.7+332939 | 14:34:12.722 | 33:29:39.19 | 38.7 | diffuse | 23.400.07 | 0.22 | 1hhfootnotemark: |
| 60) | NDWFS J142441.9+332532 | 14:24:41.940 | 33:25:31.94 | 38.4 | group | 23.520.04 | 0.38 | 1 |
| 61) | NDWFS J143438.7+350420 | 14:34:38.700 | 35:04:19.84 | 38.4 | diffuse | 23.720.05 | 0.46 | 2 |
| 62) | NDWFS J142832.7+354105 | 14:28:32.733 | 35:41:04.56 | 37.8 | group | 23.720.05 | -0.23 | 1 |
| 63) | NDWFS J143335.8+344503 | 14:33:35.764 | 34:45:02.84 | 37.5 | group | 23.920.06 | 0.33 | 1 |
| 64) | NDWFS J143203.8+351855 | 14:32:03.760 | 35:18:54.86 | 37.4 | group | 23.460.05 | 0.46 | 2 |
| 65) | NDWFS J143207.2+343101 | 14:32:07.224 | 34:31:01.34 | 37.3 | diffuse | 23.300.03 | 0.81 | 3 |
| 66) | NDWFS J142539.9+344959 | 14:25:39.859 | 34:49:59.19 | 37.1 | group | 23.570.04 | 0.14 | 1 |
| 67) | NDWFS J142819.7+325449 | 14:28:19.735 | 32:54:48.70 | 37.1 | group | 23.440.03 | 0.44 | 1 |
| 68) | NDWFS J142443.9+344834 | 14:24:43.869 | 34:48:34.45 | 36.9 | group | 23.640.05 | 0.37 | 1 |
| 69) | NDWFS J143202.6+351904 | 14:32:02.568 | 35:19:04.22 | 36.6 | diffuse | 22.990.04 | 0.42 | 1 |
| 70) | NDWFS J142753.8+341204 | 14:27:53.762 | 34:12:04.10 | 36.5 | diffuse | 23.290.04 | 0.45 | 1 |
| 71) | NDWFS J142600.8+350252 | 14:26:00.842 | 35:02:52.36 | 36.1 | diffuse | 23.870.06 | 0.63 | 3 |
| 72) | NDWFS J142643.9+340937 | 14:26:43.850 | 34:09:36.82 | 36.1 | group | 23.400.03 | 0.03 | 1 |
| 73) | NDWFS J142722.4+345225 | 14:27:22.408 | 34:52:24.74 | 35.9 | group | 23.710.05 | 0.29 | 1 |
| 74) | NDWFS J142620.0+340427 | 14:26:19.982 | 34:04:27.01 | 35.7 | group | 23.510.04 | -0.75 | 1 |
| 75) | NDWFS J142707.8+344749 | 14:27:07.840 | 34:47:48.84 | 35.4 | diffuse | 23.510.05 | 0.43 | 1 |
| 76) | NDWFS J142710.4+324842 | 14:27:10.447 | 32:48:41.76 | 35.4 | group | 23.090.04 | 0.41 | 1 |
| 77) | NDWFS J143232.5+351534 | 14:32:32.484 | 35:15:34.23 | 35.3 | group | 23.450.07 | 0.30 | 1 |
| 78) | NDWFS J143651.3+342107 | 14:36:51.312 | 34:21:07.38 | 35.1 | group | 23.710.05 | 0.28 | 1 |
| 79) | NDWFS J142746.3+344544 | 14:27:46.348 | 34:45:44.02 | 35.0 | group | 23.390.04 | 0.34 | 1 |
| 80) | NDWFS J142548.3+322957 | 14:25:48.283 | 32:29:56.58 | 35.0 | group | 23.830.06 | 0.12 | 1 |
| 81) | NDWFS J142735.5+342332 | 14:27:35.479 | 34:23:32.38 | 35.0 | group | 23.550.04 | -0.26 | 1 |
| 82) | NDWFS J142449.8+324743 | 14:24:49.761 | 32:47:42.61 | 34.9 | group | 24.090.09 | -0.74 | 1 |
| 83) | NDWFS J142732.5+341213 | 14:27:32.520 | 34:12:13.39 | 34.4 | group | 23.620.05 | -0.62 | 1 |
| 84) | NDWFS J142802.8+350933 | 14:28:02.803 | 35:09:33.30 | 34.2 | group | 23.800.06 | 0.35 | 1 |
| 85) | NDWFS J142533.0+343912 | 14:25:32.966 | 34:39:11.95 | 28.8 | diffuse | 23.670.06 | 0.26 | 3 |
| 11footnotetext: Morphological flag discussed in Section 2.2.6: group - tight grouping of compact sources, diffuse - spatially-extended diffuse emission. 22footnotetext: Magnitudes and colors were measured using large 30 pix (7.7″) diameter apertures. 33footnotetext: Priority assignments are discussed in Section 2.2.7. 44footnotetext: The two largest candidates are in fact part of a single diffuse, asymmetric, and mostly linear structure. The unusual morphology and large size suggest that this is more likely some sort of Galactic nebula rather than an extragalactic source. The optical spectrum (Paper II) does not show any obvious emission features, suggesting that this might be a reflection nebula. 55footnotetext: Our search recovered LABd05, the \lya nebula found previously by Dey et al. (2005). The listed coordinates are those returned by the search algorithm. 66footnotetext: Our search discovered PRG1, a \lya nebula at (Prescott et al., 2009, Paper II). 77footnotetext: Our search discovered PRG2, a \lya nebula at (Prescott, 2009, Paper II). 88footnotetext: Our search discovered PRG3, a \lya nebula at (Prescott, 2009, Paper II). 99footnotetext: Our search discovered PRG4, a \lya nebula at (Prescott, 2009, Paper II). |
| Survey | FieldaaAbbreviated field names correspond to the following: COSMOS1 & COSMOS2 - two pointings within the Cosmic Evolution Survey (COSMOS) field, CDF-N - Chandra Deep Field North, CDF-S - Chandra Deep Field South, B3J2330+3927 - a high redshift radio galaxy field, GOODS-N - Great Observatories Origins Deep Survey North field, J2143-4423 - a galaxy cluster field, LH - Lockman Hole field, NDWFS Boötes - NOAO Deep Wide-Field Survey Boötes field, SDF - Subaru Deep Field, SFLS - Spitzer First Look Survey field, SSA22 - Small Selected Area 22 field originally from Lilly et al. (1991), SXDS - Subaru/XMM-Newton Deep Survey, XMM-LSS - XMM-Newton Large Scale Structure Survey field. | Redshift | z | Area | Comoving Volume |
|---|---|---|---|---|---|
| (deg2) | ( h Mpc3) | ||||
| Matsuda et al. 2004 | SSA22 | 3.09 | 0.06 | 0.20 | 0.14 |
| Palunas et al. 2004 | J2143-4423 | 2.38 | 0.04 | 0.56 | 0.30 |
| Saito et al. 2006 | SXDS | 3.34 | 0.20 | 0.23 | 0.53 |
| SXDS | 3.72 | 0.22 | 0.23 | 0.56 | |
| SXDS | 3.93 | 0.24 | 0.23 | 0.60 | |
| SXDS | 4.12 | 0.24 | 0.23 | 0.59 | |
| SXDS | 4.35 | 0.26 | 0.23 | 0.62 | |
| SXDS | 4.58 | 0.28 | 0.23 | 0.65 | |
| SXDS | 4.82 | 0.26 | 0.23 | 0.59 | |
| Smith & Jarvis 2007 | XMM-LSS, LH, SFLS | 2.85 | 0.08 | 15bbExact survey area was not given in Smith & Jarvis (2007). | 14.7 |
| XMM-LSS, LH, SFLS | 3.00 | 0.14 | 15bbExact survey area was not given in Smith & Jarvis (2007). | 24.8 | |
| XMM-LSS, LH, SFLS | 3.12 | 0.08 | 15bbExact survey area was not given in Smith & Jarvis (2007). | 14.5 | |
| Matsuda et al. 2009 | B3J2330+3927 | 3.09 | 0.06 | 0.25 | 0.18 |
| Ouchi et al. 2009 | SXDS | 6.56 | 0.10 | 1.00 | 0.82 |
| Yang et al. 2009 | NDWFS Boötes | 2.30 | 0.04 | 4.82 | 2.14 |
| Yang et al. 2010 | CDF-N | 2.30 | 0.04 | 0.28 | 0.12 |
| CDF-S | 2.30 | 0.04 | 0.24 | 0.11 | |
| COSMOS1 | 2.30 | 0.04 | 0.36 | 0.16 | |
| COSMOS2 | 2.30 | 0.04 | 0.36 | 0.16 | |
| Matsuda et al. 2011 | SSA22 | 3.09 | 0.06 | 1.06 | 0.74 |
| SXDS | 3.09 | 0.06 | 0.60 | 0.42 | |
| GOODS-N | 3.09 | 0.06 | 0.24 | 0.17 | |
| SDF | 3.09 | 0.06 | 0.22 | 0.16 | |
| This work | NDWFS Boötes | 1.6-2.9 | 1.3 | 8.5 | 130 |
| Source | SurveyaaSpectroscopically confirmed \lya nebulae selected from a Subaru intermediate-band survey (Prescott et al. 2012, in preparation) and a Mayall intermediate-band survey (Prescott et al. 2012, in preparation) are listed along with \lya nebulae from the narrow-band survey by Yang et al. (2009). | Redshift | Isophotal AreabbIsophotal area determined using SourceExtractor and a detection threshold set to the median 1 surface brightness threshold of the NDWFS imaging (Section 4.2). | Surface BrightnessccMean surface brightness within the isophotal area determined using SourceExtractor (Section 4.2). | Notesdd“Too Faint” indicates that the diffuse emission was too faint to be selected by our survey. “Core-Halo” describes sources with a central compact continuum source surrounded by a \lya halo; these sources are partially or completely removed from the images during pipeline steps designed to remove bright stars and compact galaxies and are not selected by our survey. |
|---|---|---|---|---|---|
| (arcsec2) | (mag arcsec-2) | ||||
| LABd05 | Dey et al. (2005) | 2.7 | 54.4 | 27.0 | Recovered |
| P1 | Prescott et al. - Subaru | 2.7 | 27.6 | 27.3 | Too Faint |
| P2 | Prescott et al. - Subaru | 2.6 | 71.0 | 26.9 | Core-Halo |
| P3 | Prescott et al. - Mayall | 1.9 | 25.4 | 26.9 | Core-Halo |
| Y1 | Yang et al. (2009) | 2.3 | 20.4 | 26.7 | Core-Halo |
| Y2 | Yang et al. (2009) | 2.3 | 17.0 | 26.8 | Core-Halo |
| Y3 | Yang et al. (2009) | 2.3 | 36.6 | 25.9 | Core-Halo |
| Y4 | Yang et al. (2009) | 2.3 | 37.5 | 26.6 | Core-Halo |
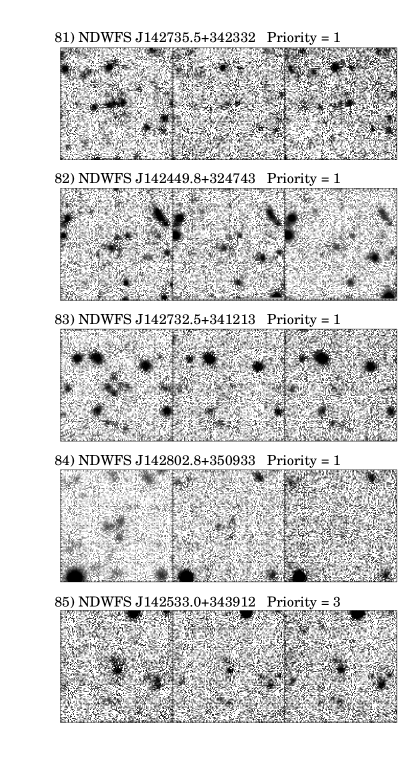
Appendix A Postage Stamps
Postage stamp images of the 79 \lya nebula candidates from our broad-band survey of the NDWFS Boötes field. The and -band images shown were used for morphological and color selection during the survey; the -band images are shown for reference.