The Type II supernovae 2006V and 2006au: two SN 1987A-like events††thanks: Based on observations collected at the European Organisation for Astronomical Research in the Southern Hemisphere, Chile (ESO Programme 076.A-0156). This paper includes data gathered with the 6.5-m Magellan Telescopes located at Las Campanas Observatory, Chile.
Abstract
Context. Supernova 1987A revealed that a blue supergiant (BSG) star can end its life as a core-collapse supernova (SN). SN 1987A and other similar objects exhibit properties that distinguish them from ordinary Type II Plateau (IIP) SNe, whose progenitors are believed to be red supergiants (RSGs). Similarities among 1987A-like events include a long rise to maximum, early luminosity fainter than that of normal Type IIP SNe, and radioactivity acting as the primary source powering the light curves.
Aims. We present and analyze two SNe monitored by the Carnegie Supernova Project that are reminiscent of SN 1987A.
Methods. Optical and near-infrared (NIR) light curves, and optical spectroscopy of SNe 2006V and 2006au are presented. These observations are compared to those of SN 1987A, and are used to estimate properties of their progenitors.
Results. Both objects exhibit a slow rise to maximum and light curve evolution similar to that of SN 1987A. At the earliest epochs, SN 2006au also displays an initial dip which we interpret as the signature of the adiabatic cooling phase that ensues shock break-out. SNe 2006V and 2006au are both found to be bluer, hotter and brighter than SN 1987A. Spectra of SNe 2006V and 2006au are similar to those of SN 1987A and other normal Type II objects, although both consistently exhibit expansion velocities higher than SN 1987A. Semi-analytic models are fit to the UVOIR light curve of each object from which physical properties of the progenitors are estimated. This yields ejecta mass estimates of , explosion energies of erg, and progenitor radii of for both SNe.
Conclusions. The progenitors of SNe 2006V and 2006au were most likely BSGs with a larger explosion energy as compared to that of SN 1987A.
Key Words.:
supernovae: general – supernovae: individual: SN 2006V, SN 2006au, SN 1987A1 Introduction
It is believed that hydrogen rich stars with masses larger than end their lives as Type II supernovae (SNe II). Such supernovae typically reach peak brightness on time scales of days to a few weeks after explosion, and often this is followed by a “plateau” phase lasting up to several months. The plateau phase is produced by the recombination of hydrogen in the ejecta and provides the namesake to the sub-type designated as Type IIP SNe (SNe IIP). Both theory and observations converge in asserting that the progenitors of SNe IIP are red supergiants (RSGs, see e.g. Grassberg et al. 1971). On the observational side, this can be inferred from the length of the plateau phase (Popov 1993), and the progenitors themselves, having in a handful of cases been identified in pre-explosion images (see Smartt 2009).
The best ever studied supernova – SN 1987A – showed that blue supergiants (BSGs) also produce SNe IIP, although with somewhat peculiar light curves. In this case the early bolometric luminosity was considerably smaller than for a typical SN IIP, suggesting that the majority of the explosion energy was used to adiabatically expand the compact BSG star. The light curves of SN 1987A displayed an unusually long rise to maximum and were mainly powered by the radioactive decay of and its daughter product 56Co (see Arnett et al. 1989 for a review on SN 1987A, including a discussion on its progenitor).
Given the impact of SN 1987A on our general understanding of SN physics, identifying additional objects which have BSG progenitors is of importance. Following the discovery of SN 1987A and its association with a BSG, 11 years passed before another similar SN was found. Like its predecessor, SN 1998A displayed a 100 day rise to maximum. It also exhibited higher expansion velocities and was more luminous (Woodings et al. 1998; Pastorello et al. 2005) than SN 1987A. Pastorello et al. (2005) argued that the progenitor of SN 1998A was a BSG. Kleiser et al. (2011) recently published a study of two other objects, SNe 2000cb and 2005ci, that may also have a BSG origin, and most recently, Pastorello et al. (2011) presented observations of SN 2009E which they argue to have a BSG progenitor as well.
In this paper we present observations obtained within the Carnegie Supernova Project (CSP; Hamuy et al. 2006) of the 1987A-like SNe 2006V and 2006au. We investigate the properties of these two SNe and compare their photometric and spectroscopic characteristics to SN 1987A and other peculiar SNe II. We find that these two objects have similar light curve shapes and spectral properties as SN 1987A. In what follows our data set is used to place limits on the physical parameters of their compact progenitor stars. From this analysis we suggest the progenitors of these SNe were BSGs.
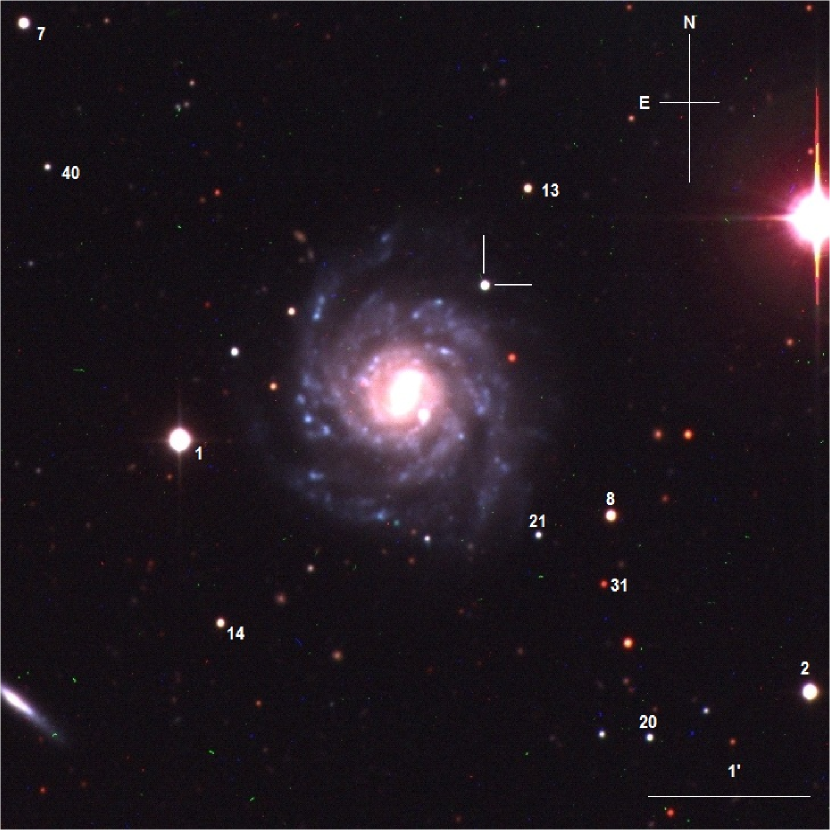
SN 2006V was discovered on 4.7 February 2006 UT (Chen et al. 2006) in the SAB(rs) galaxy UGC 6510 during the course of the Taiwan Supernova Survey. With J2000.0 coordinates , , the SN was positioned 321 West and 404 North from the host galaxy center (see Fig. 1). On 7.5 February UT, Blondin et al. (2006) spectroscopically classified SN 2006V as a Type II SN, and noted the absorption in H to be blue-shifted by roughly 4000 km s-1. According to the Nasa Extragalactic Database (NED), UGC 6510 has a heliocentric redshift . From the narrow H emission line measured in the optical spectra presented below, we measure a value of (the error corresponds to an uncertainty of km s-1). Adopting a Hubble constant of H0 = km s-1 Mpc-1 (Riess et al. 2011) our measured redshift from the spectra of SN 2006V corresponds to a distance of Mpc. Here we have taken into account peculiar motion corrections (Virgo+GA+Shapley, see Mould et al. 2000) and cosmological parameters of and .
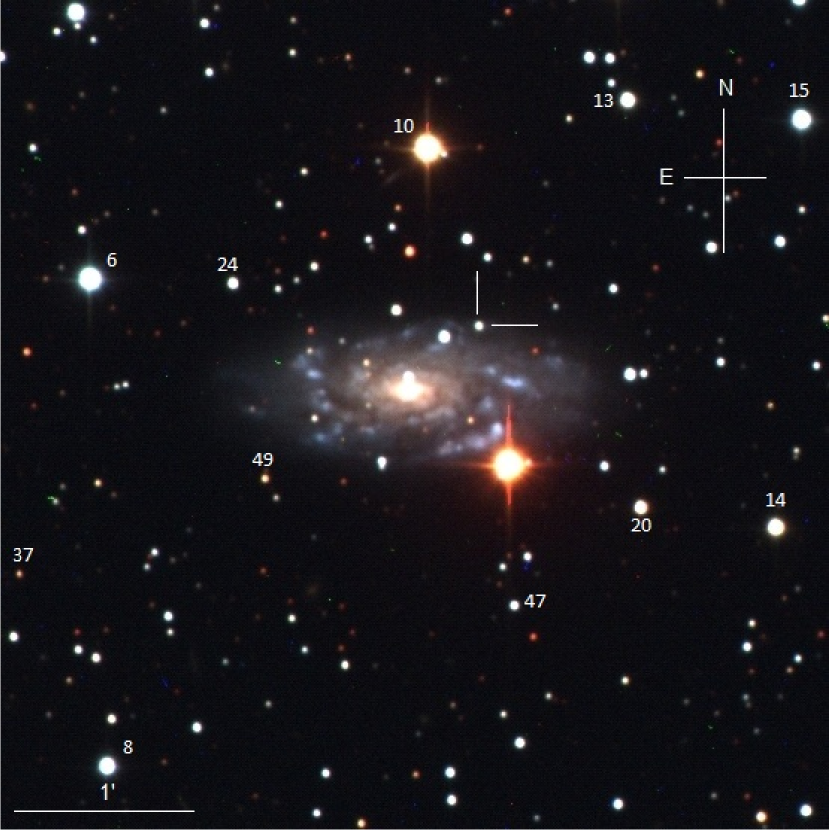
SN 2006au was discovered on 7.2 March 2006 UT in the Scd galaxy UGC 11057 by the Tenagra Observatory Supernova Search (Trondal et al. 2006). With J2000.0 coordinates , , this object was located 170 West and 182 North from the center of the host galaxy (see Fig. 2). On 13.6 March UT, Blanc et al. (2006) classified SN 2006au as a Type II SN, and noted a well developed H P-Cygni profile. NED lists a heliocentric redshift to UGC 11057 of , which is in agreement with the value measured from our spectra of . Our measured redshift to UGC 11057 corresponds to a distance of Mpc, where we again adopted the above-mentioned cosmology and peculiar motions.
The organization of this paper is as follows: Section 2 contains brief details regarding the observations and subsequent data reduction techniques; Section 3 presents the broad-band optical and near-infrared photometry; Section 4 contains the spectroscopic observations; Section 5 gives our discussion including a comparison with other 1987A-like objects and SNe from BSGs; and this is followed by our conclusions in Section 6.
2 Data Acquisition and Reduction
Broad-band imaging of SNe 2006V and 2006au was obtained with facilities at the Las Campanas Observatory (LCO). Optical () and near-infrared () imaging was performed with the Henrietta Swope 1-m and the Irénée du Pont 2.5-m telescopes equipped with CSP filters. The optical images were obtained with the Swope Direct Camera equipped with the CCD named Site 3, and with the du Pont Direct Camera equipped with the CCD named Tek 5. In the following we adopt Site 3 and Tek 5 as names to distinguish these cameras. Near-infrared imaging was obtained with RetroCam on Swope and with the Wide Field IR Camera (WIRC) on the du Pont. Details regarding these instruments and the bandpasses used are given in Hamuy et al. (2006), Contreras et al. (2010), and Stritzinger et al. (2011).
Detailed descriptions of the observing techniques and data reduction methodology can be found in Contreras et al. (2010); in what follows we briefly summarize the data reduction process. All optical images were reduced in a standard manner including: (i) bias subtraction, (ii) flat-field division, and (iii) the application of a shutter time and linearity correction. The near-infrared images were also reduced following several steps, consisting of (i) dark subtraction, (ii) flat-field division, (iii) sky subtraction, and (iv) geometric alignment and combination of the dithered frames.
Months after each SN faded, deep template images of their host galaxy were obtained under excellent seeing conditions. Optical and near-infrared template imaging was performed with the du Pont telescope using Tek 5 and WIRC. Following the method highlighted in Contreras et al. (2010), the template images allow us to subtract away the host background light at the position of the SN in each science image.
Observed magnitudes of each SN were computed differentially from the science frames with respect to a local sequence of stars. The photometric sequences were calibrated using Landolt (1992) (), Smith et al. (2002) () and Persson et al. (1998) () fields observed over a minimum of three photometric nights. The local sequences of SNe 2006V and 2006au in the standard system are provided in Table 1.
Nine epochs of optical spectroscopy were obtained for both SNe 2006V and 2006au with telescopes at LCO, and in one instance each, with the New Technology Telescope (NTT). A journal of the spectroscopic observations is provided in Table 2. Depending on the exact instrument used, the wavelength interval generally ranges from 3800 Å to 9500 Å. Standard reductions of each spectrum were performed as described in Hamuy et al. (2006). Briefly, this consisted of overscan correction, bias subtraction and flat-fielding. The 2-D spectra were then optimally extracted and wavelength calibrated with respect to arc lamps. The wavelength corrected spectra were corrected for telluric absorption through the division of a telluric standard spectrum, and then flux-calibrated. Multiple exposures of a particular object were then combined to produce a final high signal-to-noise science product. This allowed for the removal of cosmic rays.
3 Photometry
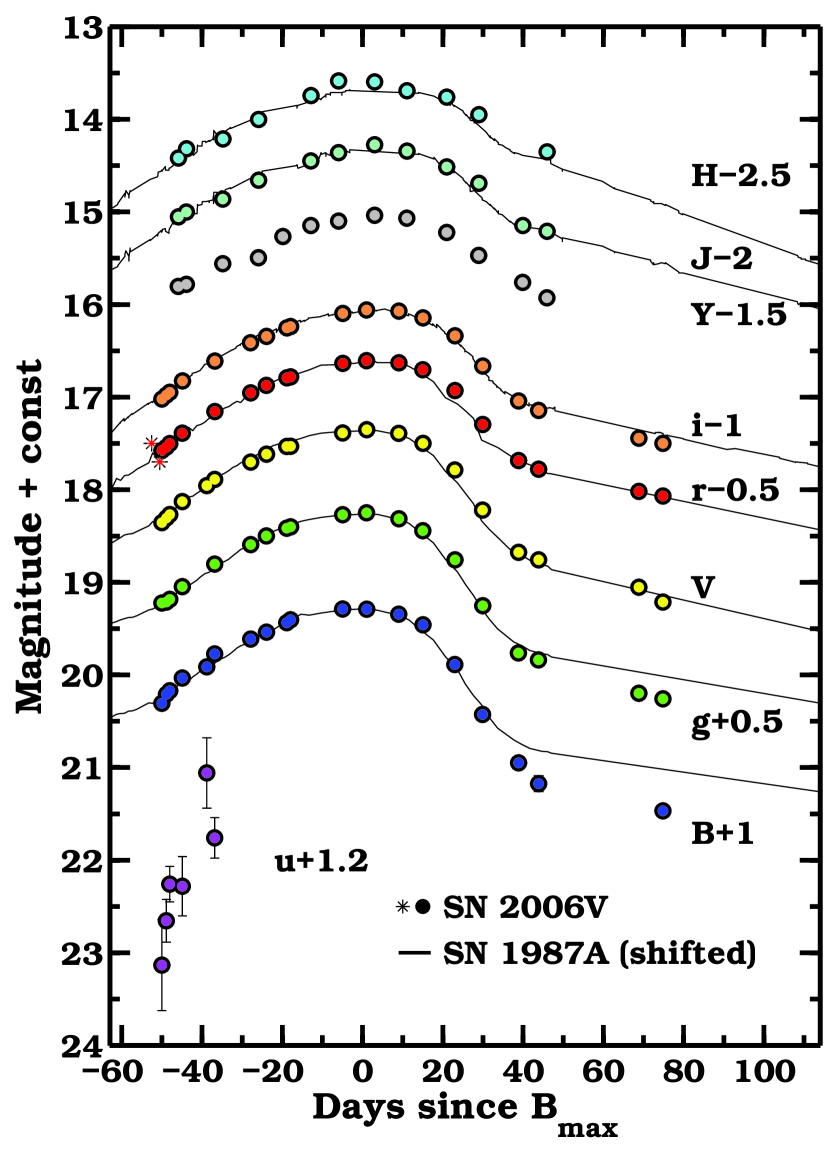
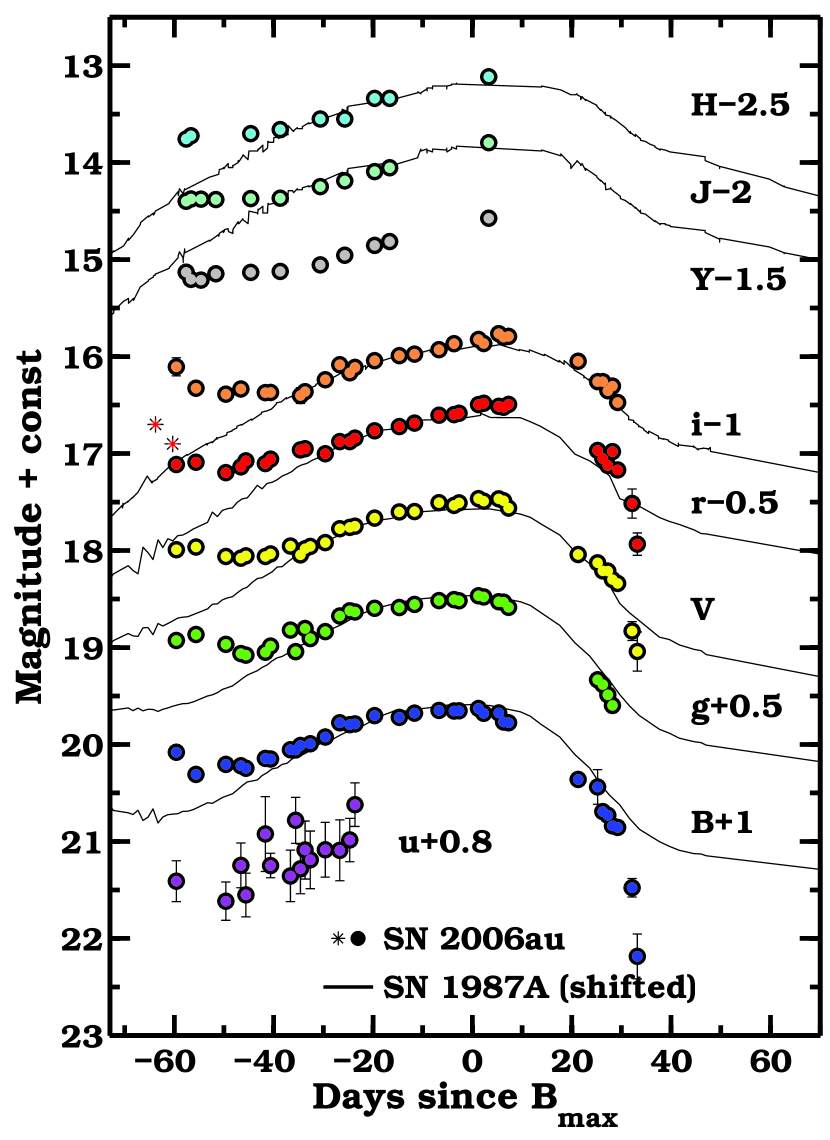
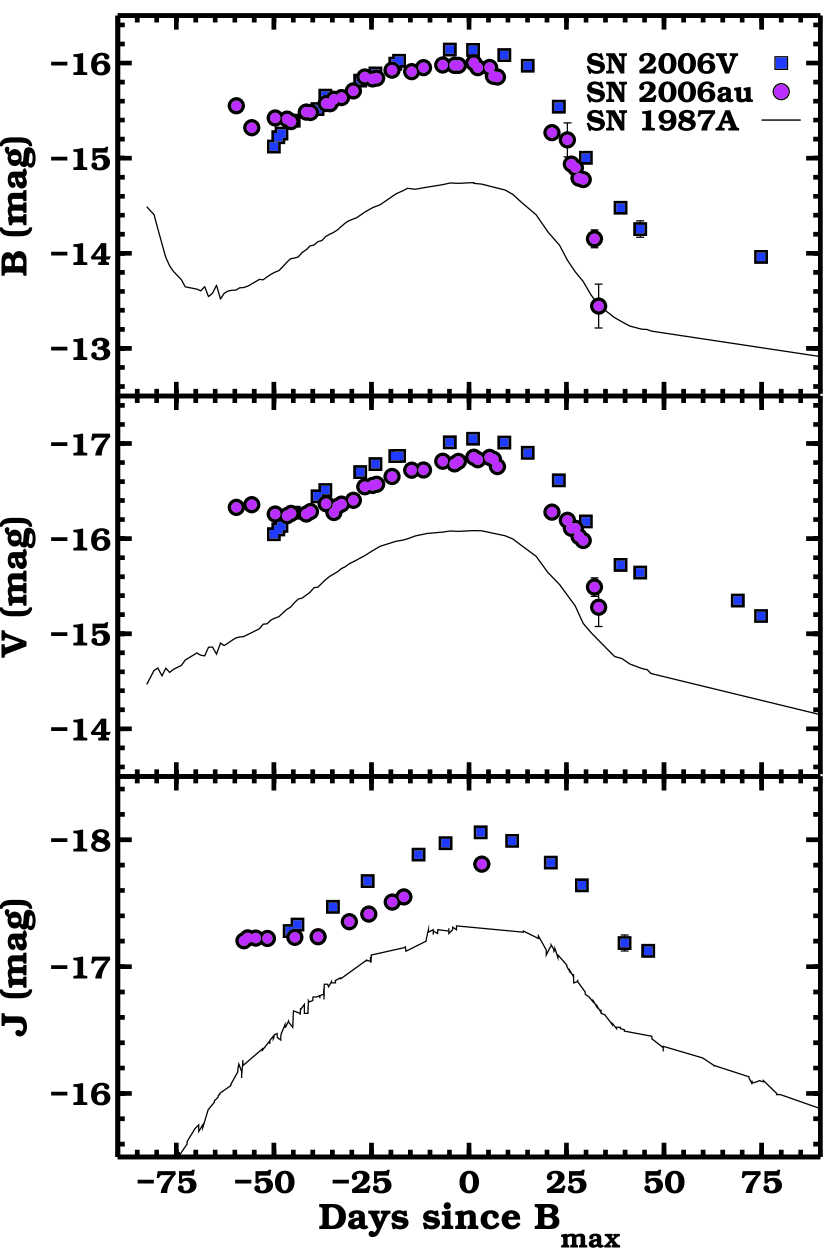
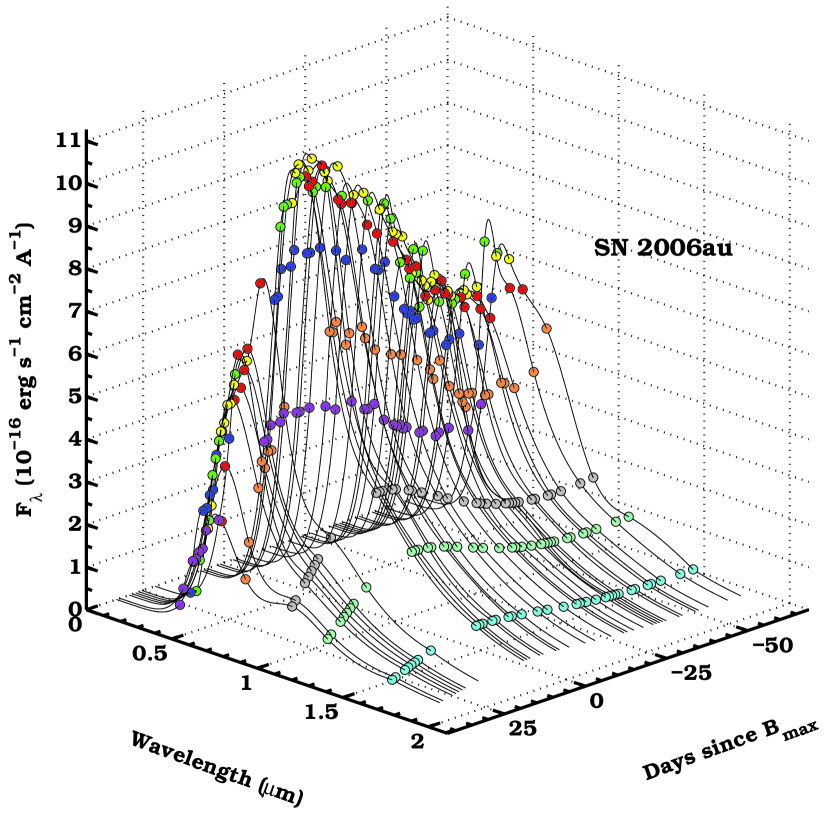
Optical and near-infrared light curves of SNe 2006V and 2006au are plotted in Figs. 3 and 4, respectively. The corresponding optical photometry – in the CSP natural system – is listed in Tables 3 and 5, whereas the final near-IR photometry in the Persson et al. (1998) system is listed in Tables 4 and 6. The differences in measured magnitudes between the natural and the standard system are insignificant for the purpose of this study (Hamuy et al. 2006), whereas they would be important for precision cosmology. The transformation equations between the two systems are reported in Hamuy et al. (2006), with updated color terms provided by Stritzinger et al. (2011). The light curves of SN 2006V follow the flux evolution from to days past -band maximum (, i.e. ), while those of SN 2006au range from to days past ().
The long rise to maximum, the broad peak and the subsequent decline to the radioactive tail are very similar to those shown by the light curve of SN 1987A. This is evident in Figs. 3 and 4, where we have also included for comparison the light curves of SN 1987A as thin solid lines. In particular, we show - and -band from Hamuy et al. (1988) and - and -band from Bouchet et al. (1989). , , and light curves of SN 1987A are synthetic magnitudes, which have been computed using CSP bandpasses and spectrophotometry published by Phillips et al. (1988).
Although both SNe 2006V and 2006au were spectroscopically classified as SNe II (Blanc et al. 2006; Blondin et al. 2006) their sustained rise to, and evolution through maximum, suggests they are more appropriately termed peculiar 1987A-like SNe (see also Pastorello et al. 2011).
Taking a closer look at the early phase evolution of SN 2006au, reveals that the light curves first decrease in brightness on a time-scale of weeks. This is most evident in the , and bands (the unfiltered/ magnitudes from discovery and confirmation images, Trondal et al. 2006, confirm this trend), followed to a lesser extent in the bands while the evolution in is nearly flat.
A similar evolution was observed in the - and -band light curves of SN 1987A (Hamuy et al. 1988), as well as in other core-collapse SNe caught just after explosion; e.g. SNe 1993J (Richmond et al. 1994), 1999ex (Stritzinger et al. 2002), 2008D (Malesani et al. 2009; Modjaz et al. 2009) and 2011dh (Soderberg et al. 2011). For these objects, that were all caught very early, this light curve evolution was interpreted as a sign of the photospheric cooling phase that ensues shock-wave breakout. The decreasing phase is not as evident in SN 2006au, but we propose a similar scenario for this supernova although its somewhat later discovery (see subsection 5.1) does not allow to see a clearly decreasing temperature at early epochs (see middle panel in Fig. 14).
The last photometric observations of SNe 2006V and 2006au were obtained at and days past , respectively. For this reason, we can only observe the linear decay phase for SN 2006V, whose optical light curves settle onto a similar radioactive decay slope as did SN 1987A. For SN 2006au no later phase data are available to map out the linear decline phase. However, we do note that at epochs later than +30 days past , the evolution appears to be faster than in the case of SN 1987A.
In order to estimate the absolute magnitudes and luminosities of SNe 2006V and 2006au, accurate estimates of Galactic reddening and reddening associated with dust in the host galaxies are needed. In the case of SN 2006V, NED lists a Galactic color excess value of mag (Schlegel et al. 1998). Close examination of our spectroscopic sequence of this object (Sect. 4) shows no evidence for Na i D absorption. The presence of Na i D is often considered to be a proxy for dust attenuation, therefore the lack of Na i D combined with the position of SN 2006V in the outskirts of its face-on galaxy suggests minimal host extinction. In the following we therefore assume zero host extinction for SN 2006V. Adopting the standard total-to-selective extinction value of (Cardelli et al. 1989) the total color excess in the direction of SN 2006V corresponds to a modest mag.
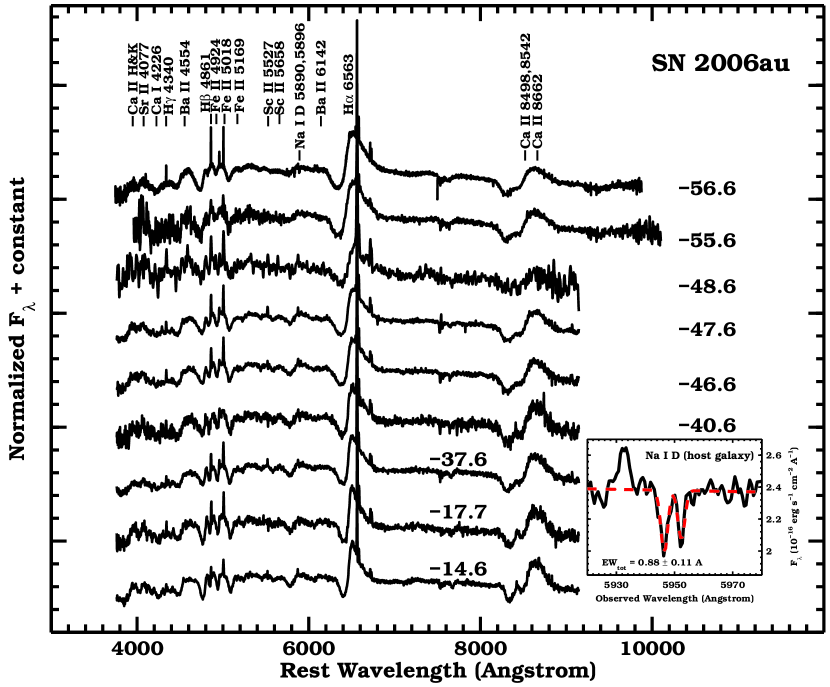
The Galactic color excess in the direction of SN 2006au is mag (Schlegel et al. 1998). Conspicuous Na i D absorption lines at the redshift of UGC 11057 are detected in the first spectrum of SN 2006au. This is shown in the inset of Fig. 8. Two Gaussian profiles were fit to the (unresolved) Na i D lines and a total equivalent width of 0.880.11 Å is measured. Using the Turatto et al. (2003) correlation between the Na i D equivalent width and host galaxy reddening suggests a host galaxy color excesses mag. This value might be affected by large uncertainty and lead to an overestimated host extinction, since we know that the Turatto et al. (2003) relation presents large scatter (see Poznanski et al. 2011). However, we combined this value with the Galactic color excess, obtaining mag, which corresponds to mag.
Armed with estimates of , the absolute magnitudes of SNe 2006V and 2006au are computed for each observed bandpass. Their peak values are given in Table 7. Compared to SN 1987A, SNe 2006V and 2006au are brighter in all bands. To demonstrate the differences, in Fig. 5 the absolute -, - and -band light curves of SNe 2006au and 2006V are compared to those of SN 1987A. SNe 2006V and 2006au show an absolute magnitude difference to SN 1987A of 1.5 mag and 1.3 mag respectively. The differences in the band are smaller ( 1.0 and 0.7 mag) and in the band are further reduced ( 0.8 and 0.5 mag).
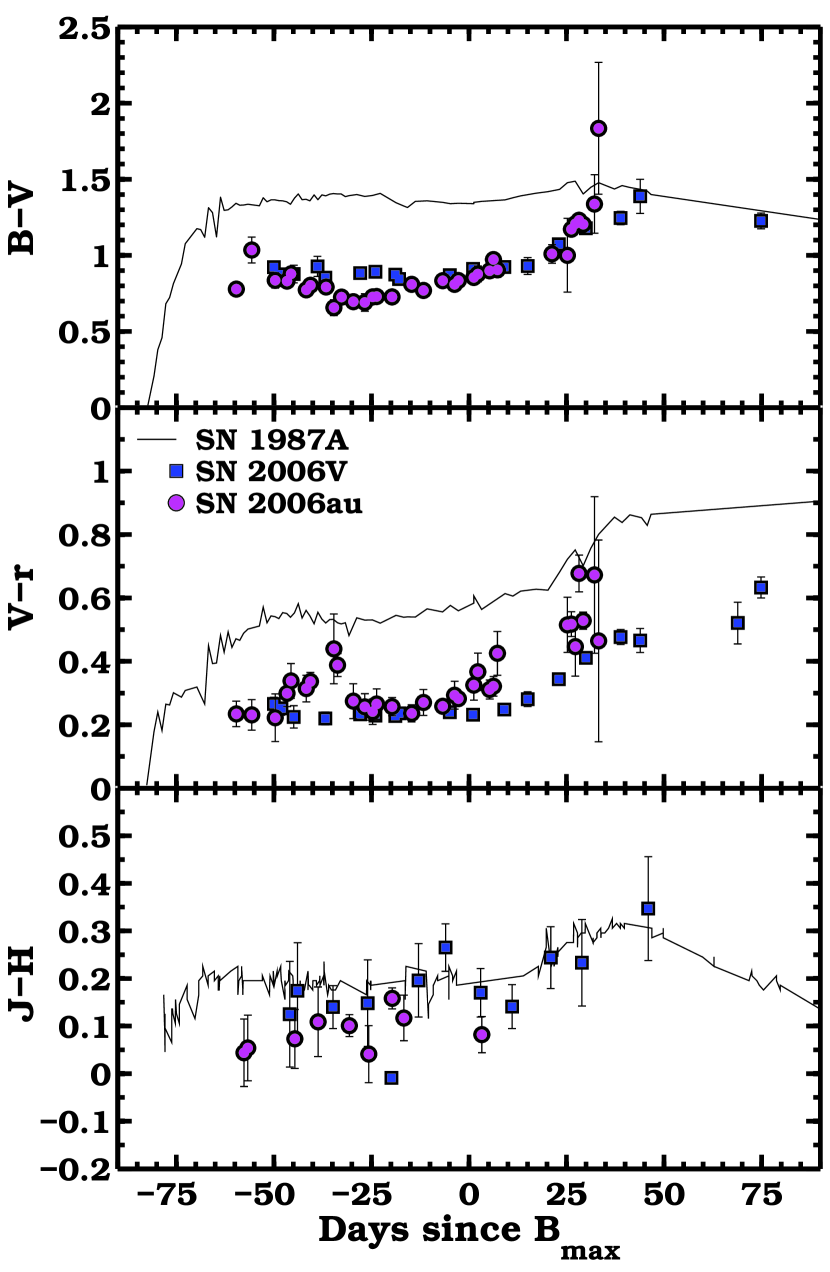
To gain insight into the photospheric temperatures, we plot in Fig. 6 the , and color curves of SNe 2006V and 2006au. The plot also includes the colors of SN 1987A. The photometry of each SN has been corrected for extinction adopting the values previously mentioned. Overall the optical colors of SNe 2006V and 2006au are bluer than for SN 1987A, particularly during the earliest epochs where the (top panel) and (middle panel) color differences amount to 0.7 mag and 0.3 mag, respectively. Later, around , the colors of our two objects evolve towards the red, and are at day 35 comparable to the color of SN 1987A. The color of SN 2006au follows a similar evolution (at the earliest epoch it is bluer than SN 1987A by 0.3 mag). In contrast, the color of SN 2006V is bluer than SN 1987A at all epochs. The near-infrared color (bottom panel) of SN 2006V is found to be similar to SN 1987A at all epochs, whereas for SN 2006au it is slightly bluer at the earliest phase (by 0.1 mag).
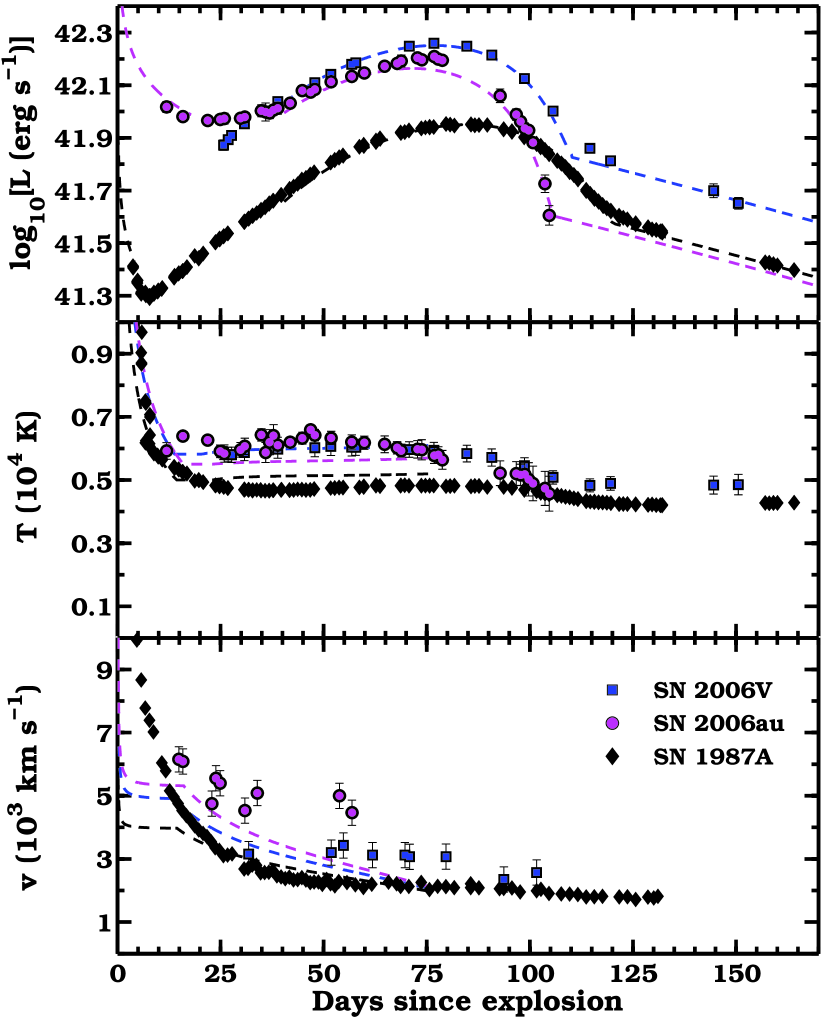
The color comparisons suggest that the photospheres of SNe 2006V and 2006au are at higher temperatures than for SN 1987A. This is confirmed by black-body fits to the spectral energy distributions (SEDs) obtained from each photometric epoch; see middle panel in Fig. 14. As shown in this plot, the black-body temperatures of SNe 2006V and 2006au are higher than for SN 1987A. We excluded and from the fits, given their significant deviation from the Planck function.
4 Spectroscopy
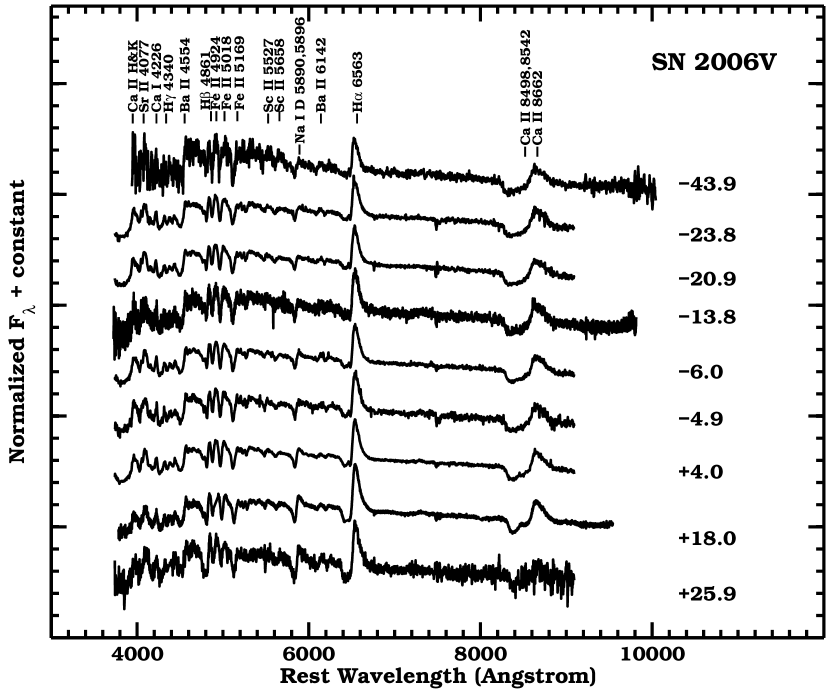
Spectroscopic sequences of SNe 2006V and 2006au are plotted in Figs. 7 and 8, respectively. The spectra of SN 2006V cover the flux evolution from day to relative to , and for SN 2006au from day to . The spectra of both objects exhibit common features typically observed in SNe II.
The earliest spectra of SN 2006V show all the typical features of a normal SN IIP at one month after the explosion. Together with spectral lines that are expected to be visible already at early phases (H, H, Ca HK and the NIR triplet), the Na i doublet and Fe ii lines become prominent, particularly those of the Fe ii multiplet 42.
Later on, weak lines of Sc ii (5527 Å, 5641-5669 Å, 6246 Å) and the unblended Ba ii 6162 are clearly visible. The subsequent spectra of SN 2006V show a modest evolution with the continuum becoming marginally redder with time. Strong line blanketing can be observed below 4400 Å. This is probably due to the increasing strength of lines of Cr ii, Ti ii, Fe i. In post-maximum spectra of SN 2006V a hint of the nebular Ca ii 7291-7323 Å is seen.
The spectra of SN 2006au are contaminated by the host galaxy background. A number of narrow lines due to underlying H ii regions are identified including: H, H, [O iii]. Nevertheless, the spectra of SN 2006au show an evident evolution, with Na i, Sc ii and Ba ii lines becoming more prominent with time. This is in good agreement with the fact that the first spectrum for SN 2006au was taken at an earlier phase than for SN 2006V. Unfortunately post-maximum spectra showing nebular features are not available for SN 2006au.
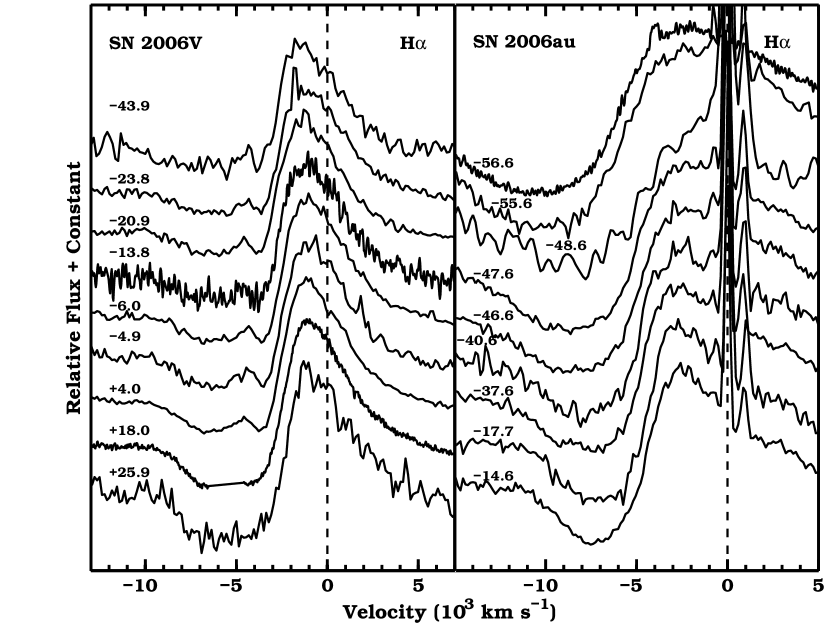
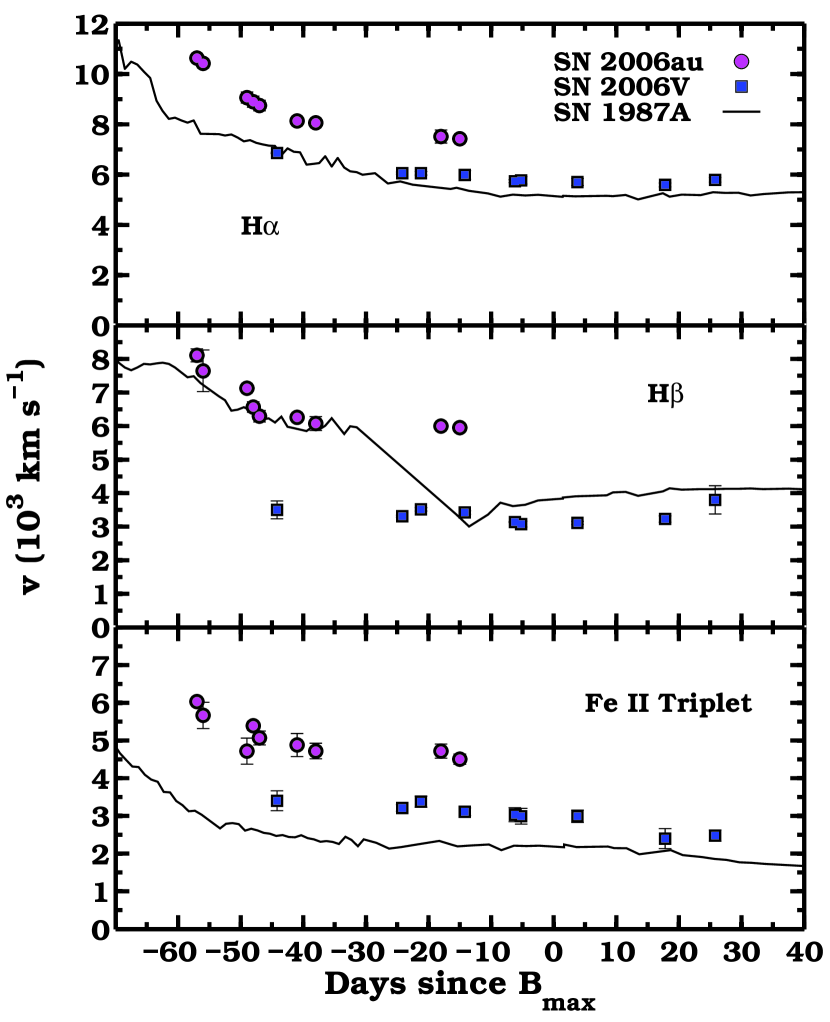
Plotted in Fig. 9 are the H profiles as a function of time. In the case of SN 2006au the minimum of the absorption clearly evolves towards lower velocities, while in SN 2006V, where the spectra were obtained at later epochs, the H velocity is nearly constant at 6000 km s-1. This is quantitatively shown in Fig. 10 where the expansion velocities of H (top panel), H (middle panel) and the Fe ii multiplet 42 (bottom panel) are measured from the minimum of their respective absorption features. Also included in this figure are the expansion velocities of SN 1987A measured from spectra published by Phillips et al. (1988). Following Meaburn et al. (1995), the spectra of SN 1987A were corrected for a redshift of km s-1. The expansion velocities of SN 2006au are clearly higher than for both of the other two objects, while SN 2006V shows marginally higher velocities than SN 1987A at nearly all epochs when we look at the Fe ii lines, which are indicative of the photospheric velocity.
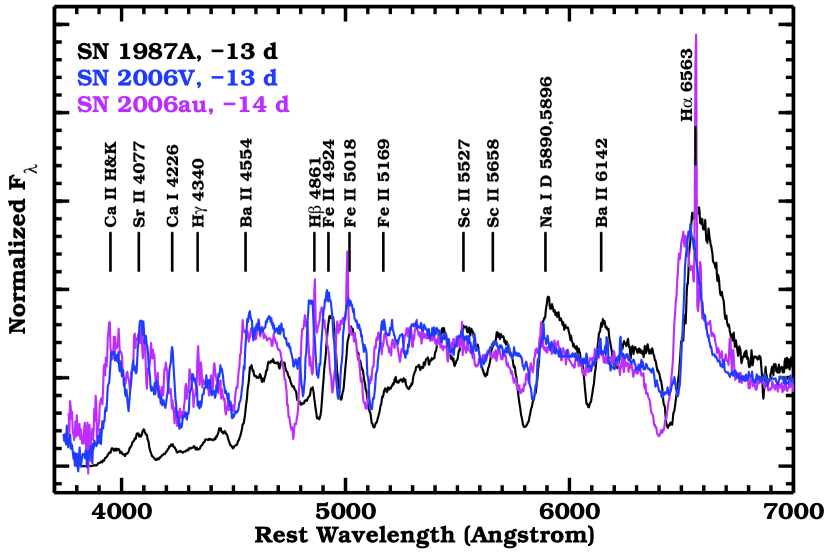
Finally, in Fig. 11 we compare spectra taken 2 weeks before maximum of SNe 1987A, 2006V and 2006au. Each spectrum has been corrected for extinction and redshift. In line with the color evolution, the spectra of SNe 2006V and 2006au appear to be bluer than those of SN 1987A. The blue region of the spectra is heavily suppressed in SN 1987A, whereas for SN 2006V and SN 2006au the flux is not much lower than in the red region. Indeed, for our objects, the shape of the spectral continuum is well approximated by a black body function of relatively high (6000 K) and almost constant temperature. Many of the common spectral features observed in typical SNe IIP are observed in the spectra of all three SNe, although the strength of several of the lines in the red portion of SN 1987A’s spectrum appear to be larger. This is particularly the case for Na i and Ba ii 6142. The strong Ba ii absorption line was suggested to be a signature of s-process element enhancements in the progenitor of SN 1987A (Williams 1987, but see also Utrobin & Chugai 2005).
Our objects exhibit fainter Ba ii features than SN 1987A (as is also the case for SN 2009E, see Pastorello et al. 2011). That is likely due to the higher temperature of the photosphere (see Fig. 14, middle panel). This can be verified noting that objects showing stronger Ba ii lines have also lower temperatures (SN 1997D, Turatto et al. 1998, and similar events, and the previously mentioned SNe 2009E and 1987A), whereas high ejecta temperature objects only show hints of such lines (or nothing at all; see e.g. SN 2009kf, Botticella et al. 2010). However, intrinsic differences in the composition can not be excluded. Williams (1987) also considered Sr ii lines as a signature of s-process element enhancements. Both our objects exhibit a strong absorption line at 4077 Å which might be associated with this ion. In addition, the overall line locations in SN 2006au are shifted to the blue compared to the other objects, which is expected from what was shown in Fig. 10.
5 Analysis and discussion
The remarkable similarity between the light curve shapes of SNe 2006V and 2006au compared to SN 1987A suggests that these objects are also mainly powered by the radioactive decay of . Moreover, early luminosities of SN 1987A-like events are fainter than those of normal SNe IIP (see e.g. Bersten & Hamuy 2009). This is consistent with a scenario involving a relatively compact progenitor star which spends the majority of its explosion energy on adiabatic expansion.
In order to derive the physical parameters of the progenitors, a reasonably accurate estimation of the explosion dates and the computation of the bolometric light curves are required. In the following two subsections we discuss the methods and the results concerning these two aspects.
5.1 Explosion dates from the expanding photospheric method
Using the light curve of SN 1987A as a template, Pastorello et al. (2005) assumed that the peak for SN 1998A was coincident in phase with the peak of SN 1987A. This was also consistent with the constraints from the last non-detection epoch close to discovery.
The discovery date of SN 2006V is , about 45 days from the last non-detection, (Chen et al. 2006). For SN 2006au this interval is even longer, since the discovery, , occured more than one year since the previous non-detection, (Trondal et al. 2006).
Therefore we explore an alternative approach for the determination of the explosion date. Having a set of 9 spectra for each SN, we used the expanding photospheric method (EPM), as presented by Jones et al. (2009). This method is generally used to find the distance of SNe IIP. In our case we have already an independent measure of the distance () and we can instead use the EPM to constrain the explosion date (), by using the following procedure:
(i) We checked and, if necessary, adjusted the flux-calibration of our observed spectra by matching synthetic photometry to the broad-band photometry.
(ii) We then computed synthetic magnitudes in the Johnson-Kron-Cousin filters from each redshift-corrected spectrum. Here only spectra obtained prior to were considered since the EPM method is most reliable at these phases.
(iii) A black-body spectrum was fit to the synthetic magnitudes in order to estimate the temperature, , and thereby the photospheric radius divided by the SN distance, , multiplied by the dilution factor, . In the SN ejecta the thermalization surface emits radiation, which is diluted by scattering before reaching the observer. The dilution is mainly affected by the temperature, as shown in Eastman et al. (1996) and Dessart & Hillier (2005).
(iv) The dilution factor is estimated according to Jones et al. (2009, see their Table 2) using the expression given for temperatures computed from and -band synthetic magnitudes and redshift . In doing so the expression based on the atmosphere modeling of Dessart & Hillier (2005) was adopted. The small dependence of the dilution factor on density is ignored.
(v) For each spectrum we considered the velocity, , obtained from the blueshift of the Fe ii 5169 absorption, which is a reasonable proxy for the photosphere velocity (e.g. Dessart & Hillier 2005, see their Fig. 14).
(vi) Using , an explosion date was then computed for each spectrum and the final value was obtained through their weighted mean.
The resulting explosion epochs are JD and JD. These explosion dates are consistent with the constraints provided by the discovery dates and by the last non-detection dates. With the aid of SNID, the first spectrum of SN 2006au, taken on JD 2453808.9, was compared to the library of spectra of SN 1987A. This exercise suggests this spectrum was most similar to SN 1987A approximately 10.9 days after the explosion. If we assume the same phase for our spectrum, a slightly later (4 days) explosion date for SN 2006au is obtained. This is consistent with the confidence interval obtained from the EPM analysis. Adopting the EPM estimate of , the shock break-out cooling tail is found to cover a period of days, which is similar to that of SN 1993J (Richmond et al. 1994). In the case of SN 2006V, a SNID analysis did not provide a clear-cut estimate for the phase of our earliest spectra.
5.2 Bolometric light curves
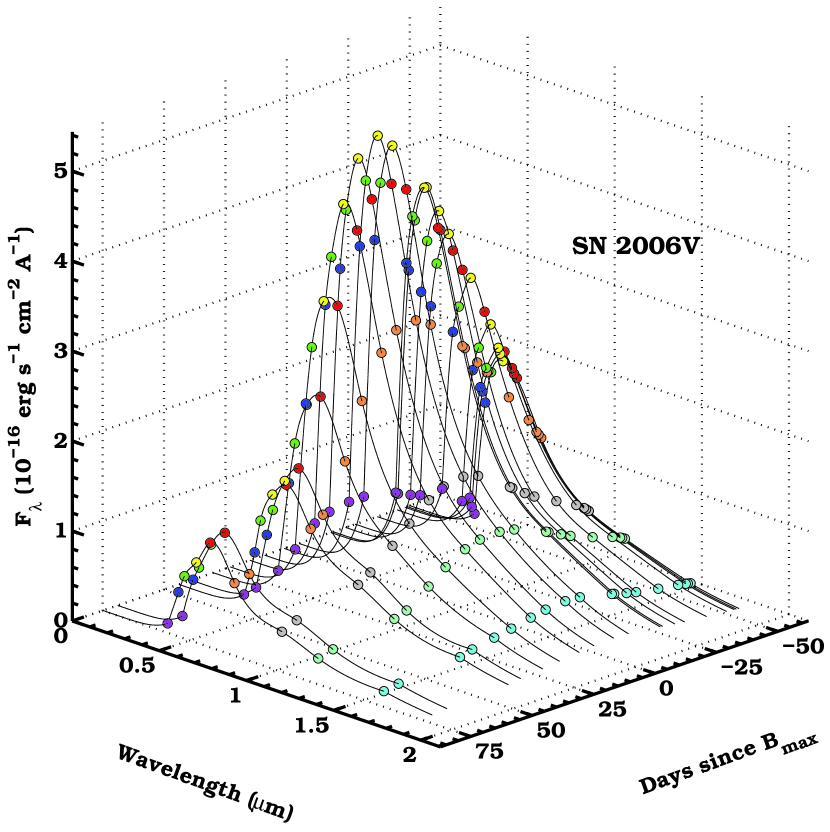
The broad wavelength coverage afforded by our multi-band observations allows us to construct nearly complete bolometric light curves of SNe 2006V and 2006au. To do so the near-infrared light curves were first interpolated to obtained magnitudes at the epochs observed in the optical. The optical and near-infrared magnitudes were converted to flux at the effective wavelength of each filter. To overcome the lack of -band photometry, magnitudes were extrapolated assuming, , with the average measured during the rising phase. In doing so, we assumed a 0.6 mag error in each extrapolated point. Next a cubic spline was fit to the SEDs at each observed epoch, and this is integrated over wavelength. In addition, a Rayleigh-Jeans (RJ) tail was included to the overall SED to account for flux redwards of the band, along with a Wien tail to cover the UV flux. The resulting SEDs are plotted in Figs. 12 and 13, along with the spline fits and the UV and IR tails. We elected to fit a spline rather than a blackbody to avoid over-estimating the flux in the and bands (Terndrup et al. 1988). As shown by Hamuy et al. (1988), the inclusion of a Rayleigh-Jeans tail is a good approximation for the case of SN 1987A.
Plotted in Fig. 14 (top panel) are the bolometric light curves of SNe 2006V, 2006au and 1987A. Our bolometric light curve of SN 1987A differs slightly from the one in Hamuy et al. (1988) because we used a higher extinction estimate, mag (Woosley et al. 1987). As indicated by these light curves, SNe 2006V and 2006au are more luminous than SN 1987A, reaching peak luminosities of log 42.25 erg s-1 and log 42.2 erg s-1, respectively. The peak luminosity of SN 1987A is fainter, with log 41.90 erg s-1.
5.3 Physical parameters of the progenitors
With the estimates of from the EPM analysis and the computed bolometric light curves in hand, we next proceed to determine the physical parameters of the progenitors of both our SNe. Initial rough estimates of the ejected mass () and of the explosion energy () can be obtained if we simply scale these parameters with respect to what has been determined for SN 1987A; erg and (Blinnikov et al. 2000). In order to do that, we can use the relation from Arnett (1979), where is the diffusion time, is the mean opacity, and is a measure of the expansion velocity. The relation between the diffusion time of our objects and SN 1987A is and , as measured from the time of the bolometric peaks, see top panel in Fig. 14. If we now assume the same mean opacity for each SN, and use an average ratio between the expansion velocities as measured from the Fe ii at 5169, ( 1.4 for SN 2006V and 1.7 for SN 2006au see bottom panel in Fig. 14), the ejecta mass for both objects is found to be with corresponding () kinetic energies of a few foe. These simple estimates give a first hint on the nature of the progenitors.
From the bolometric light curve one can also constrain the amount of synthesized in the explosion. The daughter decay product of is 56Co, and it is the decay of 56Co to 56Fe that powers the late-time light curve. Unfortunately our photometric coverage of SN 2006au does not extend beyond 105 days after the explosion, so only an upper limit on the mass can be estimated. This is done by assuming the last photometric epoch belongs to the linear decay phase, where . We thus obtain . In contrast, the photometric coverage of SN 2006V (up to 150 days after the explosion) is sufficient to directly measure the mass from the linear decay phase. In doing so, we compute .
Following the plateau luminosity relation presented by Popov (1993), , and scaling with the radius of SN 1987A, cm (Woosley 1988), a rough estimate of the progenitor radius of SNe 2006V and 2006au can be inferred. We note that this approach has been followed by Kleiser et al. (2011) for estimating the progenitor radius of SN 2000cb, although Popov (1993) developed the plateau luminosity relation for SNe whose emission was nonradioactive. Such a simple scaling implies radii of for both objects, which clearly suggests a very compact progenitor for our objects.
To confirm these estimates of the progenitor and explosion parameters, we turn to the semi-analytic model of Imshennik & Popov (1992). This model includes cooling and recombination, and has been shown to provide a good fit to the bolometric light curve of SN 1987A (Imshennik & Popov 1992). As this model is not applicable to the earliest phases, it is fit only to the bolometric light curves of SNe 1987A, 2006V and 2006au at epochs after 40 days past explosion. Adopting a mean opacity cm2g-1, and the same exponential distribution of as used by Imshennik & Popov (1992) to fit the bolometric light curve of SN 1987A, , , and are estimated for all three objects.
In the case of SN 2006au we assume a that is equal to the upper limit estimated from the last photometric epoch. On the other hand, for this SN we can provide additional constraints, in particular on the progenitor radius, by using the initial dip in the light curve. This was done for SN 1987A, whose light curves also contain a shock break-out cooling tail. Chevalier (1992) provides an analytical expression for the luminosity of the early-time light curve of SN 1987A and similar SNe, in terms of , and . The luminosity function given by Chevalier (1992) is erg s-1. is the factor by which each gas element increases in velocity from to very late times. Following Chevalier (1992) we adopt . As this expression overestimates the luminosity of SN 1987A by a factor of 2, we scale it by this factor in order to fit the early epochs for both SNe 1987A and 2006au.
The best simultaneous fits to the bolometric light curves with the Imshennik & Popov (1992) model and the Chevalier (1992) analytic expression are shown in Fig. 14 (top panel) as dashed lines. The Imshennik & Popov (1992) model allows us to also constrain the ionization temperature, , which strongly affects the light curve shape, by fitting the effective temperature before (dashed lines in the middle panel of Fig. 14). During the recombination phase the photospheric velocity estimated from Fe ii 5169 has also been fit in order to better constrain the energy and mass (dashed lines in the bottom panel of Fig. 14).
Our estimates for SN 2006V are as follows: , erg, and .
The model for SN 2006au gives: , erg, and .
The parameters for SN 1987A are: , erg, and . The latter is in reasonable agreement with the values inferred from hydrodynamical simulations (Blinnikov et al. 2000).
Clearly the adopted semi-analytic model relies on significant simplifications and therefore one can not expect an exact fit to the data. However, it does provide a set of reasonable physical parameters. The mass and energy estimates of our objects are somewhat lower than those obtained from the simple scaling relations, and at the same time, are larger than those obtained for SN 1987A. The progenitor radii estimates from the semi-analytic models are larger than those estimated from the simple scalings, and somewhat larger than what is computed for the progenitor of SN 1987A. Nevertheless, our estimates on the radii suggests that the progenitors of SNe 2006V and 2006au were compact stars. Note that if the same elapsed time between epochs of explosion and maximum for SNe 2006V and 2006au had been assumed as for SN 1987A, larger estimates of mass and energy would have been obtained, especially for SN 2006au ( ). The estimate would also have been slightly enhanced, while the radius estimate would not change significantly. Even in this case the compact star scenario would be favoured.
5.4 1987A-like and BSG Supernovae
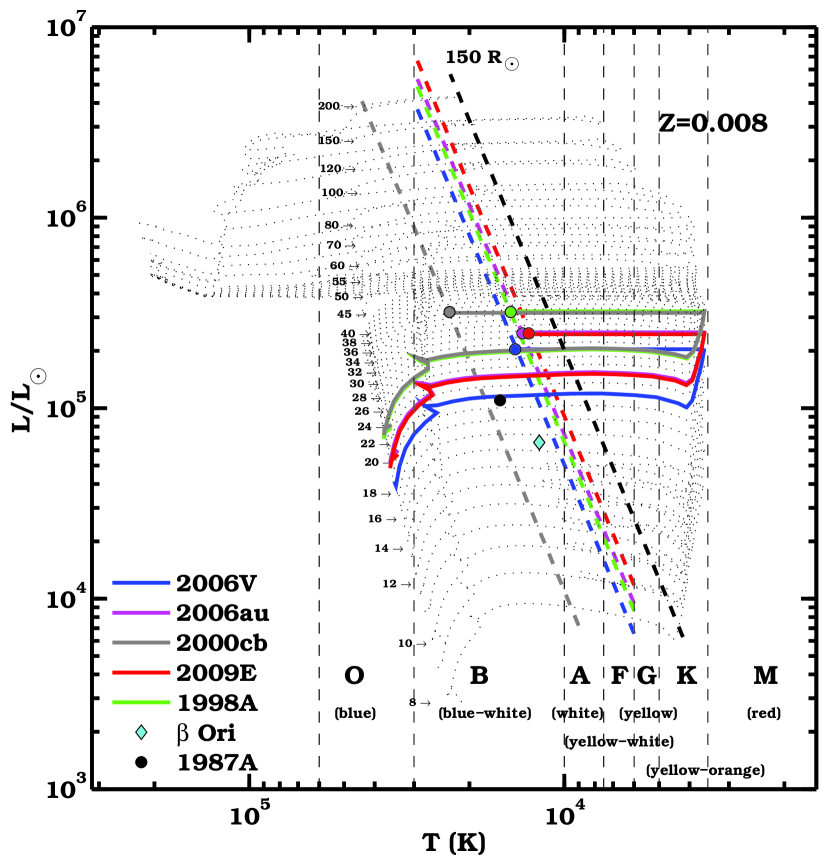
SNe 2006V and 2006au are important additions to the small family of 1987A-like supernovae. The observational properties of these SNe are summarized by Pastorello et al. (2011), and we note that our SNe are among the best sampled in that collection. Among the five best studied 1987A-like objects (SNe 1998A, 2000cb, 2006V, 2006au and 2009E), our two SNe display the intrinsically brightest light curves (see Pastorello et al. 2011, their Table 5). Table 8 contains a summary of the derived physical parameters of these five objects. Here one can see that this family of SNe all appear to have ejecta masses of about . The amount of ejected radioactive nickel is also consistently . With the exception of SN 2009E, the members of this group are energetic versions of SN 1987A, as elaborated in the case of SN 2000cb by Utrobin & Chugai (2011). Finally, the radii of these stars are consistently found to be relatively small (). This provides the strongest argument for their progenitors to be BSGs.
We note that an estimate of the radius does not univocally determine the color of the progenitor star. Indeed some yellow and red supergiants may also have radii of . A luminosity estimate of the progenitor is also required to infer its temperature, and this can be provided by the final epoch of the evolutionary track within the Hertzsprung-Russel (HR) diagram as computed with the STARS code (Eldridge & Tout 2004). The path is computed according to the mass estimate of each progenitor, roughly given by the ejecta mass from our model, and adding 2 to account for the central compact object. The computed Zero Age Main Sequence (ZAMS) masses belong to the range 19-24 . The HR path for each 1987A-like SN in Table 8 is shown in Fig. 15. This shows that the progenitors of these SN 1987A-like events clearly belong to the B (blue-white) spectral type, as was also the case for the directly detected progenitor of SN 1987A (Woosley 1988). This spectral type is characterized by temperatures between 10000 and 30000 K, and we do find all the progenitors within this range. Note, however, that the evolutionary tracks from the STARS code do not actually contain stars which end their lives as BSGs, since in their final state they are all positioned in the RSG part of the diagram (in Fig. 15 the inversions of the evolutionary paths towards the BSG state have been drawn to be consistent with the computed radii). The physical reason why stars do explode as BSG was discussed already for SN 1987A (Arnett et al. 1989; Podsiadlowski 1992), but it is still not settled if this is due to metallicity or binary evolution.
In any case, the characteristic small progenitor radii in conjunction with the relatively high ejecta masses of these 1987A-like SNe allow us to reject a red supergiant origin. Even the yellow supergiant progenitors that have recently been suggested (see Maund et al. 2011, their Figure 4) favour a position in the HR diagram compatible with larger radii ().
The final explosion of a BSG can apparently proceed in different ways, as can be seen from the diversity that is present in Table 8. It would be of interest to enlarge this sample, and to model them all in a consistent way. Such an effort is underway (see Pastorello et al. 2011). It is also clear that these events are intrinsically quite rare, and this is likely the reason why these massive BSG progenitors have not yet shown up in direct detections (Smartt 2009).
6 Conclusions
We have presented extensive observations of two SNe that have been shown to exhibit similarities to SN 1987A. Just as SN 1987A, both objects show a slow rise to the peak, with SN 2006V reaching 76 days past explosion and SN 2006au after 72 days. Detailed inspection show, however, that these SNe display faster velocities and higher luminosities compared to SN 1987A. These observational parameters also suggest that our objects have higher explosion energies than SN 1987A.
SN 2006V shows the highest luminosity, and produced the largest amount of , . For SN 2006au only an upper limit on the mass can be made, . However, this is comparable to what SN 1987A produced.
A semi-analytic model was applied to the bolometric light curves of both SNe 2006V and 2006au that suggests the radii of these objects are consistent with a BSG progenitor. When comparing the small family of objects in the literature thought to have a BSG origin, we find that their progenitors exhibit a wide range in masses, radii, explosion energies, and production.
Acknowledgements.
The Oskar Klein Centre is funded by the Swedish Research Council. The Dark Cosmology Centre is funded by the Danish National Research Foundation. This material is based upon work supported by NSF under grants AST–0306969, AST–0908886, AST–0607438, and AST–1008343. M. Hamuy and J.P. Anderson acknowledge support by CONICYT through FONDECYT grants 1060808 and 3110142, Centro de Astrofisica FONDAP 15010003, Centro BASAL CATA (PFB-06), and by the Millenium Center for Supernova Science (P06-045-F, P10-064-F). We acknowledge C. Burns, L. Boldt, C. Contreras, A. Campillay, W. Krzeminski, M. Roth, F. Salgado, B. Madore and N. Suntzeff for their support.References
- (1)
- Arnett (1979) Arnett, W. D. 1979, ApJ, 230, L37
- Arnett et al. (1989) Arnett, W. D., Bahcall, J. N, Kirshner, R. P, & Woosley, S. E. 1989, ARA&A, 27, 629
- Bersten & Hamuy (2009) Bersten, M. C., & Hamuy, M. 2009, ApJ, 701, 200
- Blanc et al. (2006) Blanc, N., Copin, Y., Gangler, E., et al. 2006, CBET, 427, 1
- Blinnikov et al. (2000) Blinnikov, S., Lundqvist, P., Bartunov, O., Nomoto, K., & Iwamoto, K. 2000, ApJ, 532, 1132
- Blondin et al. (2006) Blondin, S., Modjaz, M., Kirshner, R., Challis, P., & Calkins, M. 2006, CBET, 392, 1
- Botticella et al. (2010) Botticella, M. T., Trundle, C., Pastorello, A., et al. 2010, ApJ, 717, L52
- Bouchet et al. (1989) Bouchet P., Slezak, E., Le Bertre, T., Moneti, A., & Manfroid, J. 1989, A&AS, 80, 379
- Cardelli et al. (1989) Cardelli, J. A., Clayton, G. C., & Mathis, J. S. 1989, ApJ, 345, 245
- Chen et al. (2006) Chen, Y. T., Yang, M., Lin, C. S. 2006, CBET, 390, 1
- Chevalier (1992) Chevalier, R. A. 1992, ApJ, 394, 599
- Contreras et al. (2010) Contreras C., Hamuy, M., Phillips, M. M., et al. 2010, AJ, 139, 519
- Dessart & Hillier (2005) Dessart, L., & Hillier, D. J. 2005, A&A, 439, 671
- Eastman et al. (1996) Eastman, R. G., Schmidt, B. P., & Kirshner, R. 1996, ApJ, 466, 911
- Eldridge & Tout (2004) Eldridge, J. J., & Tout, C. A. 2004, MNRAS, 353, 87
- Glatt et al. (2010) Glatt, K., Grebel, E. K., & Koch, A. 2010, A&A, 517, A50
- Grassberg et al. (1971) Grassberg, E. K., Imshennik, V. S., & Nadyozhin, D. K. 1971, Ap&SS, 10, 28
- Hamuy et al. (2006) Hamuy, M., Folatelli, G., Morrell, N., & Phillips, M. M. 2006, PASP, 118, 2
- Hamuy et al. (1988) Hamuy, M., Suntzeff, N. B., Gonzalez, R., & Martin, G. 1988, AJ, 95, 63
- Imshennik & Popov (1992) Imshennik, V. S., & Popov, D. V. 1992, Astron. Zh. 69, 497
- Jones et al. (2009) Jones, M. I., Hamuy, M., Lira, P., et al. 2009, ApJ, 696, 1176
- Kleiser et al. (2011) Kleiser, I. K. W., Poznanski, D., Kasen, D., et al. 2011, MNRAS, 415, 372
- Landolt (1992) Landolt, A. U. 1992, AJ, 104, 340
- Malesani et al. (2009) Malesani, D., Fynbo, J. P. U., Hjorth, J., et al. 2009, ApJ, 692, L84
- Maund et al. (2011) Maund, J. R., Fraser, M., Ergon, M., et al. 2011, arXiv:1106.2565
- Meaburn et al. (1995) Meaburn, J., Bryce, M., & Holloway, A. J. 1995, A&A, 299, L1
- Modjaz et al. (2009) Modjaz, M., Li, W., Butler, N., et al. 2009, ApJ, 702, 226
- Mould et al. (2000) Mould, J. R., Huchra, J. P., Freedman, W. L., et al. 2000, ApJ, 529, 786
- Pastorello et al. (2005) Pastorello, A., Baron, E., Branch, D., et al. 2005, MNRAS, 360, 950
- Pastorello et al. (2011) Pastorello, A., Pumo, M. L., Havasardyan, H., et al. 2011, A&A, accepted, arXiv:submit/0355717
- Persson et al. (1998) Persson, S. E., Murphy, D. C., Krzeminski, W., Roth, M., & Rieke, M. J. 1998, AJ, 116, 2475
- Phillips et al. (1988) Phillips, M. M., Heathcote, S. R., Hamuy, M., & Navarrete, M. 1988, AJ, 95, 1087
- Podsiadlowski (1992) Podsiadlowski, P. 1992, PASP, 104, 717
- Popov (1993) Popov, D. V. 1993, ApJ, 414, 712
- Poznanski et al. (2011) Poznanski, D., Ganeshalingam, M., Silverman, J. M., & Filippenko, A. V. 2011, MNRAS, 415, L81
- Richmond et al. (1994) Richmond, M. W., Treffers, R. R., Filippenko, A. V., et al. 1994, AJ, 107, 1022
- Riess et al. (2011) Riess, A. G., Macri, L., Casertano, S., et al. 2011 ApJ, 732, 129
- Schlegel et al. (1998) Schlegel, D. J., Finkbeiner, D. P., & Davis, M. 1998, ApJ, 500, 525
- Smartt (2009) Smartt, S. J. 2009, ARA&A, 47, 63
- Smith et al. (2002) Smith J. A., Tucker, D. L., Kent, S., et al. 2002, AJ, 123, 2121
- Soderberg et al. (2011) Soderberg, A. M., Margutti, R., Zauderer, B. A., et al. 2011, arXiv:1107.1876
- Stewart et al. (2009) Stewart, H. A., Guinan, E. F., Wasatonic, R., Engle, S. G., & McCook, G. P. 2009, Bulletin of the American Astronomical Society, 41, #408.13
- Storm et al. (2004) Storm, J., Carney, B. W., Gieren, W. P., et al. 2004, A&A, 415, 531
- Stritzinger et al. (2002) Stritzinger, M., Hamuy, M., Suntzeff, N. B., et al. 2002, AJ, 124, 2100
- Stritzinger et al. (2011) Stritzinger, M., Phillips, M. M., Boldt, L., et al. 2011, AJ, accepted
- Terndrup et al. (1988) Terndrup, D. M., Elias, J. H., Gregory, B., et al. 1988, Proceedings of the Astronomical Society of Australia, 7, 412
- Trondal et al. (2006) Trondal, O., Luckas, P., & Schwartz, M. 2006, CBET, 426, 1
- Turatto et al. (2003) Turatto, M., Benetti, S., & Cappellaro, E. 2003, From Twilight to Highlight: The Physics of Supernovae, ed. W. Hillebrandt & B. Leibundgut (Berlin: Springer), 200
- Turatto et al. (1998) Turatto, M., Mazzali, P. A., Young, T. R., et al. 1998, ApJ, 498, L129
- Utrobin & Chugai (2005) Utrobin, V. P., & Chugai, N. N. 2005, A&A, 441, 271
- Utrobin & Chugai (2011) Utrobin, V. P., & Chugai, N. N. 2011, A&A, 532, A100
- Williams (1987) Williams, R. E., 1987, ApJ, 320, 117
- Woodings et al. (1998) Woodings, S., Williams, A., Martin, R., Blair, D., & Burman, R. 1998, IAU Circ., 6849, 3
- Woosley (1988) Woosley, S. E. 1988, ApJ, 330, 218
- Woosley et al. (1987) Woosley, S. E., Pinto, P. A., Martin, P. G., & Weaver, T. A., 1987, ApJ, 617, 1233
| STAR | (mag) | (mag) | (mag) | (mag) | (mag) | (mag) | (mag) | (mag) | (mag) | ||
|---|---|---|---|---|---|---|---|---|---|---|---|
| SN 2006V | |||||||||||
| 01 | 11:31:37.71 | 02:18:48.30 | 12.444(006) | 12.163(006) | 11.800(006) | ||||||
| 02 | 11:31:21.53 | 02:20:22.56 | 17.469(072) | 15.625(011) | 14.923(011) | 14.669(011) | 16.091(009) | 15.227(010) | |||
| 03 | 11:31:45.09 | 02:17:18.60 | 17.312(018) | 16.154(011) | 15.723(011) | 15.570(011) | 16.494(009) | 15.900(008) | 14.977(006) | 14.715(006) | 14.379(006) |
| 04 | 11:31:20.58 | 02:18:32.81 | 17.503(013) | 16.226(013) | 15.789(011) | 15.643(011) | 16.588(009) | 15.963(008) | |||
| 05 | 11:31:38.33 | 02:21:37.42 | 18.270(026) | 16.697(011) | 16.089(011) | 15.876(013) | 17.130(011) | 16.334(010) | 15.172(009) | 14.863(008) | 14.434(007) |
| 06 | 11:31:32.71 | 02:21:53.30 | 19.600(084) | 17.251(012) | 16.221(018) | 15.854(011) | 17.819(011) | 16.686(010) | 14.980(009) | 14.583(009) | 14.014(009) |
| 07 | 11:31:41.76 | 02:16:13.31 | 19.153(052) | 17.342(009) | 16.564(010) | 16.251(010) | 17.837(009) | 16.900(008) | 15.450(006) | 15.079(008) | 14.584(008) |
| 08 | 11:31:26.83 | 02:19:17.16 | 20.471(180) | 18.008(009) | 16.735(011) | 16.181(009) | 18.673(012) | 17.310(008) | 15.257(079) | 14.963(147) | 14.301(130) |
| 09 | 11:31:45.74 | 02:19:25.57 | 18.437(009) | 17.035(012) | 15.927(010) | 19.252(018) | 17.638(008) | 14.585(007) | 14.108(008) | 13.582(006) | |
| 10 | 11:31:32.39 | 02:15:16.22 | 19.956(126) | 18.008(009) | 17.156(011) | 16.824(009) | 18.532(010) | 17.547(008) | |||
| 11 | 11:31:45.57 | 02:16:45.48 | 18.951(055) | 18.048(012) | 17.753(009) | 17.629(013) | 18.296(014) | 17.869(008) | 17.100(017) | 16.828(019) | 16.554(034) |
| 12 | 11:31:47.18 | 02:21:27.35 | 19.166(029) | 17.843(011) | 17.176(013) | 19.931(040) | 18.446(011) | ||||
| 13 | 11:31:28.90 | 02:17:16.32 | 20.975(281) | 19.186(015) | 17.980(019) | 17.449(009) | 19.813(026) | 18.536(014) | 16.487(010) | 16.086(054) | 15.480(054) |
| 14 | 11:31:36.82 | 02:19:57.30 | 19.102(023) | 17.975(015) | 17.489(009) | 19.726(041) | 18.498(009) | 16.510(016) | 16.078(009) | 15.480(016) | |
| 15 | 11:31:29.08 | 02:14:38.58 | 20.088(108) | 18.906(020) | 18.367(009) | 18.169(010) | 19.284(017) | 18.601(013) | |||
| 16 | 11:31:36.40 | 02:18:16.45 | 19.388(265) | 18.913(013) | 18.429(012) | 18.229(011) | 19.280(031) | 18.611(017) | |||
| 17 | 11:31:26.40 | 02:20:05.83 | 20.004(024) | 18.559(027) | 17.090(017) | 20.856(075) | 19.157(023) | ||||
| 18 | 11:31:43.91 | 02:18:40.94 | 20.305(132) | 19.117(015) | 18.576(009) | 18.365(013) | 19.514(027) | 18.775(021) | 17.652(045) | 17.326(046) | 17.029(061) |
| 19 | 11:31:37.16 | 02:14:50.08 | 19.659(018) | 18.669(027) | 18.334(011) | 20.176(060) | 19.116(038) | ||||
| 20 | 11:31:25.90 | 02:20:41.30 | 20.213(116) | 19.340(014) | 18.950(012) | 18.775(026) | 19.606(032) | 19.074(015) | |||
| 21 | 11:31:28.66 | 02:19:25.59 | 20.534(180) | 19.626(031) | 19.279(020) | 19.190(023) | 19.902(030) | 19.407(019) | |||
| 22 | 11:31:42.41 | 02:22:43.86 | 14.232(009) | 13.925(009) | 13.529(009) | ||||||
| 23 | 11:31:49.73 | 02:14:25.94 | 14.747(073) | 14.604(062) | 14.445(054) | ||||||
| 24 | 11:31:54.45 | 02:22:18.01 | 15.653(016) | 15.177(009) | 14.676(009) | ||||||
| 25 | 11:31:55.23 | 02:17:25.15 | 15.629(007) | 15.200(006) | 14.647(006) | ||||||
| 26 | 11:31:30.39 | 02:14:03.77 | 15.998(009) | 15.494(011) | 14.994(017) | ||||||
| 27 | 11:31:46.96 | 02:22:02.93 | 16.188(013) | 15.690(013) | 15.049(019) | ||||||
| 28 | 11:31:29.32 | 02:18:19.33 | 16.507(043) | 16.020(074) | 15.513(075) | ||||||
| 29 | 11:31:49.54 | 02:23:03.84 | 16.775(019) | 16.229(021) | 15.691(040) | ||||||
| 30 | 11:31:49.62 | 02:16:20.46 | 16.948(014) | 16.426(015) | 15.834(021) | ||||||
| 31 | 11:31:27.00 | 02:19:43.97 | 17.058(015) | 16.625(081) | 15.985(025) | ||||||
| 32 | 11:31:27.36 | 02:22:40.51 | 17.038(031) | 16.585(021) | 15.955(037) | ||||||
| 33 | 11:31:57.32 | 02:21:26.93 | 17.339(033) | 16.959(033) | 16.270(032) | ||||||
| 34 | 11:31:34.96 | 02:18:01.44 | 17.382(014) | 16.964(015) | 16.408(049) | ||||||
| 35 | 11:31:55.07 | 02:15:07.24 | 17.237(024) | 16.770(024) | 16.189(039) | ||||||
| 36 | 11:31:35.43 | 02:18:29.34 | 17.526(027) | 17.067(083) | 16.451(041) | ||||||
| 37 | 11:31:31.01 | 02:23:37.25 | 17.390(030) | 16.993(040) | 16.377(060) | ||||||
| 38 | 11:31:31.89 | 02:14:27.20 | 17.884(042) | 17.501(059) | 16.945(065) | ||||||
| 39 | 11:31:51.38 | 02:18:15.59 | 15.977(010) | 15.492(007) | 14.990(008) | ||||||
| 40 | 11:31:41.17 | 02:17:06.90 | 18.347(054) | 17.917(050) | 17.474(094) | ||||||
| SN 2006au | |||||||||||
| 01 | 17:57:01.27 | 12:12:17.97 | |||||||||
| 02 | 17:57:26.02 | 12:09:44.36 | 12.676(006) | 12.432(006) | 12.153(009) | ||||||
| 03 | 17:57:25.34 | 12:10:46.35 | 15.090(012) | ||||||||
| 04 | 17:57:24.92 | 12:07:12.78 | |||||||||
| 05 | 17:57:23.47 | 12:13:48.50 | |||||||||
| 06 | 17:57:21.28 | 12:11:19.12 | 11.928(006) | 11.703(009) | 11.416(009) | ||||||
| 07 | 17:57:21.20 | 12:13:47.45 | 16.051(016) | 14.925(015) | 14.566(015) | 14.447(015) | 15.203(016) | 14.664(035) | 13.745(011) | 13.557(012) | 13.344(037) |
| 08 | 17:57:20.99 | 12:08:56.40 | 16.373(018) | 15.212(009) | 14.471(014) | 13.325(006) | 13.070(006) | 12.773(009) | |||
| 09 | 17:57:19.13 | 12:12:49.98 | |||||||||
| 10 | 17:57:14.53 | 12:11:56.61 | |||||||||
| 11 | 17:57:10.92 | 12:14:24.91 | |||||||||
| 12 | 17:57:10.72 | 12:12:45.99 | 11.684(006) | 11.384(020) | 10.956(020) | ||||||
| 13 | 17:57:10.58 | 12:12:10.49 | 17.710(026) | 15.397(015) | 14.531(015) | 14.210(015) | 15.962(007) | 14.884(010) | 13.311(007) | 12.961(013) | 12.471(012) |
| 14 | 17:57:07.66 | 12:10:05.07 | 17.735(026) | 15.698(008) | |||||||
| 15 | 17:57:07.08 | 12:12:04.19 | |||||||||
| 16 | 17:57:24.01 | 12:09:27.97 | 18.151(035) | 15.910(009) | 15.040(009) | 14.698(013) | 16.497(007) | 15.399(008) | |||
| 17 | 17:57:07.13 | 12:12:39.82 | 17.220(017) | 15.637(009) | 15.060(009) | 14.838(011) | 16.075(007) | 15.286(006) | |||
| 18 | 17:57:10.34 | 12:10:10.92 | 19.088(082) | 16.416(007) | 15.260(007) | 14.789(009) | 17.034(007) | 15.780(007) | 13.809(007) | 13.421(014) | 12.828(035) |
| 19 | 17:57:04.06 | 12:10:21.84 | 17.593(023) | 16.090(007) | 15.519(007) | 15.292(007) | 16.512(007) | 15.743(006) | |||
| 20 | 17:57:05.77 | 12:07:10.60 | 18.015(061) | 16.248(007) | 15.532(007) | 15.223(007) | 16.723(008) | 15.818(007) | |||
| 21 | 17:57:05.24 | 12:08:46.35 | 18.154(038) | 16.294(007) | 15.544(007) | 15.218(007) | 16.817(007) | 15.848(006) | |||
| 22 | 17:57:08.21 | 12:08:23.53 | 18.508(049) | 16.707(007) | 16.046(007) | 15.798(007) | 17.176(009) | 16.315(006) | |||
| 23 | 17:57:26.13 | 12:12:18.72 | 19.005(077) | 16.967(007) | 16.136(007) | 15.781(008) | 17.508(008) | 16.476(006) | |||
| 24 | 17:57:18.41 | 12:11:17.41 | 19.073(129) | 17.004(007) | 16.213(007) | 15.890(007) | 17.545(008) | 16.541(006) | 15.038(008) | 14.684(013) | 14.193(013) |
| 25 | 17:57:18.10 | 12:07:34.41 | 19.381(114) | 17.338(008) | 16.478(007) | 16.094(008) | 17.881(012) | 16.847(008) | |||
| 26 | 17:57:17.76 | 12:08:23.45 | 18.382(071) | 17.006(007) | 16.482(007) | 16.277(009) | 17.407(008) | 16.693(006) | |||
| 27 | 17:57:04.64 | 12:11:26.91 | 18.523(052) | 17.182(008) | 16.620(007) | 16.377(007) | 17.579(009) | 16.850(007) | |||
| 28 | 17:57:10.82 | 12:08:44.31 | 18.985(078) | 17.505(007) | 16.955(007) | 16.745(011) | 17.922(009) | 17.171(006) | 16.010(006) | 15.737(007) | 15.393(022) |
| 29 | 17:57:24.06 | 12:08:07.25 | 19.253(099) | 17.641(007) | 17.075(007) | 16.850(007) | 18.080(010) | 17.291(007) | |||
| 30 | 17:57:39.05 | 12:08:46.21 | 15.015(007) | 14.646(007) | 14.172(013) | ||||||
| 31 | 17:57:23.88 | 12:11:39.48 | 16.760(014) | 16.507(013) | 16.237(047) | ||||||
| 32 | 17:57:29.01 | 12:11:17.38 | 16.880(014) | 16.589(016) | 16.261(043) | ||||||
| 33 | 17:57:34.21 | 12:12:06.84 | 16.879(013) | 16.579(014) | 16.204(033) | ||||||
| 34 | 17:57:13.41 | 12:07:53.58 | 17.032(025) | 16.706(041) | 16.217(070) | ||||||
| 35 | 17:57:40.05 | 12:13:03.83 | 17.056(015) | 16.747(029) | 16.345(065) | ||||||
| 36 | 17:57:10.67 | 12:09:20.38 | 17.090(016) | 16.722(015) | 16.294(048) | ||||||
| 37 | 17:57:22.71 | 12:09:52.74 | 17.127(025) | 16.656(020) | 16.096(038) | ||||||
| 38 | 17:57:40.25 | 12:09:44.53 | 17.099(028) | 16.746(020) | 16.270(054) | ||||||
| 39 | 17:57:14.91 | 12:13:28.13 | 17.578(045) | 17.153(032) | 16.523(157) | ||||||
| 40 | 17:57:16.09 | 12:12:23.22 | 17.656(039) | 17.261(024) | 16.621(038) | ||||||
| 41 | 17:57:20.72 | 12:07:54.01 | 17.803(050) | 17.314(039) | 16.852(063) | ||||||
| 42 | 17:57:14.90 | 12:11:26.23 | 14.535(007) | 14.045(012) | 13.428(007) | ||||||
| 43 | 17:57:12.58 | 12:11:23.64 | 17.510(024) | 17.171(024) | 16.558(031) | ||||||
| 44 | 17:57:16.80 | 12:11:22.09 | 16.658(013) | 16.329(021) | 15.807(022) | ||||||
| 45 | 17:57:10.85 | 12:11:15.14 | 16.649(027) | 16.364(041) | 15.994(061) | ||||||
| 46 | 17:57:16.99 | 12:11:49.88 | 17.242(019) | 16.910(016) | 16.380(031) | ||||||
| 47 | 17:57:12.86 | 12:09:42.55 | 16.118(014) | 15.815(016) | 15.401(023) | ||||||
| 48 | 17:57:18.86 | 12:12:19.19 | 16.814(010) | 16.563(018) | 16.178(029) | ||||||
| 49 | 17:57:17.80 | 12:10:20.24 | 16.227(010) | 15.801(013) | 15.130(015) | ||||||
| 50 | 17:57:22.52 | 12:10:57.65 | 16.196(009) | 15.736(007) | 15.211(014) | ||||||
Note. — Uncertainties given in parentheses in thousandths of a magnitude correspond to an rms of the magnitudes obtained on photometric nights.
| Date | Julian Date | EpochaaDays since . | Telescope | Instrument | Range | Resolution | Integration |
|---|---|---|---|---|---|---|---|
| (UT) | JD - 2,453,000 | (days) | (Å) | (FWHM Å) | (sec) | ||
| SN 2006V | |||||||
| 2006 Feb. 13 | 779.8 | 43.9 | NTT | EMMI | 4000 – 10200 | 9 | 300 |
| 2006 Mar. 05 | 799.8 | 23.8 | Du Pont | WFCCD | 3800 – 9235 | 8 | 900 |
| 2006 Mar. 08 | 802.8 | 20.9 | Du Pont | WFCCD | 3800 – 9235 | 8 | 900 |
| 2006 Mar. 15 | 809.8 | 13.8 | Clay | LDSS | 3785 – 9969 | 2-4bbThe spectrum was obtained by the combination of two spectra from two different grisms, respectively covering the range between 3785 and 6129 Å and the one between 5673 and 9969 Å. The resolutions were different, being 2 Å on the blue side and 4 Å on the red one. | 600 |
| 2006 Mar. 23 | 817.7 | 6.0 | Du Pont | WFCCD | 3800 – 9235 | 8 | 900 |
| 2006 Mar. 24 | 818.8 | 4.9 | Du Pont | WFCCD | 3800 – 9235 | 8 | 900 |
| 2006 Apr. 02 | 827.7 | 4.0 | Du Pont | WFCCD | 3800 – 9235 | 8 | 900 |
| 2006 Apr. 16 | 841.7 | 18.0 | Baade | IMACS | 3842 – 9692 | 4 | 900 |
| 2006 Apr. 24 | 849.6 | 25.9 | Du Pont | WFCCD | 3800 – 9235 | 8 | 900 |
| SN 2006au | |||||||
| 2006 Mar. 14 | 808.9 | 56.6 | Clay | LDSS | 3785 – 9969 | 2-4bbThe spectrum was obtained by the combination of two spectra from two different grisms, respectively covering the range between 3785 and 6129 Å and the one between 5673 and 9969 Å. The resolutions were different, being 2 Å on the blue side and 4 Å on the red one. | 600 |
| 2006 Mar. 15 | 809.9 | 55.6 | NTT | EMMI | 4000 – 10200 | 8 | 300 |
| 2006 Mar. 22 | 816.9 | 48.6 | Du Pont | WFCCD | 3800 – 9235 | 8 | 600 |
| 2006 Mar. 23 | 817.9 | 47.6 | Du Pont | WFCCD | 3800 – 9235 | 8 | 900 |
| 2006 Mar. 24 | 818.9 | 46.6 | Du Pont | WFCCD | 3800 – 9235 | 8 | 600 |
| 2006 Mar. 30 | 824.9 | 40.6 | Du Pont | WFCCD | 3800 – 9235 | 8 | 900 |
| 2006 Apr. 02 | 827.9 | 37.6 | Du Pont | WFCCD | 3800 – 9235 | 8 | 600 |
| 2006 Apr. 22 | 847.8 | 17.7 | Du Pont | WFCCD | 3800 – 9235 | 8 | 600 |
| 2006 Apr. 25 | 850.9 | 14.6 | Du Pont | WFCCD | 3800 – 9235 | 8 | 600 |
| JD - | PhaseaaDays since , . | (mag) | (mag) | (mag) | (mag) | (mag) | (mag) | Instrument |
|---|---|---|---|---|---|---|---|---|
| 771.17 | 52.53 | … | … | 18.0bbUnfiltered magnitudes from discovery and confirmation images, obtained with the Lulin One-meter Telescope (LOT) in Taiwan (Chen et al. 2006). | … | … | … | LOT CCD |
| 773.15 | 50.55 | … | … | 18.2bbUnfiltered magnitudes from discovery and confirmation images, obtained with the Lulin One-meter Telescope (LOT) in Taiwan (Chen et al. 2006). | … | … | … | LOT CCD |
| 773.71 | 49.99 | 21.933(492) | 18.724(012) | 18.076(009) | 18.021(011) | 19.306(024) | 18.355(012) | Site 3 |
| 774.82 | 48.88 | 21.454(231) | 18.712(011) | 18.042(009) | 17.980(011) | 19.209(020) | 18.305(012) | Site 3 |
| 775.67 | 48.03 | 21.059(191) | 18.684(010) | 18.002(009) | 17.949(011) | 19.171(020) | 18.267(010) | Site 3 |
| 778.81 | 44.89 | 21.082(321) | 18.546(019) | 17.890(016) | 17.825(015) | 19.034(039) | 18.128(019) | Site 3 |
| 784.90 | 38.80 | 19.858(380) | … | … | … | 18.912(050) | 17.956(016) | Site 3 |
| 786.88 | 36.82 | 20.559(218) | 18.302(011) | 17.657(009) | 17.610(010) | 18.772(021) | 17.890(011) | Site 3 |
| 795.84 | 27.86 | … | 18.092(006) | 17.455(007) | 17.414(008) | 18.613(013) | 17.701(007) | Site 3 |
| 799.75 | 23.95 | … | 17.999(006) | 17.374(006) | 17.344(007) | 18.537(011) | 17.616(006) | Site 3 |
| 804.84 | 18.86 | … | 17.916(006) | 17.291(005) | 17.252(006) | 18.435(009) | 17.532(007) | Site 3 |
| 805.79 | 17.91 | … | 17.901(007) | 17.282(007) | 17.239(008) | 18.405(013) | 17.531(008) | Site 3 |
| 818.77 | 4.93 | … | 17.769(009) | 17.135(008) | 17.096(009) | 18.287(013) | 17.388(009) | Site 3 |
| 824.73 | 1.03 | … | 17.749(006) | 17.106(006) | 17.059(007) | 18.291(009) | 17.351(006) | Site 3 |
| 832.75 | 9.05 | … | 17.813(006) | 17.130(007) | 17.071(008) | 18.344(010) | 17.391(007) | Site 3 |
| 838.75 | 15.05 | … | 17.942(016) | 17.205(009) | 17.144(010) | 18.458(041) | 17.499(014) | Site 3 |
| 846.73 | 23.03 | … | 18.258(008) | 17.430(006) | 17.339(008) | 18.888(014) | 17.787(007) | Site 3 |
| 853.64 | 29.94 | … | 18.752(009) | 17.795(008) | 17.664(009) | 19.426(018) | 18.219(009) | Site 3 |
| 862.57 | 38.87 | … | 19.263(016) | 18.186(010) | 18.041(012) | 19.950(030) | 18.676(014) | Site 3 |
| 867.57 | 43.87 | … | 19.337(029) | 18.278(012) | 18.143(017) | 20.174(086) | 18.757(026) | Site 3 |
| 892.56 | 68.86 | … | 19.697(026) | 18.518(018) | 18.443(024) | … | 19.052(048) | Tek 5 |
| 898.56 | 74.86 | … | 19.759(020) | 18.567(015) | 18.500(021) | 20.468(034) | 19.213(018) | Tek 5 |
Note. — Values in parentheses are 1 measurement uncertainties in of mag.
| JD - | PhaseaaDays since , . | (mag) | (mag) | (mag) | Instrument |
|---|---|---|---|---|---|
| 777.78 | 45.92 | 17.306(029) | 17.053(048) | 16.919(063) | Retrocam |
| 779.79 | 43.91 | 17.283(038) | 17.002(039) | 16.819(062) | Retrocam |
| 788.86 | 34.84 | 17.059(012) | 16.862(018) | 16.713(027) | WIRC |
| 797.75 | 25.95 | 16.994(035) | 16.659(035) | 16.502(056) | RetroCam |
| 803.84 | 19.86 | 16.767(027) | … | … | RetroCam |
| 810.79 | 12.91 | 16.648(024) | 16.450(030) | 16.245(047) | RetroCam |
| 817.71 | 5.99 | 16.600(027) | 16.361(026) | 16.087(024) | RetroCam |
| 826.68 | 2.98 | 16.538(019) | 16.275(020) | 16.096(031) | RetroCam |
| 834.74 | 11.04 | 16.569(010) | 16.343(016) | 16.193(030) | WIRC |
| 844.65 | 20.95 | 16.723(012) | 16.514(039) | 16.261(026) | WIRC |
| 852.64 | 28.94 | 16.971(027) | 16.692(035) | 16.450(056) | RetroCam |
| 863.59 | 39.89 | 17.261(050) | 17.148(063) | … | RetroCam |
| 869.64 | 45.94 | 17.428(038) | 17.209(048) | 16.853(061) | RetroCam |
Note. — Values in parentheses are 1 measurement uncertainties in of mag.
| JD - | PhaseaaDays since , . | (mag) | (mag) | (mag) | (mag) | (mag) | (mag) | Instrument |
|---|---|---|---|---|---|---|---|---|
| 801.70 | 63.80 | … | … | 17.2bbUnfiltered magnitudes from discovery and confirmation images, obtained with the 0.35 m Tenagra telescope in Oslo (Trondal et al. 2006). | … | … | … | AP-7 CCD |
| 805.15 | 60.35 | … | … | 17.4bbUnfiltered magnitudes from discovery and confirmation images, obtained with the 0.35 m Tenagra telescope in Oslo (Trondal et al. 2006). | … | … | … | AP-7 CCD |
| 805.89 | 59.61 | 20.609(210) | 18.428(015) | 17.614(027) | 17.106(093) | 19.079(018) | 17.991(013) | Site 3 |
| 809.85 | 55.65 | … | 18.366(027) | 17.589(028) | 17.327(026) | 19.308(065) | 17.963(020) | Site 3 |
| 815.86 | 49.64 | 20.815(198) | 18.468(024) | 17.696(051) | 17.388(039) | 19.206(027) | 18.061(024) | Site 3 |
| 818.90 | 46.60 | 20.446(230) | 18.563(016) | 17.637(023) | 17.335(028) | 19.219(023) | 18.079(019) | Site 3 |
| 819.90 | 45.60 | 20.751(225) | 18.578(022) | 17.575(035) | … | 19.244(020) | 18.056(020) | Site 3 |
| 823.83 | 41.67 | 20.123(287) | 18.549(016) | 17.604(024) | 17.371(026) | 19.144(018) | 18.061(018) | Site 3 |
| 824.87 | 40.63 | 20.448(226) | 18.485(011) | 17.557(016) | 17.369(018) | 19.149(019) | 18.036(013) | Site 3 |
| 828.89 | 36.61 | 20.555(265) | 18.321(036) | … | … | 19.054(010) | 17.953(018) | Tek 5 |
| 829.92 | 35.58 | 19.982(237) | 18.542(038) | … | … | 19.056(025) | … | Tek 5 |
| 830.89 | 34.61 | 20.482(257) | … | 17.463(071) | 17.402(081) | 19.011(013) | 18.045(039) | Tek 5 |
| 831.83 | 33.67 | 20.288(299) | 18.304(018) | 17.451(018) | 17.362(025) | … | 17.982(018) | Site 3 |
| 832.86 | 32.64 | 20.389(297) | 18.408(009) | … | … | 18.992(015) | 17.957(010) | Site 3 |
| 835.87 | 29.63 | 20.285(282) | 18.335(021) | 17.501(037) | 17.239(025) | 18.923(016) | 17.918(018) | Site 3 |
| 838.82 | 26.68 | 20.291(314) | 18.175(021) | 17.376(024) | 17.083(033) | 18.775(040) | 17.775(018) | Site 3 |
| 840.83 | 24.67 | 20.185(224) | 18.121(024) | 17.376(025) | 17.168(024) | 18.796(029) | 17.760(015) | Site 3 |
| 841.85 | 23.65 | 19.820(225) | 18.133(021) | 17.341(029) | 17.112(023) | 18.788(026) | 17.749(019) | Site 3 |
| 845.82 | 19.68 | … | 18.096(012) | 17.266(017) | 17.043(019) | 18.703(021) | 17.666(012) | Site 3 |
| 850.81 | 14.69 | … | 18.087(011) | 17.222(017) | 16.991(020) | 18.720(014) | 17.601(010) | Site 3 |
| 853.85 | 11.65 | … | 18.056(016) | 17.185(025) | 16.974(023) | 18.677(013) | 17.598(016) | Site 3 |
| 858.79 | 6.71 | … | 18.016(007) | 17.105(006) | 16.929(015) | 18.649(020) | 17.506(015) | Site 3 |
| 861.82 | 3.68 | … | 18.006(016) | 17.099(028) | 16.867(023) | 18.654(013) | 17.535(016) | Site 3 |
| 862.80 | 2.70 | … | 18.018(009) | 17.084(008) | … | 18.653(014) | 17.509(009) | Site 3 |
| 866.75 | 1.25 | … | 17.966(024) | 16.996(031) | 16.824(020) | 18.628(021) | 17.464(017) | Site 3 |
| 867.78 | 2.28 | … | 17.978(029) | 16.981(035) | 16.866(035) | 18.678(028) | 17.491(024) | Site 3 |
| 870.80 | 5.30 | … | 18.028(018) | 17.013(018) | 16.764(017) | 18.675(034) | 17.467(012) | Site 3 |
| 871.79 | 6.29 | … | 18.031(017) | 17.022(016) | 16.799(018) | 18.768(029) | 17.486(015) | Site 3 |
| 872.78 | 7.28 | … | 18.085(030) | 16.994(043) | 16.792(032) | 18.776(022) | 17.562(026) | Site 3 |
| 886.78 | 21.28 | … | … | … | 17.049(059) | 19.360(020) | 18.041(041) | Tek 5 |
| 890.72 | 25.22 | … | 18.832(026) | 17.469(024) | 17.258(025) | 19.437(179) | 18.127(063) | Site 3 |
| 891.74 | 26.24 | … | 18.883(017) | 17.551(023) | 17.258(025) | 19.692(026) | 18.211(016) | Site 3 |
| 892.76 | 27.26 | … | 18.987(064) | 17.623(069) | 17.353(054) | 19.729(013) | 18.212(024) | Tek 5 |
| 893.71 | 28.21 | … | 19.097(073) | 17.479(042) | 17.305(044) | 19.839(024) | 18.299(016) | Tek 5 |
| 894.75 | 29.25 | … | … | 17.669(017) | 17.473(019) | 19.854(035) | 18.340(010) | Tek 5 |
| 897.66 | 32.16 | … | … | 18.015(150) | … | 20.477(095) | 18.830(097) | Tek 5 |
| 898.71 | 33.21 | … | … | 18.434(116) | … | 21.185(231) | 19.041(202) | Tek 5 |
Note. — Values in parentheses are 1 measurement uncertainties in of mag.
| JD - | PhaseaaDays since , . | (mag) | (mag) | (mag) | Instrument |
|---|---|---|---|---|---|
| 807.87 | 57.63 | 16.630(020) | 16.398(025) | 16.257(046) | RetroCam |
| 808.85 | 56.65 | 16.704(024) | 16.375(027) | 16.224(042) | RetroCam |
| 810.87 | 54.63 | 16.711(022) | 16.377(020) | … | RetroCam |
| 813.87 | 51.63 | 16.645(021) | 16.380(019) | … | RetroCam |
| 820.87 | 44.63 | 16.632(022) | 16.371(018) | 16.201(044) | RetroCam |
| 826.83 | 38.67 | 16.623(020) | 16.366(022) | 16.160(051) | RetroCam |
| 834.87 | 30.63 | 16.554(009) | 16.248(009) | 16.050(014) | WIRC |
| 839.83 | 25.67 | 16.456(019) | 16.188(020) | 16.050(040) | RetroCam |
| 845.83 | 19.67 | 16.353(008) | 16.093(009) | 15.838(013) | WIRC |
| 848.83 | 16.67 | 16.314(016) | 16.052(016) | 15.838(032) | RetroCam |
| 868.80 | 3.30 | 16.073(015) | 15.794(011) | 15.615(027) | RetroCam |
Note. — Values in parentheses are 1 measurement uncertainties in of mag.
| Filter | JD - | PhaseaaDays since explosion, for SN 2006V and for SN 2006au. | Peak (mag) | JD - | PhaseaaDays since explosion, for SN 2006V and for SN 2006au. | Peak (mag) |
|---|---|---|---|---|---|---|
| SN 2006V | SN 2006au | |||||
| 824.5 | 76.5 | 16.67 | 866.9 | 72.9 | 16.55 | |
| 825.0 | 77.0 | 17.28 | 867.5 | 73.5 | 17.20 | |
| 825.3 | 77.3 | 17.31 | 868.5 | 74.5 | 17.15 | |
| 823.7 | 75.7 | 16.14 | 865.5 | 71.5 | 16.02 | |
| 824.8 | 76.8 | 17.05 | 867.0 | 73.0 | 16.87 | |
| 825.5 | 77.5 | 17.81 | 868.5 | 74.5 | 17.63 | |
| 825.8 | 77.8 | 18.06 | 868.5 | 74.5 | 17.81 | |
| 823.7 | 75.7 | 18.26 | 868.5 | 74.5 | 17.90 |
Note. — The largest uncertainty affecting the absolute magnitudes is related to the distance estimate, whose error is about .
| Parameter | SN~2006V | SN~2006au | SN~1987A | SN~1998A | SN~2000cb | SN~2009E |
|---|---|---|---|---|---|---|
| Explosion energy ( erg) | 2.4 | 3.2 | 1.1 | 5.6 | 4.4 | 0.6 |
| Ejecta mass () | 17.0 | 19.3 | 11.8 | 22.0 | 22.3 | 19.0 |
| Radius () | 75 | 90 | 33 | 86 | 35 | 101 |
| mass () | 0.127 | 0.073 | 0.078 | 0.11 | 0.083 | 0.039 |