Influence of phase-diversity image reconstruction techniques
on circular polarization asymmetries
Abstract
Context. Full Stokes filter-polarimeters are key instruments for investigating the rapid evolution of magnetic structures on the solar surface. To this end, the image quality is routinely improved using a-posteriori image reconstruction methods.
Aims. We analyze the robustness of circular polarization asymmetries to phase-diversity image reconstruction techniques.
Methods. We use snapshots of magneto-hydrodynamical simulations carried out with different initial conditions to synthesize spectra of the magnetically sensitive Fe i line at 5250.2 Å. We degrade the synthetic profiles spatially and spectrally to simulate observations with the IMaX full Stokes filter-polarimeter. We also simulate the focused/defocused pairs of images used by the phase-diversity algorithm for reconstruction and the polarimetric modulation scheme. We assume that standard optimization methods are able to infer the projection of the wavefront on the Zernike polynomials with 10% precision. We also consider the less favorable case of 25% precision. We obtain reconstructed monochromatic modulated images that are later demodulated and compared with the original maps.
Results. Although asymmetries are often difficult to define in the quiet Sun due to the complexity of the Stokes profiles, we show how asymmetries are degraded with spatial and spectral smearing. The results indicate that, although image reconstruction techniques reduce the spatial smearing, they can modify the asymmetries of the profiles, mainly caused by the appearance of spatially-correlated noise.
Key Words.:
Sun: photosphere, surface magnetism — Instrumentation: high angular resolution — Techniques: polarimetric1 Introduction
The observation of Stokes profiles in spectral lines are a valuable tool to infer information about the thermodynamical and magnetic properties of the solar plasma. This information is encoded in the amplitude and the shape of the Stokes profiles. Therefore, it is important to avoid any effect that perturbs the shape because it can crucially modify the information encoded in the profile.
Of special relevance is the asymmetry of the circular polarization profile, which is known to be related to the correlation between velocity and magnetic field gradients along the line-of-sight (LOS; Illing et al. 1975). This effect has been exploited to build atmospheric models with such gradients to explain asymmetries around magnetic flux concentrations (Solanki & Pahlke 1988; Grossmann-Doerth et al. 1988; Sánchez Almeida et al. 1989; Solanki & Montavon 1993). The situation is especially relevant in the weakly-magnetized zones of the quiet Sun away from active regions, where Stokes profiles present a variety of shapes with strongly asymmetric profiles (Sigwarth et al. 1999; Sánchez Almeida & Lites 2000; Khomenko et al. 2003; Socas-Navarro et al. 2004; Martínez González et al. 2008; Viticchié et al. 2011; Viticchié & Sánchez Almeida 2011).
Earth-based observations are always affected by the disturbing effect of the atmosphere. As a consequence, the diffraction limit of the telescope is practically never reached. It is often impossible to overcome the 1” limit if the observations are not accompanied by an adaptive optics system and powerful post-processing methods. For this reason, Khomenko et al. (2005b) and Shelyag et al. (2007) analyzed the effect of spatial smearing on the Stokes asymmetries observed in the pair of Fe i lines at 630 nm and at 1565 nm. They concluded that asymmetries are heavily disturbed by the lack of spatial resolution. They even discovered that it is possible to find regions in which the field polarity is different in the two spectral regions (Sánchez Almeida et al. 2003; Rezaei et al. 2007), something fully attributed to the lack of spatial resolution. The fundamental reason is that the shape of Stokes profiles in weakly-magnetized regions are very complex and they change in scales much smaller than the resolution element of the largest Earth-based telescopes even in the hypothetical absence of atmosphere.
Even if the telescope is put in a balloon at 40 km height like Sunrise (Solanki et al. 2010), there is some remaining atmosphere (albeit small) which, together with the intrinsic aberrations of the telescope and instruments, can modify the observations. For this reason, the IMaX instrument onboard Sunrise was designed to use the phase-diversity post-facto reconstruction algorithm (Paxman et al. 1992; Vargas Domínguez 2009). In this paper, we focus on the interesting problem of testing how the spatial and spectral degradation produced by the Sunrise/IMaX combination affects circular polarization asymmetries and if the post-reconstruction algorithms can help us extract reliable information (comparable to the unperturbed synthetic case) about them from degraded data. To this end, we use profiles synthesized on 3D models of the solar photosphere. We degrade them to simulate the observational conditions of Sunrise/IMaX and reconstruct the images using the phase-diversity algorithm.
2 Data processing
2.1 Simulations and spectral synthesis
The snapshots that we have used correspond to individual time steps of a 3D magneto-hydrodynamical simulation of solar magneto-convection done with the MURAM code (Vögler 2003; Vögler et al. 2005; Cameron et al. 2011). An initially vertical magnetic field of 200 G strength was introduced into already developed purely hydrodynamical convection. The simulation box was split into 4 parts with the opposite polarities of the magnetic field in the adjacent parts. This magnetic field evolved self-consistently with convective motions. The redistribution of the magnetic field led to almost exponential decrease with time of its average unsigned value over the simulation domain. The snapshots used in the present work were taken 17, 36 and 112 minutes after the magnetic field was introduced. At these time moments, the average unsigned magnetic field strength at photospheric base was of 140 G, 80 G and 30 G. The last snapshot is representative of quiet Sun internetwork because it is close to the value obtained by Khomenko et al. (2005a), while the first two are representative of bipolar enhanced network. The computational box has grid points, with the largest number of points in the horizontal directions. The grid step in the horizontal direction is roughly 20 km, with a total horizontal extent of Mm2. The grid size in the vertical direction is 14 km, with an ensuing total height of 1400 km. On average, the spatial extent above and below optical depth unity at 5000 Å amounts to 600 km and 800 km, respectively.
We have computed the Stokes spectra of the Fe i 5250.2089 Å line formed at solar disc centre (). The calculation was done using the SIR code (Ruiz Cobo & del Toro Iniesta 1992) in LTE approximation. The spectra were computed in a 2.5D approach, i.e. individually for each vertical column of the snapshots, corresponding to the LOS direction. We used the following atomic parameters: lower level energy eV, and iron abundance =7.50. The detailed description of this particular simulation run and analysis of Stokes spectra of this and other Fe i lines can be found in Khomenko et al. (2005b) and Khomenko & Collados (2007).
Since we simulate the effect of image degradation on the polarimetric measurements, we first have to modulate the resulting monochromatic synthetic images of the Stokes parameters. These modulated images will be distorted by the presence of aberrations and measured on the CCD. For simplicity, we apply the ideal modulation scheme:
| (1) |
and neglect any cross-talk between Stokes parameters. Differences between the real modulation matrix for IMaX and the ideal one presented above will fundamentally affect the efficiency of the modulation scheme. Consequently, the only difference lies on the final noise level. The resulting modulated images are spatially degraded, noise is added and the reconstructed image is obtained through standard phase-diversity formulae. The ensuing Stokes parameters are obtained by applying the demodulation matrix .
2.2 Degradation and phase-diversity reconstruction
The synthetic profiles at full resolution are degraded to the IMaX spatial and spectral resolution. IMaX is a filter-polarimetric instrument based on Fabry-Perot interferometers, so that the spectral point spread function (PSF) of the double passage is known analytically. This PSF has very extended tails that would make it necessary to synthesize a large portion of the spectrum to correctly take into account the smearing. Instead, we follow the approach of Lagg et al. (2010) who substituted the real PSF by a Gaussian PSF. It has been verified empirically that a Gaussian of 85 mÅ ( km s-1) of full width at half-maximum (FWHM) gives a good representation of the effect of the real PSF, taking into account the contribution of secondary lobes. The smeared profiles are then sampled at 12 wavelength points to simulate the L12-2 observing mode of IMaX (Martínez Pillet et al. 2011), from mÅ to mÅ in steps of 35 mÅ.
Concerning the spatial smearing, we have simulated all image degradation effects that have been considered for Sunrise/IMaX (see Vargas Domínguez 2009, for a detailed analysis). Adding all aberrations, a value of for the rms wavefront error (WFE) has been measured as the actual performance of the instrument (Martínez Pillet et al. 2011). We consider the same aberration but divided in several contributions. The considered telescopic aberrations (up to the 45th Zernike polynomial) produce a wavefront with an rms WFE of . These aberrations are slowly varying in time so we consider them fixed during the full polarimetric modulation and spectral scanning. The value of the coefficients associated to each Zernike polynomial that conform the wavefront telescopic aberration are described by uncorrelated Gaussian distributions. The atmosphere is accounted for by considering a wavefront with turbulent Kolmogorov statistics (Noll 1976; Löfdahl & Scharmer 1994), again with an rms WFE of . While this atmospheric contribution might be considered large for the case of IMaX/SUNRISE, including it here allows our results to be valid for ground-based observations with adaptive optics systems. This atmospheric contribution might be even considered large for the case of IMaX/SUNRISE. Assuming the presence of an image stabilization system, we neglect the presence of tip and tilt. We also consider a ripple WFE of associated to the polishing that we simulate as a screen with a von Karman spectrum with an external scale of 30 cm that simulates the diameter of the polishing tool. Considering the previous contributions, the total rms of the WFE obtained as the addition in quadrature is of the order of . Furthermore, we also take into account the effect of the finite size of the CCD pixels, which do not sample the image with Dirac delta functions but with a small amount of diffraction. Finally, the resulting PSF is then convolved with the monochromatic modulated images and noise at the level of 10-3 in units of the continuum intensity is added. After demodulation, we obtain the degraded monochromatic images of the Stokes parameters. Additionally, since we apply image reconstruction techniques based on the phase-diversity technique, we also simulate images with exactly the same wavefront but including an additional optimal defocus, in which the peak-to-valley defocus wavefront equals the observation wavelength (Lee et al. 1999). For the case of IMaX, this optimal defocus amounts to .
Our aim is to compare the asymmetries of Stokes in the degraded profiles with those found in the original one and in the phase-diversity reconstructed data. Since we know exactly the PSFs of the focused and defocused images, we could apply a standard phase-diversity reconstruction algorithms (Gonsalves & Chidlaw 1979; Paxman et al. 1992; Löfdahl & Scharmer 1994) and obtain a perfect reconstruction using:
| (2) |
where , , and are the Fourier transforms of the focused PSF, defocused PSF, focused image and defocused image, respectively, and is the Fourier transform of the reconstructed image. In real situations, the PSFs are not known and the reconstruction algorithm is preceded by an iterative process in which the PSFs are estimated by maximizing a merit function. In order to overcome this iterative process but still consider uncertainties in the estimation of the PSFs, we make the assumption that the projection of the final wavefront on every Zernike polynomial is known with 10% relative error. This figure is representative of extensive simulations carried out with IMaX data (e.g., Vargas Domínguez 2009). This error is representing the uncertainties that one would have when using optimization methods for the estimation of the wavefront. From the reconstructed focused and defocused PSFs, we obtain the reconstructed image following Gonsalves & Chidlaw (1979); Paxman et al. (1992); Löfdahl & Scharmer (1994). Because of the presence of noise and the diffraction limit of the telescope, it is fundamental to filter out high frequencies from the resulting image (Löfdahl & Scharmer 1994). These high frequencies cannot be recovered. Additionally, the noise on the reconstructed images present a Gaussian distribution with a variance larger than that of the original focused and defocused images. The main problem is that this noise is spatially correlated (Meynadier et al. 1999). This leads to an aesthetically unappealing web-like noise which avoids using many profiles in the quiet-Sun because their amplitudes are already very low. Furthermore, this noise introduces artifacts that perturb the appearance of the Stokes profiles. This effect is also discussed by Puschmann & Beck (2011) with different deconvolution methods.
| Snapshot | Case | Above | 1 lobe | 2 lobes | 3 lobes | 4 lobes | Amplitude | Area |
|---|---|---|---|---|---|---|---|---|
| thresholda | assymetryb | asymmetryc | ||||||
| 30 G | Full (IMaX) | 36% | 14.61% | 80.36% | 4.32% | 0.05% | ||
| - | Degraded (IMaX) | 11% | 0.75% | 99.25% | 0.01% | 0.01% | ||
| - | Reconstructed (IMaX) | 5% | 17.44% | 82.48% | 0.10% | 0.03% | ||
| - | Full (all ) | 54% | 25.12% | 64.78% | 9.88% | 0.07% | ||
| 80 G | Full (IMaX) | 68% | 14.00% | 80.90% | 4.90% | 0.04% | ||
| - | Degraded (IMaX) | 34% | 1.27% | 98.71% | 0.02% | 0.01% | ||
| - | Reconstructed (IMaX) | 21% | 14.60% | 84.74% | 0.65% | 0.01% | ||
| - | Full (all ) | 85% | 16.26% | 69.55% | 14.07% | 0.06% | ||
| 140 G | Full (IMaX) | 85% | 12.61% | 84.30% | 3.05% | 0.01% | ||
| - | Degraded (IMaX) | 71% | 2.42% | 97.32% | 0.26% | 0.00% | ||
| - | Reconstructed (IMaX) | 34% | 13.19 | 85.49% | 1.31% | 0.00% | ||
| - | Full (all ) | 95% | 7.04% | 80.55% | 12.34% | 0.05% |
-
a
Percentage of profiles with Stokes signal above the noise threshold.
-
b
Mean and standard deviation of amplitude asymmetry.
-
c
Mean and standard deviation of area asymmetry.
3 Circular polarization asymmetries
Circular polarization asymmetries are usually defined in terms of the relative area () and amplitude () imbalances between the blue and the red lobes of Stokes profiles (e.g., Solanki & Stenflo 1986):
| (3) | |||||
| (4) |
where and refer to the amplitude of the red and blue lobes, respectively. The factor gives the sign of the area asymmetry, and it is chosen equal to the sign of the bluest peak of Stokes , following (Martínez Pillet et al. 1997).

These definitions of asymmetries can only be strictly applied to standard two-lobed antisymmetric profiles (one-lobed profiles can also be considered as a degenerate two-lobed profile). However, simulated Stokes profiles often show a panoply of profiles whose spectral shapes are completely different to the standard antisymmetric profile. Table 1 displays the percentage of Stokes profiles with different number of lobes on the three snapshots considered. Although the majority of profiles are standard two-lobed profiles, there are many locations where 1-lobed or 3-lobed profiles are found. This situation is more critical for the case in which the full spatial and spectral resolution is considered. To overcome this problem, we have restricted our analysis to one-lobed and two-lobed profiles, leaving for the future the more complex analysis of profiles with more lobes. In such a case, we think that it will be necessary to update the definition of asymmetries. Interestingly, recent high spatial resolution observations (Martínez González et al. 2011, in preparation) also show the appearance of an increasingly larger fraction of non-standard profiles.
In order to analyze asymmetries, we consider four different cases that will help us understand how Stokes profiles are distorted by the presence of spatial and spectral smearing. The first case, which we label as “Full (all )” consists of the line profiles at full spatial and spectral resolution. The next, labeled as “Full (IMaX)”, are the profiles at full spatial resolution but degraded to the IMaX L12-2 observing mode spectral resolution. We also consider two observationally realistic cases. The first one is the fully degraded, labeled as “Degraded (IMaX)”. The standard deviation of the noise added a-posteriori in units of the continuum intensity in these snapshots is . The last one is the phase-diversity reconstructed case, labeled “Reconstructed (IMaX)”. The standard deviation of the noise increases to in units of the continuum intensity after the reconstruction.
3.1 Spatial variation
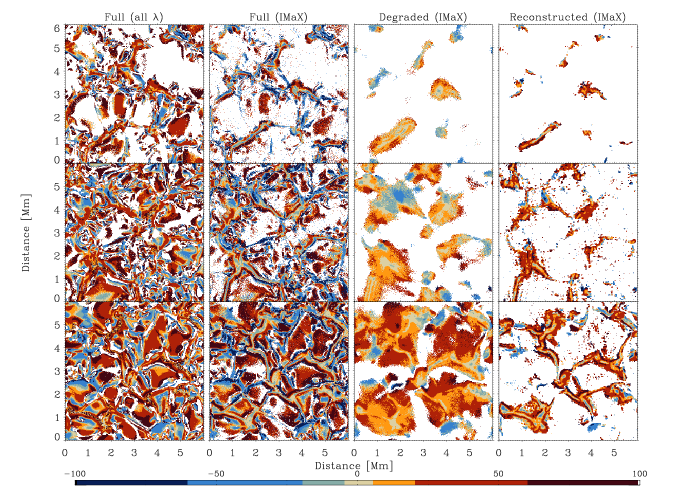
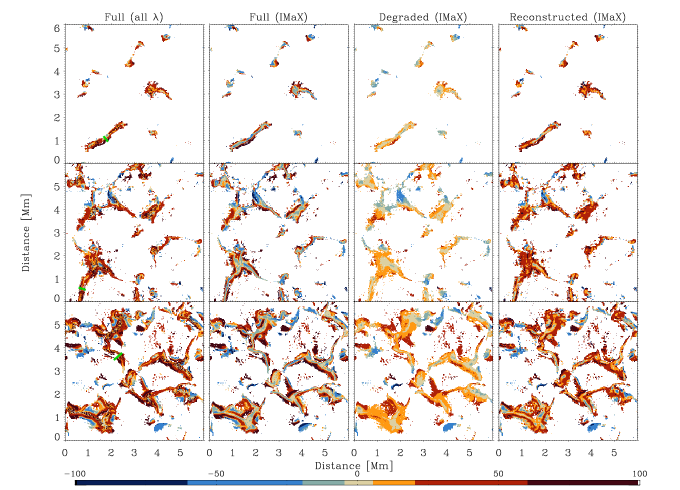
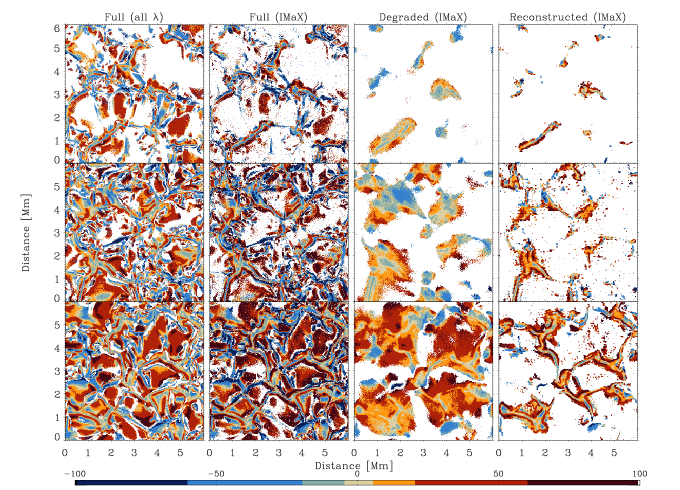
Figures 2 and 3 show the amplitude and area asymmetries for all considered cases, respectively. The upper panels show all map locations where the Stokes profiles are above the threshold for each individual case. For the sake of a better visualization, the bottom panels display only map locations whose Stokes profiles are above 3 times the value of the standard deviation of the noise in all cases simultaneously. In this case, the “Reconstructed (IMaX)” case is the one controlling such map locations because of the enhanced noise level.
From left to right we show what happens when the spatial/spectral resolution is degraded, while the last panel displays the phase-diversity reconstructed case. The three cases considered (each row) correspond to the three snapshots with different seed magnetic fields, where only profiles above the threshold of 3 times the noise level have been considered. Obviously, the number of selected profiles increases as the seed field increases because of the enhanced Stokes amplitudes.
Concerning the high-resolution maps, we find predominantly positive area asymmetries in granules, similar to the previous analysis of Khomenko et al. (2005b) and Shelyag et al. (2007) for the Fe i lines at 630 nm and 1.56 m. This result is compatible with the predominance of positive area asymmetries in granules found in observations (e.g., Socas-Navarro et al. 2004). This predominance is also found for amplitude asymmetries. Negative asymmetries are found in intergranular lanes and in strong kG acummulations. This result found in the high-resolution maps is essentially incompatible with the observational results of Socas-Navarro et al. (2004), who find positive area and amplitude asymmetries in lanes and the network. We show below that both results can be reconciled after image degradation.
Asymmetries in the high-resolution maps can be understood under the flux tube model with a canopy developing with height (Bellot Rubio et al. 2000). The inner parts of the flux tubes coincide with intergranular lanes in the simulations and present strongly negative area asymmetries with not so strongly negative amplitude asymmetries. They are generated by strong downflows associated with a field strength that decreases with height (Shelyag et al. 2007). The granule-intergranule transition with positive area and amplitude asymmetries can be explained by rays crossing the canopy of the flux tube.
Apparently, the spectral degradation of the data at full spatial resolution has a relatively small impact on the spatial distribution of asymmetries, as seen from a comparison of the first and second columns. The filamentary structure of the asymmetries associated with intergranular lanes is maintained, while the profiles observed in granular regions are lost because the spectral degradation pushes them below the noise threshold. However, we can see that the spectrally degraded data presents larger (in absolute value) area and amplitude asymmetries than the original dataset, being this difference especially relevant on the cores of intergranular lanes. This can be easily understood because spectral degradation tends to increase relative area and amplitude asymmetries Solanki & Stenflo (1986), although the dependency on the specific shape of the Stokes profile is crucial.
Spatial degradation changes completely the scenario. The main reason is that spatial smearing produces two effects: i) profiles with very different asymmetries are mixed, and ii) a decrease on the Stokes amplitude, thus pushing the signal in many pixels below the noise threshold. Still, the pixels associated with the strongest signals remain (11%, 38% and 70% of the pixels for the 30 G, 80 G and 140 G snapshots, respectively) and the filamentary structure is somehow lost and transformed into a blobby structure. Typically, asymmetries tend to be organized inside these blobs so that zero or very small asymmetries are found in the cores while they increase in absolute value towards the borders, where profiles are lost below the noise threshold. This behavior is not exactly the same of what happens at larger spatial resolutions, where the cores of intergranular lanes present negative asymmetries while they become positive on the granule-intergranule transition region. From a general perspective, we can say that spatial smearing makes the negative asymmetry of narrow intergranular lanes appear with smaller absolute values while broadening the region of positive asymmetry.
The area and amplitude asymmetries found in the spatially degraded snapshots tend to be more compatible with observations. On average, asymmetries tend to be positive, with a larger absolute value for amplitude asymmetries than for area asymmetries. Stokes profiles in integranular lanes have now negative area asymmetries not larger than 15-20% or even compatible with zero. The only exceptions are isolated patches with strong negative asymmetries.
It is evident from Figs. 2 and 3 that area asymmetries are slightly less affected by the spatial and spectral smearing than amplitude asymmetries. It is specially relevant in the central parts of internetwork lanes, where strong negative amplitude asymmetries show up when reducing the spectral resolution and these are transformed into almost amplitude symmetric profiles when degrading the spatial resolution. On the contrary, relevant negative area asymmetries are still present on internetwork lanes in the spatially and spectrally smeared data.
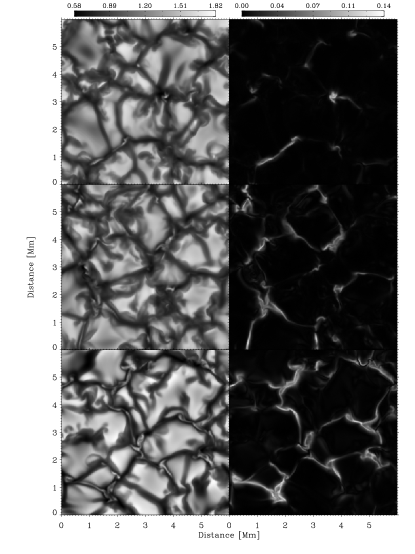
The main point of this work is to verify to what extend asymmetries are recovered after image reconstruction techniques. The rightmost panels of Figs. 2 and 3 demonstrate that an improvement on the spatial location of asymmetries occurs. Obviously, the enhanced noise level and its spatially correlated character produces that the number of pixels with detected signals decreases (6%, 22% and 43% of the pixels for the 30 G, 80 G and 140 G snapshots, respectively). Comparing with Fig. 1, only pixels associated to strong magnetic concentrations can be correctly analyzed. Consequently, one should be careful when analyzing reconstructed data to take into account this bias. Several conclusions can be extracted from the reconstructed images. First, the structures are much more compact than in the degraded case, a consequence of the efficient reduction of aberrations performed by the phase-diversity algorithm, even with 10% relative errors on the projections of the wavefront on the Zernike polynomials. Second, the large gradient of asymmetries from the core of intergranular lanes to the surroundings is partially restored. However, the large negative value of and found in the very central cores are not fully recovered. Generally, in these regions, image reconstruction cannot generate strong negative asymmetries if they were not present in the degraded images. Likewise, if they were present in the degraded maps, they will be enhanced in the image reconstruction process.
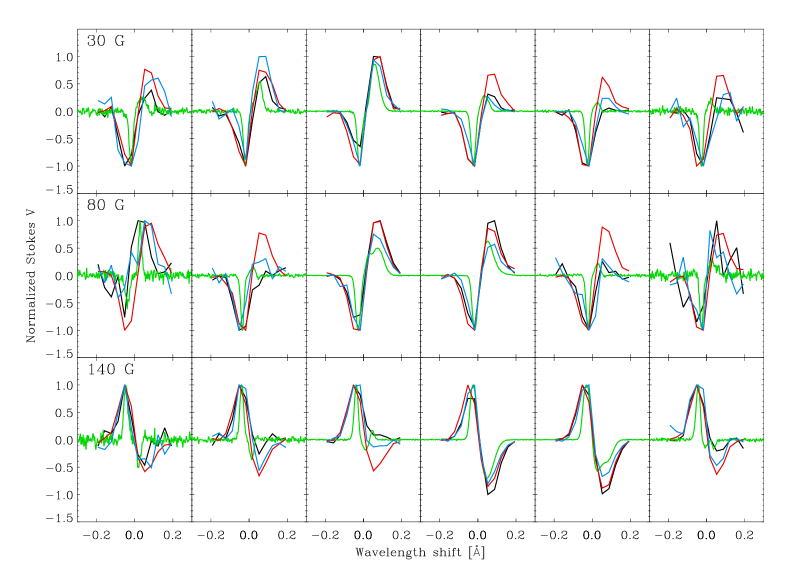
3.2 Line profiles
Synthetic Stokes profiles for the three snapshots considered are shown in Fig. 4 for the cuts indicated in Figs. 2 and 3 in green. The Stokes profiles are normalized to peak amplitude so one has to take into account that spatially and/or spectrally averaged signals possess a smaller amplitude. The profiles of the full spectral and spatial resolution are shown in green. The profiles of the full spatial resolution but spectral resolution degraded to IMaX are shown in black. The fully degraded profiles are shown in red and the phase-diversity recovered ones are plotted in blue.
The first impression is that the full spatial and spectral resolution profiles are very narrow and the presence of several components (several lobes on the red lobe) along the LOS can be easily witnessed. When the spectral resolution is degraded to 85 mÅ, the profiles are broadened, with strong modifications of the relative amplitudes of the two lobes. As a byproduct, the full spatially/spectrally degraded profiles tend to be much more symmetric and only in those cases in which the full resolution profile is extremely asymmetric, some asymmetry remains on the degraded profiles.
It is interesting to note that the phase-diversity reconstructed profiles tend towards the full spatial resolution case with IMaX spectral resolution, as expected. This means that an image reconstruction algorithm is able to partially extract the information necessary to recover the Stokes profiles. This is especially relevant for the very asymmetric profiles.
3.3 Statistical properties
We have tested that image reconstruction based on phase-diversity does a good job at cancelling the spatial smearing of polarimetric signals. Furthermore, although many points are lost below the enhanced noise level, the spatial appearance of asymmetries is not strongly modified. However, it is important to verify other properties. We focus now on the statistical properties of asymmetries.
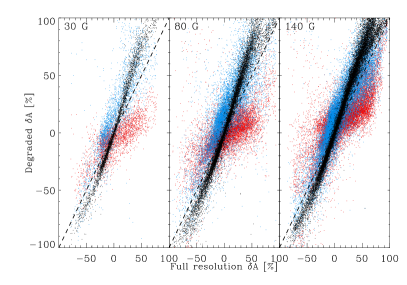
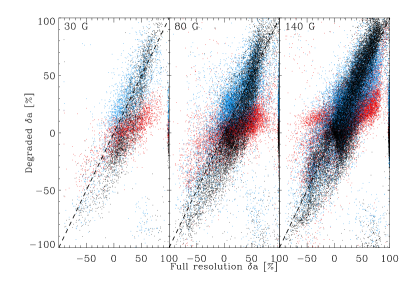
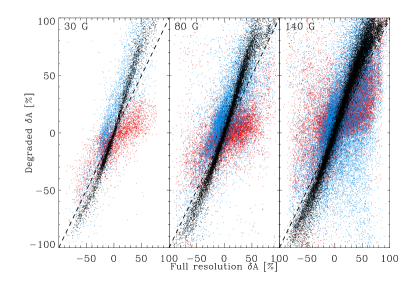
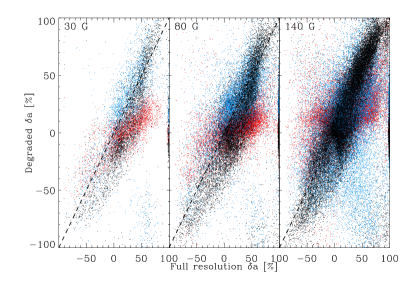
Fig. 5 displays the area (left panels) and amplitude (right panels) asymmetries computed on the degraded snapshots versus those obtained on the full resolution snapshots. The upper panels correspond to the case in which the wavefront is known with 10% uncertainty, whereas the lower panels are associated to the case in which the uncertainty increases to 25%. Red points correspond to the “Degraded (IMaX)” case. Black points correspond to the “Full (IMaX)” case, while the blue points are associated to the “Reconstructed (IMaX)” case. Since the number of points with profiles above the noise level is different for each case, we consider only those points which produce signal above the threshold in the four cases simultaneously. Essentially, this leaves only those points on the phase-diversity reconstructed images, as shown in the lower panels of Figs. 2 and 3.
The spectral degradation produced by IMaX induces that area asymmetries (in absolute value) are systematically overestimated Solanki & Stenflo (1986) because the black points are above (for positive asymmetries) and below (for negative asymmetries) the main diagonal. Concerning the amplitude asymmetry at IMaX spectral resolution, the lack of spectral resolution induces a spread around the correct value. When the spatial resolution is degraded to IMaX resolution, we find that both area and amplitude asymmetries are always underestimated with respect to the original one. However, while positive asymmetries are underestimated, negative asymmetries are severely lost. The reason is that these points with negative asymmetries are associated to profiles with low Stokes amplitude and are quickly lost below the noise level (see Khomenko et al. 2005b; Shelyag et al. 2007, for examples on simulations).
The phase-diversity reconstruction leads to a correction of the area and amplitude asymmetries such that the overlap with the black points is enhanced. This overlapping is evident for the case in which the wavefront is known with 10% accuracy but less evident when the uncertainty raises to 25%. As a byproduct, some portion of the large negative asymmetries appearing on the central parts of intergranular lanes (specifically, those surrounded by large positive asymmetries) are recovered. On the contrary, isolated strong negative asymmetries (like that found at position (2.5,3) on the upper panel of Figs. 2 and 3) are lost below the noise level. Consequently, we conclude that the image reconstruction algorithm is able to partially recover the main properties of area and amplitude asymmetries.
Interestingly, area asymmetries can be corrected to be close to the original ones if they are divided by a factor between and . This figure is slightly dependent on the mean magnetic field of the simulation. A correction factor of is a good compromise, although the spatial smearing is still present and strong asymmetries are fully lost.
4 Conclusions
We have analyzed the impact of phase-diversity image reconstruction algorithms on the Stokes asymmetries. To this end, we have employed three snapshots of 3D MHD models of solar magneto-convection with different mean magnetic fields, as representative of regions with different magnetization on the solar surface. We have synthesized the Fe i line at 5250.2089 Å introduced spatial and spectral smearing to simulate observations with IMaX, and applied a phase-diversity reconstruction assuming imperfect knowledge of the wavefront. We conclude that asymmetries are modified by the smearing process and that this effect can be alleviated using the reconstruction algorithm. Area and amplitude asymmetries tend to be overestimated after the spectral smearing. This is compensated by the spatial smearing, which tends to underestimate all asymmetries. Large negative asymmetries are lost below the noise level because they are usually associated to low-amplitude Stokes profiles. Reconstruction successfully reduces the underestimation of asymmetries and partially recovers the main characteristics. However, patches of isolated large negative asymmetries cannot be recovered. We point out that a large fraction of the pixels cannot be analyzed in the reconstructed data because of the enhanced noise. This noise has spatial correlation, which introduces additional problems. The individual line profiles tend to look more similar to those of the full spatial resolution case with degraded spectral resolution.
Acknowledgements.
We are grateful to C. Beck for helpful comments. We also thank M. Schüssler and A. Vögler for providing the 3D snapshots used in this work. Financial support by the Spanish Ministry of Science and Innovation through projects AYA2010-18029 (Solar Magnetism and Astrophysical Spectropolarimetry) and Consolider-Ingenio 2010 CSD2009-00038 is gratefully acknowledged.References
- Bellot Rubio et al. (2000) Bellot Rubio, L. R., Ruiz Cobo, B., & Collados, M. 2000, ApJ, 535, 489
- Cameron et al. (2011) Cameron, R., Vögler, A., & Schüssler, M. 2011, A&A
- Gonsalves & Chidlaw (1979) Gonsalves, R. A. & Chidlaw, R. 1979, in Presented at the Society of Photo-Optical Instrumentation Engineers (SPIE) Conference, Vol. 207, Society of Photo-Optical Instrumentation Engineers (SPIE) Conference Series, ed. A. G. Tescher, 32–39
- Grossmann-Doerth et al. (1988) Grossmann-Doerth, U., Schuessler, M., & Solanki, S. K. 1988, A&A, 206, L37
- Illing et al. (1975) Illing, R. M. E., Landman, D. A., & Mickey, D. L. 1975, A&A, 41, 183
- Khomenko & Collados (2007) Khomenko, E. & Collados, M. 2007, ApJ, 659, 1726
- Khomenko et al. (2003) Khomenko, E. V., Collados, M., Solanki, S. K., Lagg, A., & Trujillo Bueno, J. 2003, A&A, 408, 1115
- Khomenko et al. (2005a) Khomenko, E. V., Martínez González, M. J., Collados, M., et al. 2005a, A&A, 436, L27
- Khomenko et al. (2005b) Khomenko, E. V., Shelyag, S., Solanki, S. K., & Vögler, A. 2005b, A&A, 442, 1059
- Lagg et al. (2010) Lagg, A., Solanki, S. K., Riethmüller, T. L., et al. 2010, ApJl, 723, L164
- Lee et al. (1999) Lee, D. J., Roggemann, M. C., & Welsh, B. M. 1999, Journal of the Optical Society of America A, 16, 1005
- Löfdahl & Scharmer (1994) Löfdahl, M. G. & Scharmer, G. B. 1994, A&As, 107, 243
- Martínez González et al. (2008) Martínez González, M. J., Collados, M., Ruiz Cobo, B., & Beck, C. 2008, A&A, 477, 953
- Martínez Pillet et al. (2011) Martínez Pillet, V., Del Toro Iniesta, J. C., Álvarez-Herrero, A., et al. 2011, Sol. Phys., 268, 57
- Martínez Pillet et al. (1997) Martínez Pillet, V., Lites, B. W., & Skumanich, A. 1997, ApJ, 474, 810
- Meynadier et al. (1999) Meynadier, L., Michau, V., Velluet, M.-T., et al. 1999, Appl. Opt., 38, 4967
- Noll (1976) Noll, R. J. 1976, Journal of the Optical Society of America, 66, 207
- Paxman et al. (1992) Paxman, R. G., Schulz, T. J., & Fienup, J. R. 1992, Journal of the Optical Society of America A, 9, 1072
- Puschmann & Beck (2011) Puschmann, K. G. & Beck, C. 2011, A&A, in press
- Rezaei et al. (2007) Rezaei, R., Schlichenmaier, R., Schmidt, W., & Steiner, O. 2007, A&A, 469, L9
- Ruiz Cobo & del Toro Iniesta (1992) Ruiz Cobo, B. & del Toro Iniesta, J. C. 1992, ApJ, 398, 375
- Sánchez Almeida et al. (1989) Sánchez Almeida, J., Collados, M., & del Toro Iniesta, J. C. 1989, A&A, 222, 311
- Sánchez Almeida et al. (2003) Sánchez Almeida, J., Domínguez Cerdeña, I., & Kneer, F. 2003, ApJ, 597, L177
- Sánchez Almeida & Lites (2000) Sánchez Almeida, J. & Lites, B. W. 2000, ApJ, 532, 1215
- Shelyag et al. (2007) Shelyag, S., Schüssler, M., Solanki, S. K., & Vögler, A. 2007, A&A, 469, 731
- Sigwarth et al. (1999) Sigwarth, M., Balasubramaniam, K. S., Knölker, M., & Schmidt, W. 1999, A&A, 349, 941
- Socas-Navarro et al. (2004) Socas-Navarro, H., Martínez Pillet, V., & Lites, B. W. 2004, ApJ, 611, 1139
- Solanki et al. (2010) Solanki, S. K., Barthol, P., Danilovic, S., et al. 2010, ApJL, 723, L127
- Solanki & Montavon (1993) Solanki, S. K. & Montavon, C. A. P. 1993, A&A, 275, 283
- Solanki & Pahlke (1988) Solanki, S. K. & Pahlke, K. D. 1988, A&A, 201, 143
- Solanki & Stenflo (1986) Solanki, S. K. & Stenflo, J. O. 1986, A&A, 170
- Vögler et al. (2005) Vögler, A., Shelyag, S., Schüssler, M., et al. 2005, A&A, 429, 335
- Vargas Domínguez (2009) Vargas Domínguez, S. 2009, PhD thesis, Universidad de La Laguna, La Laguna
- Viticchié & Sánchez Almeida (2011) Viticchié, B. & Sánchez Almeida, J. 2011, A&A, 530, A14
- Viticchié et al. (2011) Viticchié, B., Sánchez Almeida, J., Del Moro, D., & Berrilli, F. 2011, A&A, 526, A60
- Vögler (2003) Vögler, A. 2003, PhD thesis, Göttingen University