Suppression of the Melting Line in a Weakly Disordered Flux-line System
Abstract
An analytic formula describing the suppression of the equilibrium melting line by quenched point pinning disorder is compared to data from ac susceptibility and magnetization measurements in the mixed phase of the layered dichalcogenide low-Tc superconductor 2H-NbSe2. This material exhibits a sharp peak effect in the critical current jc close to the upper critical field H. Arguing that the disorder-suppressed melting line in this system is to be identified with the locus of peak positions of the critical current as magnetic field and temperature are varied, we demonstrate that this formula provides a remarkably accurate fit to the experimental data over three orders of magnitude in magnetic field.
pacs:
PACS:74.25.Uv,74.25.Wx,74.25.Sv,74.60.JgThe translational order of the Abrikosov flux line lattice is disrupted both by thermal fluctuations and by quenched disorderreview1 ; natterman ; shoboreview ; baruch . Thermal fluctuations drive a first-order flux-lattice melting transition in pure systems while quenched disorder destabilizes translational long-range order even at zero temperaturenelson ; larkin . A delicate balance between elastic restoring forces and the twin disordering effects of thermal fluctuations and random pinning thus determines flux line structure and phase behavior in the mixed phase of type-II superconductors with quenched disordershoboreview .
Translational correlations cannot be truly long-ranged in a crystal with quenched disorderlarkin . Qualitatively different states may, however, be identified through the nature of the decay of such correlationsreview1 ; natterman ; shoboreview . In the Bragg glass (BrG), a quasi-lattice phase believed to be stable at weak disorder and low temperatures, such correlations decay asymptotically as power lawsnatterman1 ; giam . Upon increasing either the effective disorder strength or the amplitude of thermal fluctuations, the Bragg glass transforms into a phase in which such correlations decay exponentially. The disordered liquid (DL) is one such stable state obtained at large temperatures (). Another disordered state is obtained in field () scans out of the Bragg glass at low shoboreview . Such a disordered state has glassy attributes, including divergent time-scales for structural relaxation and relatively short-ranged correlations. It may represent a new thermodynamic phase, the vortex glass phase, distinct from the equilibrium disordered liquidffh ; natterman ; glass .
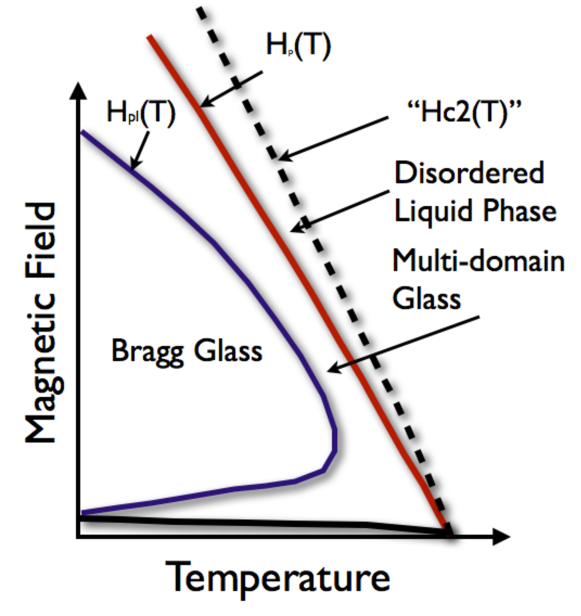
At large , the DL phase appears to transform continuously into the glass when is reduced. At low and intermediate values of , it appears to freeze discontinuously. This freezing in the intermediate interaction-dominated regime has traditionally been understood as occurring directly into the Bragg glasspopular ; kiervin . Such a view is, however, at odds with a large body of data in which anomalies associated with the freezing transition, such as a discontinuity in the magnetization, often appear well separated from another structural transition which occurs at lower temperatures, particularly for more disordered samplesmypaper1 ; mypaper2 ; mypaper3 . An attractive way to reconcile a large number of experimental observations on both high-Tcand low Tc materials is via the proposal that two transition lines always separate the BrG phase from the DL phase, with a sliver of disordered glassy phase intervening. This possibility is illustrated in Fig. 1mypaper1 ; mypaper2 ; mypaper3 , with the intermediate glassy phase termed as a “multi-domain glass”. The phase diagram of Fig. 1 has been argued elsewhere to be a generic phase diagram for the mixed phase with quenched point pinningmypaper3 . Among its distinctive features is the identification of a smooth connection between high-field and low-field glassy phases, a proposed equivalence of the peak effect as seen in temperature scans as and the “fish-tail” effect seen in field scans at low temperatures, as well as a specific prediction for vortex-line structure in the intermediate glassy phasemypaper1 ; mypaper2 ; mypaper3 .
In Fig. 1, the Bragg glass melts into the disordered liquid phase on increasing via an intermediate glassy phasemypaper1 ; mypaper2 ; mypaper3 . This glassy regime broadens both at large as well as very small , reflecting the increased importance of disorder both at high fields, where the multi-domain glass phase is encountered, and at low fields, where a reentrant disordered state has been predicted and indeed seenghosh . The intervening sliver of disordered phase has been identified with the peak effect regime, the narrow region close to Hc2 in () space in which the critical current increases anomalously in a variety of low and high-Tc superconductorsshobo ; peak1 ; peak2 ; peak3 ; peak4 . Susceptibility measurements on a variety of low-Tc materials indicate that the phenomenon of the peak effect itself exhibits a generic two-step character, in agreement with the proposed phase diagram. In this picture, the first phase boundary encountered when cooling from the disordered liquid state is the remnant of the thermal melting line in the pure system, renormalized suitably by disorder. This phase boundary is then identified with the loci of peaks in in space.
Significantly, this proposal also motivates a new interpretation of the classic problem of the peak effect: the peak effect is simply a result of the disordered, high vortex glass phase intervening between two relatively low phases, the Bragg glass phase and the equilibrium disordered liquid. In this picture, the “hardening” of the vortex system as a consequence of the transition into the multi-domain glass phase (rather than the smooth “softening” envisaged in Pippard’s original scenariopippard or a possibly sharp crossover from collective to individual pinningmikitik ; koopmann ), is the underlying cause of the peak effectmypaper2 . Such an increase in critical currents in poly-domain structures has indeed been seen in recent simulationsmoretti . A recent study of this intermediate phase is reported in Ref. pasquini , while earlier work examined this regime using scanning ac Hall microscopy, proposing the possibility of “coexistence” within the peak effect regime as an explanation for the anomalies seen within this regimemarchevsky .
While translational correlations in the BrG phase are of power-law character, those in the DL phase are short-ranged, with typical scales of order a few interline spacings. We have argued elsewhere that the most appropriate description of structure in the intermediate disordered phase is in terms of a disordered arrangement of ordered domains, as in a “multi-domain glass” (MG) phasemypaper1 ; mypaper2 ; mypaper3 . Using formulae appropriate to the collective pinning regime, a conjecture for typical domain sizes, and experimentally obtained values of in very weakly disordered samples of 2H-NbSe2 indicate , with the mean-intervortex spacing, suggesting that the domain sizes in the MG phase of systems with low levels of pinning can be far larger than the correlation length at freezing in the pure systemmypaper1 ; mypaper2 . Such a picture rationalizes the association of magnetization discontinuities with the transition out of the DL phase. Further, it suggests that examining the instability of the DL phase to a phase with solid-like structural correlations may be a good starting point for the calculation of the DL-MG phase boundary.
This paper compares a generalized version of the predictions of a simple semi-analytic theory of the DL-MG phase transition, proposed in Ref. mypaper2 , with results from ac susceptibility and magnetization measurements on the low-Tc dichalcogenide superconductor 2H-NbSe2. This material, with Tc 7.1K, shows a remarkably sharp peak effect signal in an interval within about 10% of H. Structure in the peak effect regime in 2H-NbSe2 has been conclusively demonstrated to be domain-like, validating the approach herefasano ; for related simulations see Ref. moretti .
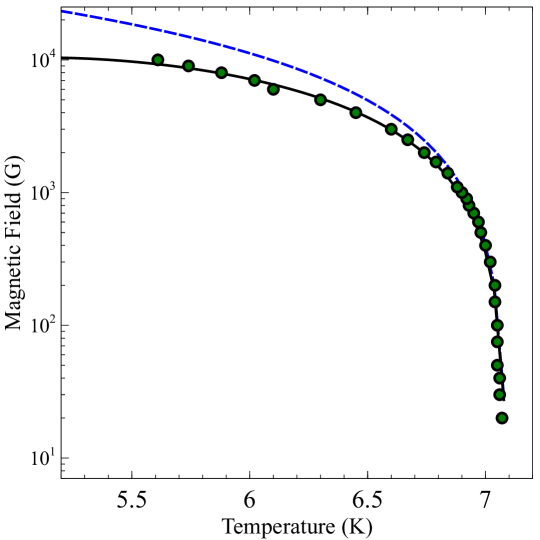
We find that a relatively simple analytic formula provides a remarkably accurate parametrization of the MG-DL transition line, the line in the phase diagram of Fig. 1, provided, as argued extensively elsewhere, the loci of the peak in is identified with this transition. This fit is shown in Fig. 2, using data from ac susceptibility measurements. Fig. 3 exhibits representative data (see below) for the ac susceptibility, while magnetization-based measurements of the critical current are shown in Fig. 4 at one value of the temperature. As can be seen from Fig. 2, the fit to the data is of exceptional quality.
The approach of Ref.mypaper2 , described briefly below for completeness, draws from a early replica theory of correlations in disordered fluids and a replica generalization of the density functional theory of freezing as applied originally to the pancake vortex system in BSCCOgimcdg ; dft . Such density functional theories have been shown to provide a quantitatively accurate picture of the freezing transition in the pure system, including such details as the physics of the anomalous slope of the melting line in these systems and a rationalization of asymmetric hysteresis across the flux-lattice melting transition as induced by the presence of free surfacesdft ; gianni1 ; gianni2 .
Replica methods are generalized to disordered fluids through the model problem of a system of point particles interacting via a two-body interaction and an explicit one-body disorder term gimcdg . Here represents a quenched, random, one-body potential, drawn from a Gaussian distribution of zero mean and short ranged correlations: , with denoting an average over the disorder.

Two point correlation functions, within replica theory, carry two replica indices, denoted by the Greek letters and . Thus, the pair correlation functions and the related direct correlation functions characterize the replicated system at the level of two-particle correlations. Assuming replica symmetry, as appropriate to the equilibrated disordered fluid, we define the replica off-diagonal () and replica diagonal () correlation functions, writing and . Physically, the function describes the disorder-averaged equal-time (equilibrium) correlation of fluctuations of the local density, whereas represents the disorder-averaged correlation of disorder-induced deviations of the time-averaged local density from its average value . Direct simulation tests of the predictions of the theoretical framework for these correlation functions are reported in Ref. ankush .
The density functional theory of freezing takes such correlations as input to a mean-field determination of when the fluid, with density becomes first unstable to the formation of a static density inhomogeneity. Applying replica analysis leads to a density functional which qualitatively resembles the density functional of a pure system, but with renormalized correlationsgimcdg :
| (1) | |||||
Assuming for all , the properties of the density functional are governed by an effective direct correlation function given by . In this description, disorder enters through (i) the suppression of and (ii) the non-trivial character of .
The inter-replica interaction appropriate to vortex lines and pancake vortices is obtained assuming the principal source of disorder to be atomic scale pinning centers chudnovsky . A model calculation yields , where with . is the coherence length in the plane, and for point pinning of strength , with the interlayer spacing () for a layered superconductor (we set for an isotropic superconductor), and . Defect densities of the order of /cm3 are assumedgimcdg . We will use only the dependence of on the field and temperature in our discussion i.e. .
Further progress requires a calculation of the correlation functions and . A replica generalization of the Ornstein-Zernike equations coupling and to and can be derived: these equations must be supplemented, as usual, with appropriate closure schemes, such as the hypernetted chain (HNC) or Percus Yevick (PY)hanmac ; gimcdg .
In mean-field theory, the freezing transition of the pure system occurs when the density functional supports periodic solutions with a free energy lower than that of the uniform fluidry . We now specialize to the flux-line lattice, in which case properties of the freezing transition are controlled by a two-dimensional , the Fourier transform of . Setting to zero simply corresponds to considering arrays of pancake vortices in perfect registry or, equivalently, straight vortex lines representing the crystaldft .
The Hansen-Verlet criterion for the freezing of a two-dimensional liquidhansen ; hanmac indicates that freezing occurs when the structure factor , evaluated at i.e. , attains a value of about 5, a value roughly independent of the nature of the interaction potential. A full density functional calculation yields the same quasi-universality, a direct consequence of the fact that correlations, not microscopic potentials, are the principal determinants of freezingry . Since C, and C is always reduced (although weakly) in the presence of disorder, the equilibrium melting line is always suppressed by quenched disorder.
We use the following ideas: (i) The diagonal direct correlation function is weakly affected by disorder and can thus be approximated by its value in the absence of disorder, (ii) The off-diagonal direct correlation function varies strongly with disorder and with and, (iii) is well approximated at by its value at . Since the Hansen-Verlet condition is satisfied along the melting line, the following holds:
| (2) |
The off-diagonal correlation function decays sharply in in real space; in Fourier space, therefore, its value at is close to its value at . The validity of such an approximation has been tested in Ref. ankush . Thus,
| (3) |
The prefactor scales with temperature as , implying that . Note that increases as is increased or as is decreased, as is intuitively reasonable.
We observe that increases with a decrease in ; reducing increases correlations. The variation in is expected to be smooth within the equilibrium disordered liquid. Thus
| (4) |
where is a smooth function of and close to the melting line. To first order in , can be replaced by and by its value at freezing for the pure system: . We may also neglect the and dependence of i.e. , with a constant; at melting this dependence should be small provided .
An approximate expression for the suppression of the melting line from its value for the pure case now follows: = , with a constant, related to a temperature derivative of the direct correlation function. Here is the shift in the melting temperature induced by the disorder. This relation predicts a larger suppression of the melting line at higher fields and lower temperatures.
The above result parametrizes the suppression of the melting line by quenched disorder. This result can be combined with results from a calculation of the melting line in the pure system to obtain a simple analytic formula for the MG-DL phase boundarymypaper2 . At low fields, a simple Lindemann parameter-based calculation of this phase boundary appears to be reasonably accurate and yields , where Tc is the critical temperature and is a constant appropriate to the pure systemreview1 . The exponent is characteristic of the fluctuation regime; describes to the mean-field case, whereas is appropriate to the fluctuation dominated regime. This then yields the central prediction for the phase boundary separating disordered liquid from multi-domain glass, mypaper2
| (5) |
In general, we could use any formula here which best models the melting line in the pure system, as inferred, for example, from fits close to Tc. Note that the suppression of the pure melting line by disorder is very weak if is small. This suppression becomes progressively large as is increased, or alternatively, at a lower temperature (larger ) for given . It might appear that the final formula (Eq. 5), with and as potential unknowns, contains a fairly large number of fitting parameters. However, note that as T Tc, the suppression term becomes irrelevant. Thus, two of the three parameters are fixed vis a vis the pure system, or equivalently, by an independent fit close to Tc; only a single free parameter is required to fit the suppression of the melting line by disorder, provided an independent fit to the pure system melting line close to Hc2 is available.
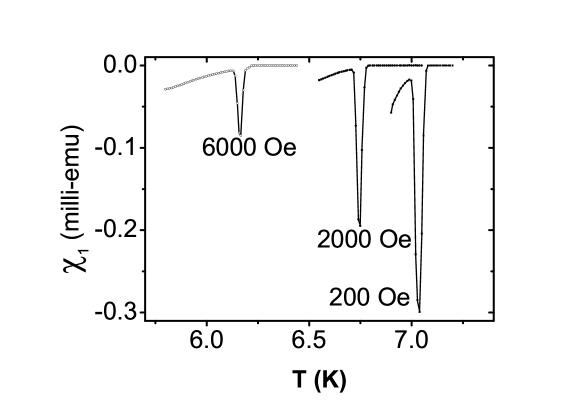
We now describe the details of our experiments. The peak effect in pure single crystals () is tracked by ac susceptibility (a 10 Hz ac field of amplitude 1 Oe) and dc magnetization measurements using a Quantum Design SQUID magnetometer. Susceptibility measurements are carried out by varying temperature at different magnetic fields ranging from 50 Oe - 10000 Oe. Critical currents are inferred from field dependent magnetization hysteresis measurements at different temperatures above 2.5 K. The peak effect manifests itself in a susceptibility measurement through a dip in the real part of the ac susceptibility ; the minimum value of this quantity corresponds to the maximum value of the critical current. Typical plots of vs at applied fields of 6000, 2000 and 200 Oe is displayed in Fig. 3. Fig. 4 shows critical currents as inferred from magnetization measurements as the field is varied. The peak effect in magnetization measurements is obtained through the broadening of the magnetization hysteresis loops. The locus of the peak field vs temperature H(T) is independent of the technique used. In both cases a sharp peak is observed.
Fig. 2 contains the main result of this paper, exhibiting points for the locus of peak positions (,T in space, as obtained from susceptibility measurements. A fit to the freezing line for the multi-domain glass state, Eqn. 5, is shown in the same plot, with the fitting parameters , , and (assuming XY exponents). The dashed line is a fit to the case where , as is conventionally assumed in Lindemann-parameter approaches to the melting transition. Observe the almost perfect agreement, over 3 decades or more in magnetic fieldghosh . As we argue above, the suppression of the pure melting line can be parametrized by a single number, related to the suppression of the direct correlation function in the vicinity of the ordering wave-vector. Thus, our approach to parameterizing this phase boundary, apart from the agreement with experiment we demonstrate, is also economical in terms of being a single-parameter fit.
In conclusion, we stress the main features of our analysis and our central result. We compute the suppression of the melting phase boundary in the pure system by quenched disorder. In contrast to approaches based on Lindemann parameter based measures of the instability of the Bragg glass phase, we determine the instability of the liquid to a static density wave. This instability, within the density functional formalism, arises as a consequence of correlations which build up in the liquid phase; the method applied here parametrizes the effects of disorder in reducing such correlations. In general, it is to be expected that theoretical methods which study the instability towards freezing of a fluid phase should better equipped to capture the physics of the MG-DL line than methods which study the instability of a solid phase using a Lindemann criterion or its variants.
Our central result, an expression for the disorder-suppressed phase boundary in the plane across which the disordered liquid becomes unstable to a state which at least locally resembles a crystal, provides a remarkably accurate fit to the experimental data on the classic low-Tc superconductor 2H-NbSe2. The physical picture we outline is consistent with a general link between the loci of peak effect phenomena, reflecting the onset of complex dynamics of a driven vortex system, and underlying equilibrium order-disorder transitions as mirrored in the static phase diagram of Fig. 1mypaper1 ; mypaper2 ; mypaper3 . More work to test the validity of the theoretical prediction of against data from a variety of superconducting materials as well as to investigate the proposed universality of the phase diagram of Fig. 1 would be very useful.
Support from DST (India) is gratefully acknowledged. We thank NEC Research Institute, Princeton, where these crystals were grown, for support.
References
- (1) G. Blatter et. al., Rev. Mod. Phys., 66, 1125 (1994).
- (2) T. Nattermann and S. Scheidl, Advances in Physics, 49, 607 (2000).
- (3) T. Giamarchi and S. Bhattacharya, in High Magnetic Fields: Applications in Condensed Matter Physics and Spectroscopy, Ed. C. Berthier, Springer-Verlag, pp. 314 (2002).
- (4) B. Rosenstein and D. Li, Rev. Mod. Phys. 82, 109 (2010)
- (5) D. R. Nelson, Phys. Rev. Lett. 60, 1973 (1988)
- (6) A. Larkin and Y. N.Ovchinnikov, Sov. Phys. JETP, 38 854 ( 1974); J. Low. Temp. Phys, .34 409 (1979).
- (7) T. Nattermann, Phys. Rev. Lett. 64, 2454 (1990).
- (8) T. Giamarchi and P. Le Doussal, Phys. Rev. Lett 72, 1530 (1994); Phys. Rev. B, 52, 1242 (1995); ibid., 55, 6577 (1997).
- (9) D.S. Fisher, M.P.A Fisher and D.A Huse, Phys. Rev. B 43, 130, (1991).
- (10) U.K. Divakar et al. , Phys. Rev. Lett., 92, 237004 (2004).
- (11) V. Vinokur et. al. Physica C, 295, 209, (1998).
- (12) J. Kierfeld and V.M. Vinokur, Phys. Rev. B, 61, R14928, (2000).
- (13) G.I. Menon, Mod. Phys. Lett. B 15 1023 (2001).
- (14) G.I. Menon, Phys. Rev. B, 65, 104527 (2002).
- (15) S.S. Banerjee et al., Physica C, 355/1-2, 39, (2001).
- (16) K. Ghosh et al. , Phys. Rev. Lett., 76, 4600, (1996).
- (17) M. J. Higgins and S. Bhattacharya, Physica C 257 232 (1996).
- (18) S. Bhattacharya and M.J. Higgins, Phys. Rev. B, 49, 10005 (1994); Phys. Rev. B, 52, 64 (1995); Phys. Rev. Lett, 70, 2617 (1993).
- (19) S.S. Banerjee et al., Phys. Rev. B 58, 995 (1998).
- (20) S. S. Banerjee et al., Phys. Rev. B 59, 6043 (1999).
- (21) S. S. Banerjee et al., Phys. Rev. B 62, 11838 (2000).
- (22) S. S. Banerjee et al., J. Phys. Soc. Jpn. Suppl. 69, 262 (2000).
- (23) A.B. Pippard, Phil. Mag. 19 217 (1969).
- (24) G. P. Mikitik and E. H. Brandt, Phys. Rev. B 64, 184514 (2001).
- (25) J.A.G. Koopmann, V.B. Geshkenbein and G. Blatter, Physica C 404 (1-4), 209 (2004).
- (26) G. Blatter, V.B. Geshkenbein and J.A.G. Koopmann, Phys. Rev. Lett. 92, 067009 (2004)
- (27) P. Moretti, M.-C. Miguel, and S, Zapperi, Phys. Rev. B 72, 014505 (2005).
- (28) G. Pasquini, D. Perez Daroca, C. Chiliotte, G. S. Lozano, and V. Bekeris, Phys. Rev.Lett 100 , 247003 (2008)
- (29) M. Marchevsky, M. J. Higgins and S. Bhattacharya, Nature 409, 591 (2001)
- (30) Y. Fasano et al., Phys. Rev. B 66, 020512(R) (2002)
- (31) S. Sengupta et al., Phys. Rev. Lett, 67, 3444, (1991); G.I. Menon et al. Phys. Rev. B, 54, 16192, (1996).
- (32) G. I. Menon and C. Dasgupta, Phys. Rev. Lett., 73, 1023, (1994).
- (33) T. V. Ramakrishnan and M. Yussouff, Phys. Rev. B 19, 2775 (1979).
- (34) A. Sengupta, S. Sengupta and G. I. Menon, Europhys. Lett., 70(5), 635 (2005)
- (35) J.P. Hansen and D. R. Macdonald, Theory of Simple Liquids, (Academic Press. London, 1986), 2nd edition.
- (36) E. M. Chudnovsky, Phys. Rev. Lett. 65, 3060 (1990).
- (37) J.P. Hansen and L. Verlet, Phys Rev, 184, 151 (1969).
- (38) A. De Col, G. I. Menon, and G. Blatter, Phys. Rev. B 75, 014518 (2007)
- (39) A. De Col, G.I. Menon, V.B. Geshkenbein and G. Blatter, Phys. Rev. Lett. 96, 177001 (2006).