I. Physikalisches Institut, Universität zu Köln, Zülpicher Str. 77, 50937 Köln, Germany
Astronomisches Rechen-Institut (ARI), Zentrum für Astronomie der Universität Heidelberg (ZAH) Mönchhofstr. 12-14, 69120 Heidelberg, Germany
Max-Planck-Institut für Astronomie (MPIA), Königstuhl 17, 69117 Heidelberg, Germany
National Astronomical Observatories of China (NAOC), Chinese Academy of Sciences (CAS), 20A Datun Lu, Chaoyang District, Beijing 100012, China
11email: mstein@mpifr-bonn.mpg.de
Disc-mass distribution in star-disc encounters
Abstract
Aims. Investigations of stellar encounters in cluster environments have demonstrated their potential influence on the mass and angular momentum of protoplanetary discs around young stars. In this study it is investigated in how far the initial surface density in the disc surrounding a young star influences the outcome of an encounter.
Methods. The numerical method applied here allows to determine the mass and angular momentum losses in an encounter for any initial disc-mass distribution. Based on a power-law ansatz for the surface density, , a parameter study of star-disc encounters with different initial disc-mass distributions has been performed using N-body simulations.
Results. It is demonstrated that the shape of the disc-mass distribution has a significant impact on the quantity of the disc-mass and angular momentum losses in star-disc encounters. Most sensitive are the results where the outer parts of the disc are perturbed by high-mass stars. By contrast, disc-penetrating encounters lead more or less independently of the disc-mass distribution always to large losses. However, maximum losses are generally obtained for initially flat distributed disc material. Based on the parameter study a fit formula is derived, describing the relative mass and angular momentum loss dependent on the initial disc-mass distribution index . Generally encounters lead to a steepening of the density profile of the disc. The resulting profiles can have a r-2-dependence or even steeper independent of the initial distribution of the disc material.
Conclusions. From observations the initial density distribution in discs remains unconstrained, so the here demonstrated strong dependence on the initial density distribution might require a revision of the effect of encounters in young stellar clusters. The steep surface density distributions induced by some encounters might be the prerequisite to form planetary systems similar to our own solar system.
Key Words.:
Methods: numerical – Protoplanetary discs – (Stars:) circumstellar matter1 Introduction
There is increasing observational evidence that most, if not all, stars are initially surrounded by a circumstellar disc. For example, Lada et al. (2000) found by examining the L-band excess of young stars in the Trapezium cluster a fraction of of all stars to be surrounded by discs. With time these protoplanetary discs become depleted of gas and dust and eventually disappear (Haisch et al. 2001; Hillenbrand 2002; Sicilia-Aguilar et al. 2006; Hernández et al. 2007; Currie et al. 2008; Hernández et al. 2008; Mamajek 2009; Massi et al. 2010). Currently it is unclear which of a variety of physical mechanisms dominates this evolutionary processes, among them there are internal processes like viscous torques (e.g. Shu et al. 1987), turbulent effects (Klahr & Bodenheimer 2003) and magnetic fields (Balbus & Hawley 2002), while photoevaporation (Scally & Clarke 2001; Clarke et al. 2001; Matsuyama et al. 2003; Johnstone et al. 2004; Alexander et al. 2005, 2006; Ercolano et al. 2008; Drake et al. 2009; Gorti & Hollenbach 2009) and tidal torques (Heller 1993; Clarke & Pringle 1993; Ostriker 1994; Heller 1995; Hall et al. 1996; Hall 1997; Larwood 1997; Boffin et al. 1998; Pfalzner 2004; Pfalzner et al. 2005a; Moeckel & Bally 2006; Kley et al. 2008) are candidates for external disc destruction processes.
The focus of the present numerical investigation is on the effect of gravitational star-disc interactions on the disc-mass distribution and, therefore, the mass and angular momentum of the discs. A star-disc encounter111The term ’star-disc encounter’ means here encounters in which only one of the stars is surrounded by a disc, in contrast to disc-disc encounters, which denominate encounters in which both stars are surrounded by discs. can cause matter to become unbound, be captured by the perturbing star or pushed inwards and potentially be accreted by the central star. The extent to which this happens depends on the periastron distance, the mass ratio of the stars, the eccentricity and, moreover, the initial (pre-encounter) mass distribution in the disc. So far, limitations in observations of protoplanetary discs prevented to reveal consistently how the surface density of low-mass discs develops. This means that due to observational constraints there does not exist a unique predetermined initial state for the disc-mass distribution before an encounter. A wide variety of surface densities have been derived from fitting resolved millimeter continuum or line emission data with parametric disc structure models (e.g. Mundy et al. 1996; Lay et al. 1997) or in combination with broadband spectral energy distributions (SED) (Wilner et al. 2000; Testi et al. 2001; Akeson et al. 2002; Kitamura et al. 2002; Andrews & Williams 2007b). While those studies have profoundly shaped our knowledge of disc structures, they are all fundamentally limited by low angular resolution.
The standard fitting method underlies the assumption that the surface density has a simple power-law dependence of the form
| (1) |
out to some cut-off radius (e.g. Andrews & Williams 2007a). Estimates based on numerical power-law models fitted to observational data lead to distribution indices ranging roughly from to . Recent works even found anomalous results, e.g. Isella et al. (2009) observed distribution indices of .
Analytical approaches suggest different disc-mass distribution indices, too. The most widely used model is that for a steady state viscous accretion disc with a surface density distribution index of (e.g. Hartmann et al. 1998). However, simulating the evolution of protostellar discs that form self-consistently from the collapse of a molecular cloud core lead to a surface distribution index of (Lin & Pringle 1990; Hueso & Guillot 2005; Vorobyov & Basu 2007) while treating magnetized disc material results in a flatter disc-mass distribution of (Shu et al. 2007). Taking this huge variety of distributions into account, one has to consider different initial disc-mass distributions to evaluate their effect in star-disc encounters.
Most previous numerical studies of star-disc encounters used only a single density distribution, mainly focusing on the case of a theoretically motivated disc-mass distribution (Hall et al. 1996; Hall 1997; Pfalzner 2004; Olczak et al. 2006; Moeckel & Bally 2006; Pfalzner & Olczak 2007). Star-disc encounters with different initial disc-mass distributions were only considered in a very limited way. Heller (1995) performed numerical simulations of two different mass distributions ( and ) concentrating on parabolic encounters with equal mass stars while Hall (1997) investigated initial surface distributions of and for close and penetrating encounters of an unity mass ratio. A study of a wide parameter range focusing on multiple initial disc-mass distributions is still lacking.
Nevertheless, numerical studies of star-disc encounters only allow a sectional view on the processes since it is not possible to simulate each combination of encounter parameters. Earlier analytical studies by Ostriker (1994) did not suffer from this shortcoming. In her study a first order approximation of the angular momentum loss dependent on the initial disc-mass distribution is given. However, the validity of her results is limited to large periastron radii (for example for ), where the angular momentum loss is usually well below . Close or even penetrating encounters cannot be interpreted by this linear perturbation theory (Ostriker 1994; Pfalzner et al. 2005b) making numerical studies indispensable in this regime.
In this work the effects of star-disc encounters have been investigated for a large parameter space considering most configurations that can be expected in a typical young cluster. The investigated mass distributions cover the entire range of the so far observed disc-mass distributions.
Section shortly describes the numerical methods and parameter range used in this study while Section presents the results of the simulations including a fit formula for the mass and angular momentum loss depending on the initial disc-mass distribution index . A summary and discussion is given in Section .
2 Methods
The encounter between a disc-surrounded star with a secondary star is modeled using a code that is based on the numerical method described in Pfalzner (2003). In our simulations only one star is initially surrounded by a disc. However, previous investigations showed that star-disc encounters can be generalized to disc-disc encounters as long as there is no significant mass exchange between the discs (Pfalzner et al. 2005a). In case of a mass exchange the discs can be to some extent replenished, so that for very close encounters the mass loss determined in this study would be slightly overestimated.
A summary of the disc properties can be found in Table 1. The disc is represented by pseudo-particles, distributed according to a given particle distribution . Choosing this relatively low number of simulation particles is motivated by the aim to cover a large encounter parameter space. However, performing test simulations with particles, shows that the lower resolution actually suffice for the here investigated properties.
The simulation particles move initially on Keplerian orbits around the central star. The disc extends from an inner gap of to . The inner cut-off avoids additional complex calculations of direct star-disc interactions and saves computation time. Any pseudo-particle that reaches a sphere of around the central star is removed from the simulation and stated in a commonly used simplified approach as being accreted (Bate et al. 2002; Vorobyov & Basu 2005; Pfalzner et al. 2008). The vertical density distribution in the disc follows
| (2) |
where is the unperturbed mid-plane particle density on the equatorial plane with and the vertical half-thickness of the disc (see Pringle 1981). is chosen as according to a temperature profile of with at the inner edge of the disc.
The temporal development during the encounter is modeled using a fifth-order Runge-Kutta Cash-Karp integrator with an adaptive time step size control for the numerical calculations. Long-range interactions of the gravitational forces between the disc particles and the perturbing star are calculated using a hierarchical tree method (Barnes & Hut 1986).
The total simulation time of yrs for each encounter corresponds to three orbital periods of the outermost particles in the investigated standard disc with size around a star. This time span was found to be adequate for the calculation of all relevant quantities.
The discs obtained at the end of the simulations are still developing in the sense that taking into account viscous forces the eccentric orbits of perturbed disc pseudo-particles would re-circularize on time scales probably in excess of . However, bound and unbound material already can be clearly distinguished shortly after the encounter.
In this study we are interested in protoplanetary discs, which are usually of low mass compared to protostellar discs (Bate 2011). Here low-mass discs mean , where is the mass of the disc surrounded star. The actual used disc-mass value is . However, we tested as well the case and found no differences in the result when including self-gravity in the simulations. In addition, we performed test simulations including pressure and viscous forces using a SPH code (for a description of the code see Pfalzner (2003)), but only found negligible differences () in the results. Therefore, in most of our simulations self-gravitation and viscous forces were neglected in favor of higher computational performance (Pfalzner 2003, 2004).
The actual values of mass and angular momentum loss induced by the encounters are obtained by averaging over several simulations with different seeds for the initial particle distribution. The errors in the mass and angular momentum losses are determined as the maximum differences between the simulation results. They typically lie in the range of .
Besides these obvious performance benefits the possibility to neglect the self-gravitation and pressure and viscous forces allows to further optimize computation time by treating the disc particles as pseudo-particles without a fixed mass during the simulation.
The standard method to generate the initial disc-mass distribution in the simulations is by assigning each pseudo-particle the same mass (Boffin et al. 1998; Pfalzner 2004; Olczak et al. 2006; Pfalzner & Olczak 2007). This approach requires to perform the whole suite of simulations afresh for each variation of the initial disc-mass distribution. By contrast, here the different disc-mass distributions are realized by using a fixed pseudo-particle distribution and assigning their masses after the simulation process according to the desired density distribution in the disc. The implementation of such a flexible numerical scheme allows using one suite of simulations for any initial disc-mass distribution. Note, that the post-processing of the particle mass is only possible because of the restriction to low-mass discs where self-gravitation and viscous forces can be neglected.
The particle masses are assigned to each pseudo-particle in the diagnostic step to calculate the encounter-induced losses and final mass distributions dependent on the initial distribution. For the example of a power-law disc-mass distribution with index the mass of a particle, , depends on its radial position in the disc , the total disc-mass , the number of pseudo-particles , their radial positions and the underlying power-law particle distribution with index . Since the number of pseudo-particles is limited, the discrete particle masses are obtained by
| (3) |
The so established independence of mass and particle distribution allows to improve the resolution of our simulations by placing most of the pseudo-particles initially where the interaction between the stars and disc is strongest.
In most of our simulations a constant particle distribution () is used. This is done because the effects on mass and angular momentum are largest at the outskirts of the disc. Using a constant pseudo-particle density () throughout the disc, ensures a higher resolution in the outer parts even for steep mass density profiles compared to the standard approach. By contrast, if one would be interested in processes that mainly concern the inner parts of the disc, like for example accretion, it would be preferential to use not a constant particle distribution but one that guarantees a high resolution close to the star.
We have tested the method of a posteriori mapping of the particle masses against representative test calculations for different initial pseudo-particle distributions and against the standard method. The differences in the results where in each case negligible and thus justify the generalization of our results for a constant particle distribution ().
Apart from the density distribution the outcome of an encounter depends on the relative periastron distance and the mass ratio between the involved stars , where is the perturber mass. The here investigated parameter space - for a summary see Table 1 - is chosen in such a way that it spans the entire range of encounters likely to occur in a typical young cluster, like the Orion Nebula Cluster. Recent investigations show that the ONC with its high central density might be typical for young clusters with a mass (Pfalzner 2009). The lower limit of the perturber mass ratio was chosen to be as for smaller mass ratios the influence of the perturber becomes insignificant. The upper limit, , is determined by the maximum possible mass ratio in the ONC, which is given by the hydrogen burning limit as lowest mass () and , the approximate mass of the system, which contains the most massive star in the ONC. The limit where perturbations at large distances become negligible depends on the perturber mass. The inner edge of the disc marks the lower value of .
3 Results
Although in principle any mass distribution of circumstellar discs can be studied, exemplary four disc-mass distributions are investigated here in more detail. To cover the entire range of numerically and observationally determined disc-mass distributions a constant mass distribution (), representing the lower boundary of expected distributions, and a distribution, providing an upper limit, are considered. Additionally, a distribution is investigated for comparison to previous star-disc encounter results and a distribution, which is in the range of analytical results for low-mass discs (Shakura & Sunyaev 1973; Pringle 1981) and similar to results found in recent investigations considering magnetized material (see Sec. 1).
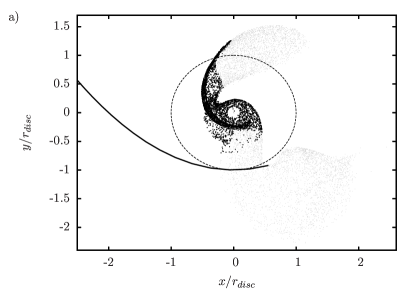
The present investigation focuses on coplanar, prograde encounters on parabolic orbits () (see example in Fig. 2) . Previous studies have shown that even for clusters as dense as the inner ONC region, most encounters in star clusters are expected to be close to parabolic (Larson 1990; Ostriker 1994; Olczak et al. 2010). Such parabolic encounters provide the strongest impact of the perturber on the disc since for higher eccentricities the perturber only interacts shortly with the star-disc system and is, therefore, unable to influence the disc significantly. The limitation to a certain orientation is more restricting, as inclined and retrograde encounters can lead to lower losses in mass (Heller 1993; Hall et al. 1996; Clarke & Pringle 1993; Pfalzner et al. 2005b). However, Pfalzner et al. (2005b) showed that up to an inclination of the mass loss of the disc is only slightly reduced in comparison to a coplanar orbit. This means that our results have to be regarded as an upper limit for encounters at a different inclination.
3.1 Surface density distribution
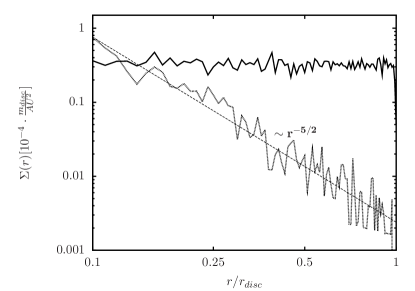
To have a better understanding of the re-distribution of the disc material during a star-disc encounter in dependence of the initial disc-mass distribution we first focus on the evolution of the surface density profiles. The evolution of the surface density in star-disc encounters in dependence of the periastron distance for a constant initial disc-mass distribution () and one with a steep initial distribution () can be seen in Fig. 1. It shows the mass distributions before (solid line) and after a penetrating (, dashed-dotted line), grazing (, double-dotted line) and distant encounter (, dashed line). Here, the relative perturber mass was chosen to be .
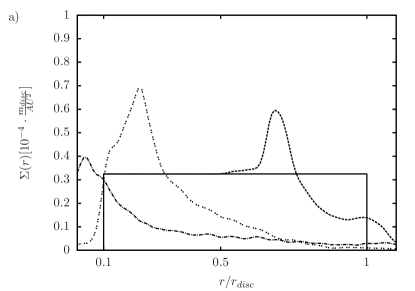
As known from previous investigations (Hall 1997; Larwood 1997) an encounter reduces the density in the outer parts of the disc by transporting some part of the outer disc material inwards and some part migrating outwards. The latter might become captured by the perturber and unbound if the encounter is strong enough. These effects become more pronounced for small and/or large . However, the actual amounts depend on the initial disc-mass distribution. In an equal-mass distant encounter () most of the perturbed disc material is pushed inside the disc towards lower disc radii. In this case of the total disc-mass migrates inwards for an initial constant disc-mass distribution (), whereas it is only for an initial .
The effect of different initial disc-mass distributions becomes even more obvious for closer encounters like grazing (double-dotted lines in Fig. 1) or penetrating fly-bys (dashed-dotted lines in Fig. 1). Here, the migration process and also the differences between the initial distributions are dominated by material moving outwards. In case of a grazing encounter and an initially constant disc-mass distribution of the disc-mass becomes unbound. However, in addition of the total disc-mass can be found outside the initial disc radius of AU still bound to the central star. By contrast, for the steep -mass distributions it only becomes of the disc-mass unbound but again is bound but situated outside AU. We conclude that generally the outer disc material is separated from the disc for grazing encounters while material initially located inside the disc () will be re-distributed but remains bound to the central star. Hence, prominent differences in encounter-induced disc losses for the investigated disc-mass distributions are expected for strong perturbations of the outer disc parts. In penetrating encounters part of the disc material is pushed further inside the disc resulting in an increased surface density in the inner disc regions. In extreme cases the disc loss can be increased to so that the final disc structure can no longer be regarded as a disc.
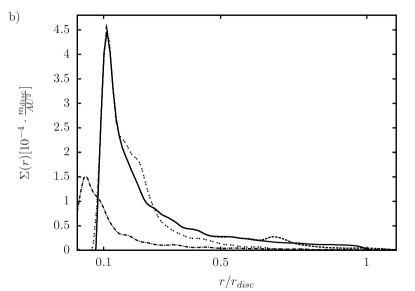
In nearly all cases a steepening of the density profile is the general effect of an encounter. The degree of steepening depends on the mass ratio, periastron distance and the initial disc-mass distribution. Fig. 3 shows that even initially flat distributed disc-material () can be redistributed into a surface density profile steeper than .
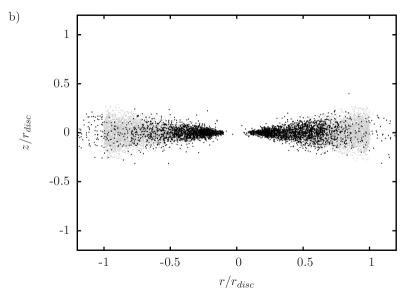
How is the vertical structure of the disc influenced by an encounter? As only coplanar encounters are investigated here, the answer is: surprisingly little. Fig. 2 shows the vertical particle profile of a strongly perturbed disc after a penetrating encounter of . The main effect of the encounter is a decrease in the number of particles in the outer disc regions. In these parts of the disc the resolution is somewhat diminished, but due to our constant particle distribution () still significantly larger than in previous investigations using particle distributions in their simulations.
In a few special cases where material is being pushed moderately inwards even partially negative distribution indices as low as can be the end product of an encounter (Fig. 4). The effect is most prominent for the inner part of perturbed discs with initially constant distributed disc material. Nonetheless, the outer parts of the disc always represent a distribution with positive index, .
This could perhaps explain the negative indices observed for some discs. Observations are still limited to measuring only part of the radial extension of the entire disc. If this happens to be the range were negative indices prevail, one would wrongly extrapolate negative indices for the whole disc, whereas in fact the overall index of the disc would still be positive.
3.2 Relative disc-mass and angular momentum loss
3.2.1 Relative mass loss
Besides changing the shape of the disc-mass distributions, star-disc encounters can remove material from the disc. Fig. 5 shows the relative disc-mass loss for the four initial disc-mass distribution indices , , and . Two representative cases of orbital parameters are singled out: Fig. 5 shows the dependence on the periastron distance for an equal-mass encounter, whereas Fig. 5 depicts the dependence on the mass ratio for grazing encounters ().
Qualitatively, the dependency of the relative disc-mass loss on the periastron distance follows previous results (Pfalzner et al. 2005b; Olczak et al. 2006). However, the absolute values change considerably for the different initial disc-mass distributions. The effect is largest for nearly grazing encounters where mainly the outer disc regions are affected. As to be expected from the respective fraction of material in the outer regions, maximum mass losses are obtained for initially constant disc-mass distributions while losses for the -distribution are lowest. The largest difference in mass loss between the investigated disc-mass distributions in Fig. 5 occurs for , whereas the -distribution has only a mass loss of , the constant mass distribution has a mass loss of .
The situation is somewhat different for very close penetrating encounters () where the discs are so strongly perturbed that the resulting structure can hardly be described as a disc. In this case the disc-mass loss seems relatively independent of the initial mass distribution (see Fig. 5). At the other end of the parameter space - i.e. at large relative periastron distances - the mass loss becomes too small () to infer any dependence on the initial distribution.
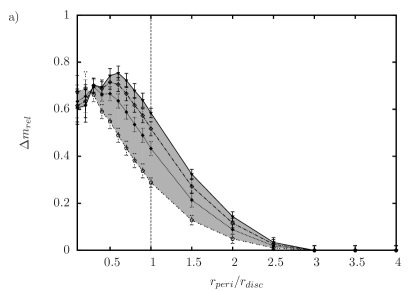
Similarly, the dependence on the initial mass distribution is less pronounced for and (see Fig. 5 for a grazing encounter). So generally weak perturbations - whether distant or of low mass ratio - are not capable to significantly influence the discs, while in the case of strong perturbations nearly the entire disc material is removed independent of the investigated disc-mass distributions. In both cases the mass loss does not depend strongly on the disc-mass distribution. By contrast, encounters of intermediate strength are most sensitive to the disc-mass distribution. For the case shown in Fig. 5 we find maximum differences of up to for .
In case of high-mass ratios and certain non-penetrating periastron distances, which restrict the gravitational star-disc interactions to the outer disc parts, differences in mass loss of even up to can be inferred for the different initial disc-mass distributions (see online appendix A).
3.2.2 Relative angular momentum loss
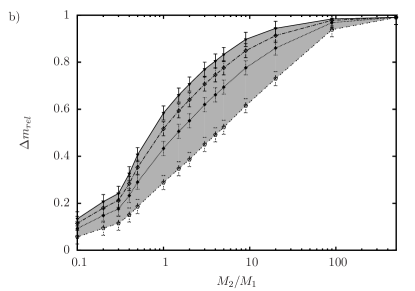
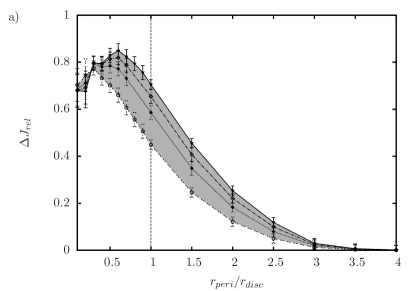
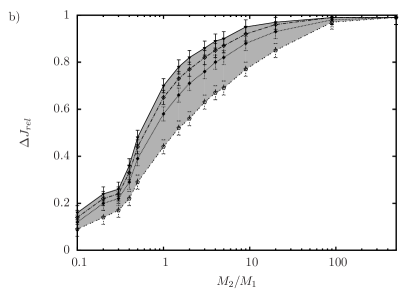
The different initial disc-mass distributions do not only influence the disc-mass loss but also the angular momentum loss. Fig. 6 shows the relative angular momentum loss as a function of the encounter distance for equal-mass encounters and the four different disc-mass distributions used in this work. As expected from previous results (e.g. Pfalzner & Olczak 2007) the general trends in relative angular momentum loss are quite similar to that of the mass loss (compare Fig. 5 and Fig. 6) with angular momentum losses being slightly higher than the disc-mass losses.
While the mass losses for encounters of intermediate strength with and are for the constant mass distribution compared to for the 7/4-mass distribution as shown before, the corresponding angular momentum losses are and , respectively. Material migrating inwards or becoming unbound due to an encounter leads to a relative angular momentum loss, while part of the disc-mass which is pushed outwards the initial disc-radius but remains bound to the central star increases the total angular momentum of the disc. In total, the dependence on the initial disc-mass distributions is less pronounced for the relative angular momentum loss than for the disc-mass loss.
However, although the differences are lower in maximum the influence of different initial disc-mass distributions on the angular
momentum loss covers a significantly large parameter range (see also online appendix B).
Since mass and angular momentum losses are generally influenced by perturbations of the outer disc parts an initially flat particle distribution with high resolution of the outer disc regions results in an increased accuracy of the disc losses. Nevertheless, disc losses obtained with initially steep particle distributions () found in previous studies (Olczak et al. 2006; Pfalzner & Olczak 2007) are completely reproduced within the error range in the present study.
3.2.3 Adapting a fit formula dependent on the initial disc-mass distribution
The numerical results for the mass and angular momentum loss in this study cover a wide parameter range but, however, present only a discrete classification of the relative losses for the different initial disc-mass distributions. Analytical approaches are a possible option to avoid this disadvantage but are only valid for a very limited parameter space of distant encounters (Ostriker 1994; D’Onghia et al. 2010) . To obtain a general estimate of the effect of arbitrary initial disc-mass distributions on the encounter-induced mass and angular momentum loss of protoplanetary discs we present a fit formula that is valid for any initial disc-mass distribution, given that it can be expressed by a power law of the form . For this purpose we extended the fit function for the relative mass loss by Olczak et al. (2006) (see Eq.4 therein) and for the relative angular momentum loss by Pfalzner & Olczak (2007) (see Eq.1 therein), which are valid for a -distribution, towards arbitrary surface density distribution indices :
| (5) | |||||
where is the relative periastron distance.
For most of the parameter space the adopted functions fit the data well inside the error range and extend Ostriker’s analytical function for the angular momentum loss considerably. Larger deviations of the fit functions from the simulated losses occur only for high encounter mass ratios of , which was also the case for the established fit functions by Pfalzner & Olczak (2007) and Olczak et al. (2006). In case of disc-penetrating orbits and low-mass ratios the disc losses can be affected by Lindblad and Corotation resonances that are located in the inner disc regions and cause moderate deviations of the fit function from the expected disc losses.
The extended fit functions provide a significant improvement of previous analytical and numerical results. They cover a huge parameter space of the most reasonable initial disc-mass distributions and the most relevant orbital parameter ranges expected for interactions in star clusters of any age.
4 Discussion and conclusion
Most stars are believed to form in clusters (Lada & Lada 2003) and probably undergo at least one encounter closer than during the lifetime of their disc (yrs) (Scally & Clarke 2001). So encounters are likely to have a significant effect on the disc structure. The scope of this study was to determine which role the initial mass distribution in the disc plays in this context. A full parameter study of star-disc encounters, as expected to occur in young dense star clusters like the Orion Nebula Cluster, has been performed with different disc-mass distributions of the form , , that cover the whole range of observed mass distributions in discs. The main results can be summarized as follows:
-
1.
The relative disc-mass loss among the different initial density distributions differs by up to for the same type of encounter. The largest differences are associated with strong perturbations of the outer disc edge, i.e. a grazing encounter in case of equal stellar masses.
-
2.
Although higher amounts of relative angular momentum than disc-mass are lost due to a star-disc encounter, the dependence on the initial disc-mass distribution is less pronounced. Nevertheless, half of the parameter range where angular momentum loss occurs shows differences among the investigated distributions of more than .
-
3.
The disc-mass and angular momentum losses due to a parabolic encounter can be fitted by a function depending on the perturber mass ratio, the relative periastron distance and the index of the initial disc-mass distribution.
-
4.
A steepening of the surface density slope is a general effect of an encounter for any initial disc-mass distribution and can result in distribution indices of even in case of initially flat distributions.
In short, the intuitive result that the flatter the mass distribution the stronger the change of the disc-mass and angular momentum due to encounters has been quantified in this study. This infers that the importance of encounters in young stellar clusters and their potential to trigger encounter-induced losses might be reconsidered depending on the dominant initial disc-mass distribution.
Another consequence of such an encounter is a change of the surface density in the disc on short time scales . In this context, the potentially most significant result of this study is that close encounters can provoke density profiles steeper than independent of the initial disc-mass distributions. As such density profiles are claimed to be the prerequisite to form a planetary system similar to the solar system, encounters in the early history of the solar system could have provided these conditions (Adams 2010). Desch (2007) analytically inferred an initial surface density profile of the solar nebula protoplanetary disc of roughly to form the present planets of the solar system. As a mechanism for the formation of such a steep disc-mass density profile he considered photoevaporation by an external massive star (see also Mitchell & Stewart 2010). Kuchner (2004) found similar results for extrasolar planetary systems suggesting large disc-mass distribution indices of .
Our results emphasize that these steep density profiles do not have to exist ab initio or be formed by photoevaporation processes but that even discs of initially constant distributed material can fulfill the requirements for the formation of a solar system type planetary system in the inner disc regions after a close encounter. Additional evidence for such an encounter in case of the early solar system was given by distant solar system objects on highly eccentric orbits, like the transneptunian object Sedna, and also the sharp outer edge of the solar system at from the Sun (Ida et al. 1999; Allen et al. 2001; Morbidelli & Levison 2004; Kenyon & Bromley 2004).
On the other extreme, encounters can not only lead to profile steepening but as well profile flattening. Even unexpected surface distribution profiles of as observed by Isella et al. (2009) can be explained by the influence of a perturbing star. Non-penetrating encounters of a star-disc system with initially flat distributed disc material easily lead to such density profiles of the inner disc regions. However, photoevaporation as another significant external impact on protoplanetary discs would have to be considered as an additional driver in these considerations.
Consequently, if all young stars would start out with the same disc density structure, the influence of the cluster environment by means of encounters in the very early and dense phases of cluster evolution could account for the observed multitude of disc-mass density profiles.
References
- Adams (2010) Adams, F. C. 2010, ARA&A, 48, 47
- Akeson et al. (2002) Akeson, R. L., Ciardi, D. R., van Belle, G. T., & Creech-Eakman, M. J. 2002, ApJ, 566, 1124
- Alexander et al. (2005) Alexander, R. D., Clarke, C. J., & Pringle, J. E. 2005, MNRAS, 358, 283
- Alexander et al. (2006) Alexander, R. D., Clarke, C. J., & Pringle, J. E. 2006, MNRAS, 369, 229
- Allen et al. (2001) Allen, R. L., Bernstein, G. M., & Malhotra, R. 2001, ApJ, 549, L241
- Andrews & Williams (2007a) Andrews, S. M. & Williams, J. P. 2007a, ApJ, 671, 1800
- Andrews & Williams (2007b) Andrews, S. M. & Williams, J. P. 2007b, ApJ, 659, 705
- Balbus & Hawley (2002) Balbus, S. A. & Hawley, J. F. 2002, ApJ, 573, 749
- Barnes & Hut (1986) Barnes, J. & Hut, P. 1986, Nature, 324, 446
- Bate (2011) Bate, M. R. 2011, MNRAS, 1310
- Bate et al. (2002) Bate, M. R., Bonnell, I. A., & Bromm, V. 2002, MNRAS, 336, 705
- Boffin et al. (1998) Boffin, H. M. J., Watkins, S. J., Bhattal, A. S., Francis, N., & Whitworth, A. P. 1998, MNRAS, 300, 1189
- Clarke et al. (2001) Clarke, C. J., Gendrin, A., & Sotomayor, M. 2001, MNRAS, 328, 485
- Clarke & Pringle (1993) Clarke, C. J. & Pringle, J. E. 1993, MNRAS, 261, 190
- Currie et al. (2008) Currie, T., Kenyon, S. J., Balog, Z., et al. 2008, ApJ, 672, 558
- Desch (2007) Desch, S. J. 2007, ApJ, 671, 878
- D’Onghia et al. (2010) D’Onghia, E., Vogelsberger, M., Faucher-Giguere, C.-A., & Hernquist, L. 2010, ApJ, 725, 353
- Drake et al. (2009) Drake, J. J., Ercolano, B., Flaccomio, E., & Micela, G. 2009, ApJ, 699, L35
- Ercolano et al. (2008) Ercolano, B., Drake, J. J., Raymond, J. C., & Clarke, C. C. 2008, ApJ, 688, 398
- Gorti & Hollenbach (2009) Gorti, U. & Hollenbach, D. 2009, ApJ, 690, 1539
- Haisch et al. (2001) Haisch, Jr., K. E., Lada, E. A., & Lada, C. J. 2001, ApJ, 553, L153
- Hall (1997) Hall, S. M. 1997, MNRAS, 287, 148
- Hall et al. (1996) Hall, S. M., Clarke, C. J., & Pringle, J. E. 1996, MNRAS, 278, 303
- Hartmann et al. (1998) Hartmann, L., Calvet, N., Gullbring, E., & D’Alessio, P. 1998, ApJ, 495, 385
- Heller (1993) Heller, C. H. 1993, ApJ, 408, 337
- Heller (1995) Heller, C. H. 1995, ApJ, 455, 252
- Hernández et al. (2007) Hernández, J., Calvet, N., Briceño, C., et al. 2007, ApJ, 671, 1784
- Hernández et al. (2008) Hernández, J., Hartmann, L., Calvet, N., et al. 2008, ApJ, 686, 1195
- Hillenbrand (2002) Hillenbrand, L. A. 2002, ArXiv Astrophysics e-prints
- Hueso & Guillot (2005) Hueso, R. & Guillot, T. 2005, A&A, 442, 703
- Ida et al. (1999) Ida, S., Larwood, J. D., & Burkert, A. 1999, in Bulletin of the American Astronomical Society, Vol. 31, Bulletin of the American Astronomical Society, 1095–+
- Isella et al. (2009) Isella, A., Carpenter, J. M., & Sargent, A. I. 2009, ApJ, 701, 260
- Johnstone et al. (2004) Johnstone, D., Matsuyama, I., McCarthy, I. G., & Font, A. S. 2004, in Revista Mexicana de Astronomia y Astrofisica Conference Series, Vol. 22, Revista Mexicana de Astronomia y Astrofisica Conference Series, ed. G. Garcia-Segura, G. Tenorio-Tagle, J. Franco, & H. W. Yorke , 38–41
- Kenyon & Bromley (2004) Kenyon, S. J. & Bromley, B. C. 2004, Nature, 432, 598
- Kitamura et al. (2002) Kitamura, Y., Momose, M., Yokogawa, S., et al. 2002, ApJ, 581, 357
- Klahr & Bodenheimer (2003) Klahr, H. H. & Bodenheimer, P. 2003, ApJ, 582, 869
- Kley et al. (2008) Kley, W., Papaloizou, J. C. B., & Ogilvie, G. I. 2008, A&A, 487, 671
- Kuchner (2004) Kuchner, M. J. 2004, ApJ, 612, 1147
- Lada & Lada (2003) Lada, C. J. & Lada, E. A. 2003, ARA&A, 41, 57
- Lada et al. (2000) Lada, C. J., Muench, A. A., Haisch, Jr., K. E., et al. 2000, AJ, 120, 3162
- Larson (1990) Larson, R. B. 1990, in Astrophysics and Space Science Library, Vol. 162, Physical Processes in Fragmentation and Star Formation, ed. R. Capuzzo-Dolcetta, C. Chiosi, & A. di Fazio, 461–463
- Larwood (1997) Larwood, J. D. 1997, MNRAS, 290, 490
- Lay et al. (1997) Lay, O. P., Carlstrom, J. E., & Hills, R. E. 1997, ApJ, 489, 917
- Lin & Pringle (1990) Lin, D. N. C. & Pringle, J. E. 1990, ApJ, 358, 515
- Mamajek (2009) Mamajek, E. E. 2009, in American Institute of Physics Conference Series, Vol. 1158, American Institute of Physics Conference Series, ed. T. Usuda, M. Tamura, & M. Ishii, 3–10
- Massi et al. (2010) Massi, F., di Carlo, E., Codella, C., et al. 2010, A&A, 516, A52+
- Matsuyama et al. (2003) Matsuyama, I., Johnstone, D., & Hartmann, L. 2003, ApJ, 582, 893
- Mitchell & Stewart (2010) Mitchell, T. R. & Stewart, G. R. 2010, ApJ, 722, 1115
- Moeckel & Bally (2006) Moeckel, N. & Bally, J. 2006, ApJ, 653, 437
- Morbidelli & Levison (2004) Morbidelli, A. & Levison, H. F. 2004, AJ, 128, 2564
- Mundy et al. (1996) Mundy, L. G., Looney, L. W., Erickson, W., et al. 1996, ApJ, 464, L169+
- Olczak et al. (2010) Olczak, C., Pfalzner, S., & Eckart, A. 2010, A&A, 509, A63+
- Olczak et al. (2006) Olczak, C., Pfalzner, S., & Spurzem, R. 2006, ApJ, 642, 1140
- Ostriker (1994) Ostriker, E. C. 1994, ApJ, 424, 292
- Pfalzner (2003) Pfalzner, S. 2003, ApJ, 592, 986
- Pfalzner (2004) Pfalzner, S. 2004, ApJ, 602, 356
- Pfalzner (2009) Pfalzner, S. 2009, A&A, 498, L37
- Pfalzner & Olczak (2007) Pfalzner, S. & Olczak, C. 2007, A&A, 462, 193
- Pfalzner et al. (2008) Pfalzner, S., Tackenberg, J., & Steinhausen, M. 2008, A&A, 487, L45
- Pfalzner et al. (2005a) Pfalzner, S., Umbreit, S., & Henning, T. 2005a, ApJ, 629, 526
- Pfalzner et al. (2005b) Pfalzner, S., Vogel, P., Scharwächter, J., & Olczak, C. 2005b, A&A, 437, 967
- Pringle (1981) Pringle, J. E. 1981, ARA&A, 19, 137
- Scally & Clarke (2001) Scally, A. & Clarke, C. 2001, MNRAS, 325, 449
- Shakura & Sunyaev (1973) Shakura, N. I. & Sunyaev, R. A. 1973, A&A, 24, 337
- Shu et al. (1987) Shu, F. H., Adams, F. C., & Lizano, S. 1987, ARA&A, 25, 23
- Shu et al. (2007) Shu, F. H., Galli, D., Lizano, S., Glassgold, A. E., & Diamond, P. H. 2007, ApJ, 665, 535
- Sicilia-Aguilar et al. (2006) Sicilia-Aguilar, A., Hartmann, L., Calvet, N., et al. 2006, ApJ, 638, 897
- Testi et al. (2001) Testi, L., Natta, A., Shepherd, D. S., & Wilner, D. J. 2001, ApJ, 554, 1087
- Vorobyov & Basu (2005) Vorobyov, E. I. & Basu, S. 2005, ApJ, 633, L137
- Vorobyov & Basu (2007) Vorobyov, E. I. & Basu, S. 2007, MNRAS, 381, 1009
- Wilner et al. (2000) Wilner, D. J., Ho, P. T. P., Kastner, J. H., & Rodríguez, L. F. 2000, ApJ, 534, L101