Progress on the neutrino mixing angle,
![[Uncaptioned image]](/html/1111.2397/assets/karlenphoto.jpg)
D. Karlen
Abstract
Until recently, measurements of , which describes the component in the mass eigenstate, gave only upper limits, leaving open the possibility that it is zero and eliminating a source of CP violation in the neutrino sector. This year has seen significant advances in measuring as precision reactor experiments move from construction phase to physics operation and accelerator experiments give first indications that differs from zero. In the years to come, the results from these and other experiments will stringently test the PMNS framework for neutrino oscillation and will start to give information about neutrino CP violation and the neutrino mass hierarchy. This paper summarizes the situation for measuring at this pivotal time in neutrino research.
I INTRODUCTION
It has been a little more than a decade since experiments firmly established oscillations in the neutrino sector by measuring interaction rates of atmospheric neutrinos produced by cosmic rays and solar neutrinos.ref:SKosc ; ref:SNOosc This behaviour is summarized in the PMNS (Pontecorvo, Maki, Nakagawa, and Sakata) framework with the states of definite flavour being a linear combination of states of definite mass, and parameterized by the unitary PMNS matrix, .ref:MNS ; ref:P
As a neutrino propagates, the phases of its components will change relative to each other, provided the mass eigenstates are non-degenerate. This leads to the possibility that a neutrino interaction will produce a charged lepton of different flavour than the one associated with its production, a process known as neutrino oscillation. The probability for a neutrino to oscillate into a different flavour depends on the PMNS matrix elements, the differences between the squared masses of the eigenstates, the neutrino energy, and the distance it has traveled.
The PMNS angles describing solar () and atmospheric () neutrino oscillation have been well measured, as have been the differences between the masses of the eigenstates.ref:PDG
Until this year, the best single constraint on came from the CHOOZ experiment, at 90% C.L.ref:CHOOZ If the angle is zero, perhaps due to some symmetry, this would eliminate a potential source of CP violation in the lepton sector, parameterized by in the equation above. As CP violation is an essential ingredient in the explanation of the matter-antimatter asymmetry in the Universe, the question of whether this angle is non-zero is of great interest. Should it differ from zero, its magnitude determines the feasibility of future experiments to measure .
In the following sections, recent progress towards improving our understanding of by reactor and accelerator experiments is reviewed.
II REACTOR EXPERIMENTS
Neutrinos were discovered in an experiment at the Savannah River nuclear reactor in 1956 through the inverse beta decay (IBD) reaction, .ref:Reines The positron annihilation produces a prompt signal which is followed later by a signal from the neutron capture. The experiment used two 200 L water tanks with cadmium salt added to reduce the neutron capture delay to less than 10s. The two tanks were sandwiched by three larger scintillator tanks for detecting the gamma rays, and a delayed coincidence trigger was used.
In the 1980s and 1990s, several similar experiments were set up to measure the spectrum of neutrinos involved in IBD reactions at various distances from reactors at ILL, Bugey, Rovno, Goesgen, Krasnoyark, Palo Verde, and Chooz. In absense of oscillations, the product of the rapidly falling neutrino flux and the rapidly growing IBD cross section with energy, would result in an observed spectrum of neutrinos that is peaked between 3 and 4 MeV. At a suitable baseline distance, experiments can reveal neutrino oscillation by observing a distortion in the spectrum of neutrinos interacting via the IBD reaction.
The disappearance probability for reactor neutrinos travelling a distance is approximated by
The first term is the more sensitive one for small values for and the sensitivity is maximized when
| (3) |
and so the optimal baseline distance is 1-2 km, for observable reactor neutrinos.
To date, the most sensitive reactor measurement of comes from the Chooz experiment, located in Northern France. It consisted of a 5 ton target of liquid scintillator with gadolinium to enhance neutron capture with a baseline distance of about 1 km to the Chooz reactor. From 3600 events collected in the period 1997-1998, the experiment was able to limit
for eV2.ref:CHOOZ
Three new reactor experiments designed to have significantly better sensitivity for have begun collecting data in 2011; Double Choozref:doublechooz in France, RENOref:reno in Korea, and Daya Bayref:daya in China. All three use larger detectors and are better shielded than the earlier experiments. All three also include identical near detectors to reduce systematic uncertainties in modeling the neutrino flux and cross section and the detector acceptance. The near detectors are located at baselines of about 300-500 m, where the disappearance probability for observable reactor neutrinos is very small.
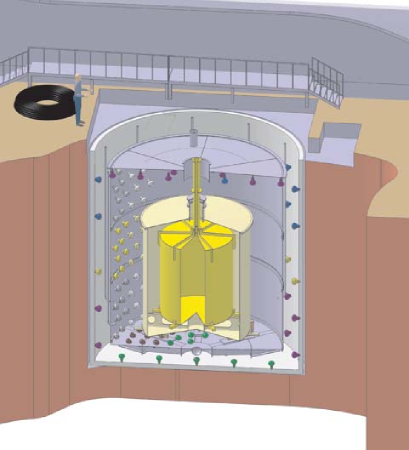
The Double Chooz design uses four concentric cylindrical volumes, as illustrated in Fig. 1. Innermost is the 8.3 ton target, consisting of liquid scintillator with gadolinium held in an acrylic cylinder. The target is located within the so-called gamma-catcher, a larger acrylic cylinder filled with liquid scintillator without gadolinium. These are located within a buffer vessel containing non-scintillating mineral oil and 390 phototubes to measure light from the inner scintillator volumes. This is surrounded by liquid scintillator and phototubes that act as a cosmic muon veto. Phase 1 operation of Double Chooz began in April 2011, with all systems for the far detector working as expected. Phase 2 will begin in the end of 2012, when the near detector site and detectors are expected to be completed.
The two RENO detectors closely resemble the Double Chooz detectors, using four concentric cylindrical volumes. The RENO detectors were completed in February 2011, and filled with liquids in July 2011. Regular data-taking with both detectors began in August 2011.
| Power | L near/far | Depth n/f | Target mass | start date | start date | ||
| Experiment | (GW) | (m) | (mwe) | (tons) | sensitivity | near detector(s) | far detector |
| Double Chooz | 8.7 | 400/1050 | 110/300 | 8.3/8.3 | 0.03 | end/2012 | 4/2011 |
| RENO | 16.4 | 290/1380 | 120/450 | 16/16 | 0.02 | 8/2011 | 8/2011 |
| Daya Bay | 17.7 | 360-1980 | 270/910 | 40,40/80 | 0.01 | 8/2011 + fall/2011 | summer/2012 |
The Daya Bay experiment consists of multiple identical detectors, with four detectors at the far site, and two detectors at each of the two near detector locations. The standard four concentric volume design is used, but with the detectors at the same site sharing the outer veto volume. The large number of detectors allows the properties of the detectors to be compared to confirm systematic errors. Tunnels connect the detector locations, which would allow the detectors to be exchanged if the detector systematic errors are significant. The two detectors at one near detector site have become operational in August 2011, with the other near detector site expected to come on-line later in 2011. The far detector is expected to start operations in the summer of 2012.
There will be significant competition between the three new reactor experiments over the coming years. A summary of their specifications and their starting dates for data collection are given in Table 1. The neutrino detectors themselves are remarkably similar in design concept, which may be optimal in terms of performance for each individual experiment. When combining the results of these experiments in the future, it will be important to consider common systematic errors that come from having such similar designs.
III ACCELERATOR EXPERIMENTS
In 1962, the existence of a second kind of neutrino, , was established by an experiment that directed high energy protons from the BNL AGS onto a target.ref:AGS Neutrinos produced in the decay of secondary hadrons passed through 13.5 m of shielding and through 10 one-ton modules consisting of aluminum plates with spark chambers. Particles produced within the modules, arising from neutrino interactions, were found to be penetrating like muons, rather than showering like electrons.
Contemporary accelerator neutrino experiments estimate by measuring the appearance probability in a nearly pure beam,
Since the energies of beams produced by accelerators are of order 1 GeV, Eq. 3 indicates the optimal baseline is several hundred km. At such great distances, very high power beams and large detectors are necessary to be sensitive to a relatively small . In addition, it is necessary that the detectors can distinguish charged current interactions from other types of neutrino interactions and that the component in the initial beam be small and well estimated.
The appearance probability contains additional terms that depend on the CP violation parameter, , and the sign of the mass difference . The reactor disappearance probability does not depend on these quantities, so the information from reactors and accelerators are complementary.
III.1 The T2K experiment
The T2K projectref:t2kexperiment , approved in December 2003, arose from a fortunate coincidence of having the two major facilities needed to measure separated by an appropriate distance:
-
•
The Japan Proton Accelerator Research Center (JPARC) was under construction at the time, and designed to produce the world’s highest intensity proton beam, thus suitable as a driver for a long baseline neutrino experiment.
-
•
The Super Kamiokande detector (SK), operating for many years as the world’s largest underground water Cerenkov detector, was proven to be an excellent detector of neutrinos from solar, atmospheric, and the earlier K2K experiment, and was located at distance of 295 km from JPARC.
III.1.1 The T2K beam and detectors
The centre of the T2K neutrino beam is intentionally directed 2.5∘ away from SK in order to increase the flux of 0.6 GeV neutrinos passing through SK (giving the largest appearance probability for a 295 km baseline) and to decrease the flux of higher energy neutrinos passing through SK (which can be mis-reconstructed as lower energy neutrinos, an important background in the search for appearance). Charged current interactions, which identify the neutrino type by the flavour of the produced charged lepton, are predominantly quasi-elastic for neutrinos below 1 GeV. This allows for a simple selection of neutrino interactions and to estimate the neutrino energy using only the energy and direction of the charged lepton.
The T2K neutrino beam is produced by bringing 30 GeV protons from the JPARC main ring onto a 1 m long graphite target. The positively charged hadrons (primarily pions) are focused by a set of 3 pulsed magnetic horns and pass through a 100 m decay volume filled with helium gas. The majority of pions decay within that volume, producing a high purity beam with a small contamination from kaon and muon decays, and a small anti-neutrino contamination from negative hadrons.
Several detector systems are in place to monitor the beam properties and its stability. Proton beamline monitors measure the beam current and extrapolate its position and direction on the target. A muon monitor, located immediately downstream of the decay volume, measures the distributions of muons produced from hadron decays. Near detectors, located 280 m from the target, measure the neutrino profile and interaction rate around the beam centre (with the on-axis INGRID detector) and measure the neutrino spectrum, purity, and general neutrino interaction properties along the off-axis direction to SK (with the off-axis ND280 detector).
The on-axis INGRID detector consists of 14 identical modules, each consisting of 7 tons of iron-scintillator sandwich design. The modules are arranged in a cross centred on and transverse to the neutrino beam with 7 placed horizontally side-by-side and 7 stacked in the vertical direction.
The off-axis ND280 detector is a multipurpose spectrometer using the magnet built for the CERN UA1 experiment. The rectangular volume inside the coils, 7 m along along the beam direction and 3.5 m3.5 m transverse to the beam, is instrumented with a suite of detectors to precisely measure and characterize neutrino interactions in the unoscillated beam. The pi-zero detector, consisting of scintillator bars interleaved with water target layers and brass and lead sheets to enhance photon conversion, is designed to efficiently reconstruct neutral current neutrino interactions that produce a , an important background for appearance at SK. Immediately downstream is the tracker, consisting of two fine grained scintillator (and water) target modules sandwiches by three time projection chambers (TPCs) to measure the charged particles from neutrino interactions. The TPC measurements of curvature and ionization energy loss are used to determine the momenta and identify the types of charged particles passing through them. Surrounding the pi-zero and tracker are electromagnetic calorimeters to measure photons and help identify electrons produced in neutrino interactions. Several layers of scintillator planes are instrumented in the yoke of the magnet to provide the side muon range detectors, useful for identifying muons produced by neutrinos and cosmic rays.
The Super Kamiokande detector has been in operation since 1996. The inner detector fiducial volume is 22.5 kton of pure water and is surrounded by 11,129 50-cm diameter photomultiplier tubes to detect the Cerenkov light produced by relativistic charged particles. The signature of a charged lepton that starts and stops within the fiducial volume (a so-called fully contained fiducial volume event, consistent with coming from a neutrino interaction) is a characteristic ring pattern of light. Because electrons produce a shower of particles as they lose energy in the water, the boundary of a Cerenkov ring from an electron is much less sharp than that of a muon. The capability of the detector to distinguish electron and muon neutrino interactions is well understood from high statistics atmospheric neutrino data samples.
III.1.2 T2K data
The appearance probability at SK is evaluated by counting the number of interactions coincident in time with the neutrino pulse passing through SK, corrected for backgrounds and efficiency, and dividing by the number of interactions expected if there were no neutrino oscillations. To evaluate the backgrounds and neutrino beam properties, a complete simulation of the beamline and detectors is used, along with internal data (such as the rate of interactions in the near detector) and external data (such as the hadron production rate measurements from the NA61 experimentref:NA61 and others).
T2K physics data collection commenced in March 2010. Following the summer 2010 shutdown, proton intensities steadily increased to 145 kW. On March 11, 2011, a devastating earthquake struck the east coast of Japan, and damage to JPARC and surrounding areas forced an extended shutdown of the project, after collecting protons on target, only a few percent of the projected amount for the experiment. Remarkable progress has been made to restore the facilities at JPARC, and the experiment plans to begin operations again in January 2012.
The data collected by INGRID show that the neutrino beam properties were very stable, both in terms of the interaction rate per proton on target, and the direction and profile of the beam. The beam direction variation was found to be much less than the requirement of mrad.
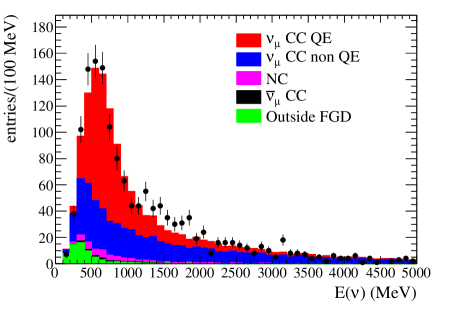
The off-axis ND280 tracker measurement of charged current interactions were found to be in very good agreement with the T2K simulation both in terms of spectrum and rate. The spectrum is shown in Fig. 2 and compared to a simulation which was not tuned to the ND280 data. The ratio of observed to simulated interaction rate is
III.1.3 T2K result on appearance
Since SK was very well understood and calibrated prior to the start of the T2K program, all candidate selection criteria were set prior to T2K data collection and analysis. Candidate events were selected from the sample of fully contained fiducial volume events coincident in time with the pulse of neutrinos from JPARC, having a single ring pattern consistent with an electron, having visible energy above 100 MeV, having a two-ring invariant mass hypothesis of less than 105 MeV, and having a reconstructed energy less than 1250 MeV.ref:t2knue The distributions of two of the critical quantities in the selection are shown in Fig. 3.

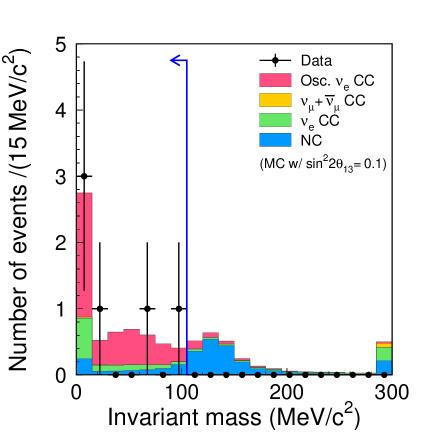
A total of 6 candidate events were selected. If is zero, the expected number of selected events is . The probability to observe 6 or more events in this case is 0.007, a p-value that corresponds to a significance of 2.5. This is the strongest indication to date that differs from zero, and significantly more data is expected from the experiment in the future.
III.2 The MINOS experiment
The MINOS experimentref:MINOS is a long baseline neutrino experiment between Fermilab and the Soudan mine in northern Minnesota and has been collecting data since 2005. More information about the experiment is found elsewhere in these proceedings.ref:sanchez The experiment design was not optimized for sensitivity to appearance, and has a significant background from neutral current interactions. To select a sample enhanced in interactions, events are compared to a library of simulated events to find those with a similar pattern of hits. A neural network classifier, called LEM, is produced using information from the matching library events. Because the near and far detector designs are similar, the near detector can be used to predict the distribution of LEM values for an unoscillated beam in the far detector.
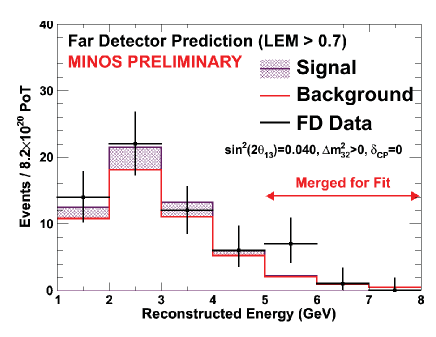
In the MINOS sample, corresponding to protons on target, a total of 62 events in the far detector are selected by the appearance analysis.ref:MINOSnue If is zero, the expected number of events is 49.6. If and , the expected number of events is 68.2. The sources of background are neutral current (34.1 events) misidentified charged current (8.8 events) and intrinsic beam interactions (6.2 events).
The distribution of reconstructed neutrino energies and LEM values are fit in bins to estimate the value and determine a confidence interval. Figure 4 shows the reconstructed neutrino energy distribution for the 62 selected events, compared to the distributions for background only and for the best fit. The p-value for the hypothesis is 0.11, and therefore is included in the MINOS 90% C.L. interval.
III.3 The NOvA experiment
NOvAref:NOVA is a next generation long baseline experiment between Fermilab and Ash River, Minnesota, using an off axis angle of 14 mrad to maximize the neutrino flux in the region of 2 GeV, appropriate for the baseline distance of 810 km. The far detector hall has been completed and the construction of the large 15 kton segmented liquid scintillator detector is expected to be complete in 2014. The appearance probability, , is more sensitive to the CP violation parameter and the neutrino mass ordering with higher neutrino energies. As a result, NOvA and T2K will provide complimentary information to the understanding of neutrino oscillations.
IV SUMMARY
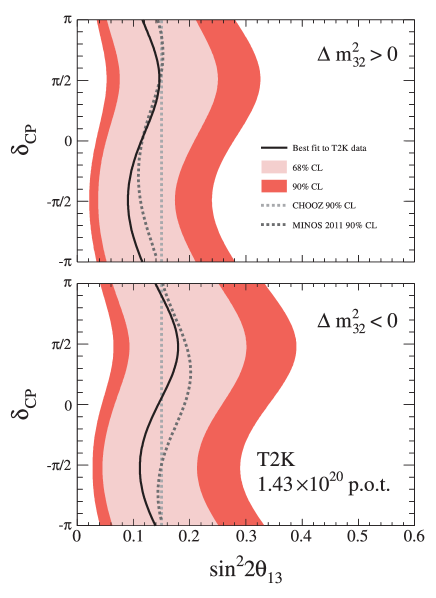
There has been significant advances in the world-wide effort to measure in the past few years. Precision reactor experiments have come on-line this year and accelerator experiments are giving first indications that differs from zero. A combined analysis of all measurements has been carried out, and the significance for is now more than 3.ref:Fogli Confidence intervals for as a function of the CP violation parameter are shown in Fig. 5 for CHOOZ, T2K and MINOS.
In the coming years it will be interesting to see how the different oscillation measurements compare with each other and to see if they remain compatible within the PMNS framework. Combining the present generation of experiments may start to give indications for the CP violation parameter and the neutrino mass ordering. Provided is large enough, future projects with higher beam power and larger detectors may move ahead to definitively measure the amount of CP violation in the lepton sector, important input to understanding the origin of matter/anti-matter asymmetry in the Universe.
References
- (1) The Super-Kamiokande Collaboration, Phys. Rev. Lett. 81, 1562 (1998).
- (2) The SNO Collaboration, Phys. Rev. Lett. 87, 071301 (2001).
- (3) Z. Maki, M. Nakagawa, and S. Sakata, Prog. Theor. Phys. 28, 870 (1962).
- (4) B. Pontecorvo, Sov. Phys. JETP 26, 984 (1968).
- (5) K. Nakamura et al., (Particle Data Group), J. Phys. G 37, 075021 (2010).
- (6) M. Apollonio et al., Phys. Lett. B466, 415 (1999); Eur. Phys. J. C27, 331 (2003).
-
(7)
F. Reines, C.L. Cowan, F.B. Harrison,
A.D. McGuire, H.W. Kruse, Phys. Rev. 117, 159 (1960). -
(8)
Double Chooz collaboration,
arXiv:hep-ex/0606025v4. - (9) RENO collaboration, arXiv:1003.1391v1.
-
(10)
Daya Bay collaboration,
arXiv:hep-ex/0701029v1. - (11) G. Danby, J.-M. Gaillard, K. Goulianos, L.M. Lederman, N. Mistry, M. Schwartz, and J. Steinberger, Phys. Rev. Lett. 9, 36 (1962).
- (12) T2K collaboration, to be published in Nucl. Instrum. Meth. A, doi:10.1016/j.nima.2011.06.067.
- (13) NA61 collaboration, CERN-SPSC-2006-034.
- (14) T2K collaboration, K. Abe, et al., Phys. Rev. Lett. 107, 041801 (2011).
- (15) MINOS collaboration, FERMILAB-DESIGN-1998-01.
- (16) M. Sanchez, Results on disappearance and appearance, these proceedings.
- (17) MINOS collaboration, arXiv:1108.0015v1.
- (18) NOvA collaboration, arXiv:hep-ex/0503053v1.
- (19) G.L. Fogli et al., Phys. Rev. D84 053007 (2011).