AGILE Observations of Terrestrial Gamma-Ray Flashes
Abstract
The AGILE satellite, operating since mid 2007 and primarily devoted to high-energy astrophysics, is one of the only three currently operating space instruments capable of detecting Terrestrial Gamma-Ray Flashes (TGFs), together with RHESSI and -GBM. Thanks to the AGILE Mini-Calorimeter instrument energy range extended up to 100MeV and its flexible trigger logic on sub-millisecond time scales, AGILE is detecting more than 10 TGFs/month, adding a wealth of observations which pose severe constrains on production models. The main AGILE discoveries in TGF science during two and a half years of observations are the following: 1) the TGF spectrum extends well above 40 MeV, 2) the high energy tail of the TGF spectrum is harder than expected and cannot be easily explained by previous theoretical models, 3) TGFs can be localized from space using high-energy photons detected by the AGILE gamma-ray imaging detector. In this presentation we will describe the characteristics of the 2.5-years AGILE TGF sample, focusing on the recent results concerning the TGF high-energy spectral characteristics.
I INTRODUCTION
Terrestrial Gamma-Ray Flashes (TGFs) are very short (lasting up to a few milliseconds) bursts of high-energy photons above 100 keV, first detected by the BATSE instrument on board the Compton Observatory Fishman1994 , and later extensively observed by the RHESSI satellite Smith2005 ; Grefenstette2009 . TGFs have been associated with strong thunderstorms mostly concentrated in the Earth’s equatorial and tropical regions, at a typical altitude of 15–20 km Dwyer2005 . TGFs are widely believed to be produced by Bremsstrahlung in the atmospheric layers by a population of runaway electrons accelerated to relativistic energies by strong electric fields inside or above thunderclouds. The secondaries generated during the acceleration process can be accelerated as well driving an avalanche multiplication Gurevich1992 , commonly referred to as Relativistic Runaway Electron Avalanche (RREA), possibly further enhanced by means of a relativistic feedback mechanism Dwyer2007 ; Dwyer2008 . Although being widely accepted as the underlying physical process in TGF production, the RREA mechanism alone is not sufficient to explain the rich phenomenology of TGFs, especially the observed fluence, and there is no consensus yet on the underlying physical conditions, production sites, radiation efficiencies and maximal energies.
Recently, the AGILE satellite added a wealth of spectral and geographical data on TGFs and established itself as a major player in TGF observation, together with the RHESSI Smith2005 and -GBM detectors Briggs2010 .
AGILE Tavani2008b is a mission of the Italian Space Agency (ASI) dedicated to astrophysics in the gamma-ray energy range 30 MeV – 30 GeV, with a monitor in the X-ray band 18 keV – 60 keV Feroci2007 , operating since April 2007 in a low inclination () equatorial Low-Earth Orbit at 540 km altitude. The AGILE Gamma-Ray Imaging Detector (GRID) is a pair-tracking telescope based on a tungsten-silicon tracker Prest2003 , sensitive in the 30 MeV – 30 GeV energy range. The imaging principle is based on the reconstruction of the tracks left in the silicon detection planes by the electron-positron pairs produced by the primary photon converting mainly in the tracker tungsten planes. A Mini-Calorimeter (MCAL) Labanti2009 , based on CsI(Tl) scintillating bars for the detection of gamma-rays in the range 300 keV – 100 MeV, and a plastic anti-coincidence detector Perotti2006 complete the high-energy instrument. MCAL can work also as an independent gamma-ray transient detector with a dedicated trigger logic acting on several time scales spanning four orders of magnitude between 290 s and 8 seconds Fuschino2008 ; Argan2004 .
Thanks to its flexible trigger logic on sub-millisecond time scales Fuschino2008 , MCAL proved to be a very efficient instrument for TGF detection. In this paper we will review the AGILE achievements in TGF science, focusing on our results on TGF high-energy spectral characteristics and on the correlation with global lightning activity.
II AGILE RESULTS IN TGF SCIENCE
The average MCAL detection rate is TGFs/month, with the current severe selection criteria based on hardness ratio and fluence Marisaldi2010 . When a trigger is issued by the onboard logic, data are collected on an event-by-event basis so that, for every photon, energy, timing with accuracy and topological informations (i.e. the fired detector address) are saved and sent to ground. For a trigger to be classified as a valid TGF candidate, at least 10 photons and a hardness ratio are required, where is defined as the ratio between the number of counts with energy greater than 1.4 MeV and the number of counts with energy lower than 1.4 MeV. There is evidence that relaxed selection criteria may be applied, resulting in the detection of a fainter/softer population which can increase the detection rate more than 50% (Marisaldi, M. et al., in preparation).
The main AGILE discoveries in TGF science during two and a half years of observations are the following:
-
-
the TGF spectrum extends at least up to 40 MeV Marisaldi2010 (well above the previous 20 MeV limit set by RHESSI Smith2005 );
-
-
the high energy tail of the TGF spectrum is harder than expected and cannot be easily explained by previous theoretical models Tavani2010 ;
-
-
TGF can be localized from space using high-energy photons detected by the AGILE silicon tracker Marisaldi2010b
-
-
TGFs are not a random sub-sample of global lightning activity as detected from space Fuschino2011 . Moreover, significant regional differences exist, both in the degree of correlation and in the TGF/flash ratio.
II.1 TGFs high-energy spectrum
The cumulative spectrum of the first 34 high-confidence TGFs detected by AGILE shows a good agreement with the RHESSI cumulative spectral shape below 20 MeV, when the detector response matrices for both instruments are taken into account, but demonstrates also that events of energy up to 40 MeV can be observed Marisaldi2010 . These early observations substantially doubled the previously known TGF energy range set by RHESSI Smith2005 , as later confirmed by the observations of -GBM Briggs2010 .
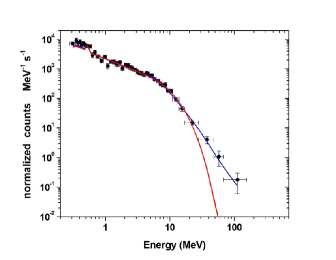
The high energy spectral shape of TGFs became even more puzzling when increased statistics was achieved. Fig. 1 shows the background-subtracted cumulative energy spectrum of a TGF sample of 130 events, satisfying the same stringent selection criteria, detected during the period June 2008 - January 2010. The relevant cumulative background as a function of energy is calculated for events detected in the time interval +1 sec - +21 sec, where is the TGF start time. This method takes into account the 20 orbital modulation of the MCAL background in a satisfactory way. We note that the MCAL background level on TGF timescales is quite low (because of the MCAL anticoincidence vetoing, and of the satellite equatorial orbit), being 0.35 events/ms on average. The MCAL detector response for different off-axis angles has been derived by a combination of simulations and calibration data obtained up to a few MeV with radioactive sources, and up to 460 MeV at the beam test facility of the National Laboratories of Frascati (Italy). In-orbit calibration consistency checks were obtained for different Gamma-Ray Bursts at different angles. Remarkably, we find that the TGF spectrum extends up to 100 MeV with no exponential attenuation. Our data show the existence of a high-energy spectral component in addition to the well-known power-law (PL) component extending up to 10 MeV. The additional component constitutes 10 of the total emitted energy. A broken PL fit of the two components gives a differential photon energy flux F(E) E -0.5±0.1 for 1 MeV E Ec, and for 100 MeV, with MeV (all quoted parameter errors are 1-).
Terrestrial Gamma-Ray Flashes turn out to be very efficient particle accelerators in our atmosphere. Our detected power-law emission between 10 MeV and 100 MeV is difficult to reconcile with current RREA models rousseldupre ; lehtinen ; Dwyer2005 ; Dwyer2008 ; carlson1 ; gurevich2 . Some of these models are characterized by acceleration over typical distances near, e.g., stepped-leader lightning sizes ( m) that correspond to a small number of avalanche lengths. On the contrary, an observed photon energy of 100 MeV implies a lower limit on the acceleration distance where is the average electric field in units of 100 kV/m. These large-scale sizes are a significant fraction of the intra-cloud or cloud-to-ground distances over which potential drops of order of 100 MV can be established in thunderstorms. Furthermore, the detection of TGF emission in the 10-100 MeV range renews the interest for the neutron production in these energetic events as well as in normal lightning. A deteiled report on this discovery is reported in Tavani2010 .
II.2 Gamma-ray localization of TGFs
Since the discovery that TGFs can exhibit energies well above 20 MeV, we started searching for TGF events in the GRID, the AGILE gamma-ray imager sensitive above 20 MeV. The added value provided by the GRID is due to its imaging capabilities so that, for the first time, a TGF could be not only detected, but also localized from space directly in gamma-rays.
In the period between June 2008 and December 2009 the MCAL instrument triggered 119 bursts identified as TGFs according to the selection criteria discussed in Marisaldi2010 . For each of these bursts, the GRID dataset was searched for quasi-simultaneous gamma-ray events within a 200 ms time-window centered at the TGF start time , defined as the time of the first MCAL-photon associated with the TGF. A peak in the cumulative distribution of the arrival times is evident for the 2 ms time bin immediately following . This peak includes 13 events, and the probability for it to be a statistical fluctuation (13 events or higher) is if we assume that GRID events are not correlated to TGFs and are distributed according to the Poisson law with the measured average rate of 5.1 counts/s. All these GRID events take place during the TGF emission time interval estimated from MCAL data only.
Figure 2 shows the scatterplot of the GRID events projection with respect to the AGILE footprint (the point at the Earth’s surface on the straight line joining the satellite and the Earth’s centre), and the distribution of the occurrence density vs. distance from footprint (each bin has been divided by the subtended area in ). The GRID photon directions are obtained by the standard analysis pipeline for photons within the AGILE field of view, and by a custom version of the same software for photons outside the field of view. The photon directions are then back-projected from the satellite position, obtained by GPS data, to the Earth’s surface, parameterized as the World Geodetic System WGS-84 ellipsoid, in order to obtain the production site location. All 9 events are contained within a 1.14 sr solid angle, a factor 3.4 smaller than the solid angle subtended by the Earth at the satellite altitude of 540 km, which corresponds to a maximum visibility projected distance radius of km from the satellite footprint. If the GRID events originate directly from the TGF production site, these results are consistent with a distance to footprint less than km estimated for RHESSI TGFs using sferics data Cummer2005 ; Hazelton2009 ; Cohen2010 ; Connaughton2010 .
The AGILE Tracker detections, described in details in Marisaldi2010b , provide indeed the first direct TGF localization from space. The GRID detection of TGFs above 20 MeV in about 7% of the cases confirms that TGFs emit a substantial amount of energy above this value, as reported in the previous section.
II.3 TGF correlation with global lightning activity
Correlation of TGFs with lightning activity was established shortly after their discovery. Several detailed one-to-one correlations of TGFs with individual lightning strokes have been published, see Connaughton2010 ; Lu2010 for some recent results, but a global climatology of TGFs is still missing, although some steps towards this direction have been reported Smith2010 ; Splitt2010 .
Thanks to its detection capabilities and its very low inclination orbit, AGILE guarantees a high exposure above a narrow equatorial belt. Indeed, with about 120 TGFs/year, the AGILE satellite record the highest TGF detection rate surface density. This capability allowed a detailed high spatial resolution study of the correlation between TGFs and global lightning activity as detected from space by the Optical Transient Detector (OTD), onboard the Orbview-1 spacecraft, and the Lightning Imaging Sensor (LIS), onboard the TRMM NASA mission, (LIS/OTD public data available at http://ghrc.msfc.nasa.gov/). The aim of this correlation study, based on mono and bi-dimensional Kolmogorov-Smirnov test, is to link TGFs to average properties of lightning geographical distribution. Figure 3-A shows the annual lightning flash rate density per km2 per year with a spatial resolution of 0.5 degrees for both longitude and latitude, based on LIS/OTD High Resolution Full Climatology (HRFC) data comprising about 10 years of observations (1995-2005) Christian2003 . Figure 3-B shows the MCAL exposure map, accounting also for the periods during which the trigger logic was active, while figure 3-C shows the global lightning distribution multiplied by the MCAL exposure, that is directly comparable with AGILE TGF distribution. The bin size of 2.5 deg in longitude and 1 deg in latitude corresponds, on ground, to about 275 km and 110 km respectively. In the same image all AGILE TGF positions are also shown, with white and black crosses. Finally, in Figure 3-D the TGF (red) and the exposure-corrected lightning (black) longitude distributions are shown, summed over all latitudes.

At a qualitative level, the longitudinal distributions for TGF and lightning above the continental areas (Figure 3-D) show quite good agreement, and it is possible to recognize the main features of the three continental areas, like the sharp cut over the Congo or the double-peaked feature due to Sumatra and Borneo islands. However, to assess the compliance between the TGF and lightning distributions in a quantitative way, we used the Kolmogorov-Smirnov test (KS hereafter), which provides a probability value (P) for the null hypothesis that two unbinned data sets are drawn from the same distribution. After correction for the AGILE exposure, we find that we cannot consider the global TGF distribution as a random sample of the lightning distribution. Moreover, we find significant regional differences in the degree of correlation. In particular, in the case of south east Asia we find a 87% probability for the TGF distribution being a sub-sample of lightning, while this probability surprisingly drops to 3% in the case of Africa.
The results shown here are an independent confirmation of those reported in the work based on RHESSI data Smith2010 concerning an excess of TGFs above central America and south east Asia and a corresponding depletion above Africa. However, reference Smith2010 reports an eastward shift between TGF and lightning distribution above south east Asia, which is currently not supported by the the very good agreement we found for the two distributions above that region, but we must note that our result is obtained over a much narrower latitude region than that considered in that work. Moreover we must consider that the TGF dataset considered span very different periods of time. In fact, while AGILE dataset includes 118 TGFs detected in 12 months, the RHESSI TGF catalog Grefenstette2009 includes 144 TGFs in the same latitude range, but detected during 102 months of observation. So, while RHESSI TGFs are up to now the most complete sample for climatological studies at a global scale, AGILE exhibits the higher detection rate surface density (TGFs/month per square degree) over a narrower geographical region limited by its orbital inclination, allowing detailed studies of this climatic region.
Based on the crude assumption that the observed TGF/lightning ratio holds at all latitudes we can also estimate a global rate of TGFs per day, in agreement with previous estimates Carlson2009 . The correlation study presented in this section is described in details in reference Fuschino2011 .
III CONCLUSIONS
AGILE is succesfully observing TGFs since June 2008 and is currently one of the only three operating space instruments capable of detecting TGFs. The AGILE payload is very well suited for TGF science. Its main strength points can be summarized as follows:
-
-
AGILE-MCAL effective area peaks in the MeV range, the range where most of the TGF energy is radiated;
-
-
the MCAL energy range is extended up to 100 MeV, allowing to probe the high energy tail of the TGF spectrum;
-
-
the trigger logic on time scales as short as 1ms and 290, well matching the TGF typical time scale, makes the AGILE sample not biased toward the brightest/longest events;
-
-
the MCAL design strategy, spatial segmentation in several independent detection units, makes the instrument less sensitive to dead-time and pile-up effects than monolithic detectors of equivalent volume;
-
-
event data with timing accuracy are available for triggered events: time binning is limited by counting statistics only;
-
-
absolute timing accuracy better than allows precise timing for correlation with on-ground observation of sferic waves associated to lightnings;
-
-
the AGILE-GRID trigger logic is sufficiently flexible to collect also high-energy photons coming from the Earth;
-
-
the AGILE orbit with inclination is optimal for mapping the equatorial region, where most of the TGFs take place, with exposure much larger than other missions;
Thanks to these capabilities, several important results on TGF science based on AGILE observations have already been published Marisaldi2010 ; Tavani2010 ; Marisaldi2010b ; Fuschino2011 , concerning the yet poorly understood TGF high-energy component, the first localization of TGFs from space, and the correlation of TGFs with global lightning activity.
Acknowledgements.
AGILE is a mission of the Italian Space Agency (ASI), with co-participation of INAF (Istituto Nazionale di Astrofisica) and INFN (Istituto Nazionale di Fisica Nucleare). Research partially funded through the ASI contract n. I/089/06/2. The v2.2 gridded satellite lightning data were produced by the NASA LIS/OTD Science Team (Principal Investigator, Dr. Hugh J. Christian, NASA / Marshall Space Flight Center) and are available from the Global Hydrology Resource Center (http://ghrc.msfc.nasa.gov).References
- (1) G. J. Fishman et al., Science, 264, 1313 (1994).
- (2) D. M. Smith et al., Science, 307, 1085 (2005).
- (3) B. Grefenstette et al., J. Geophys. Res., 114, A02314 (2009).
- (4) J. R. Dwyer and D. M. Smith, Geophys. Res. Lett., 32, L22804 (2005).
- (5) A. V. Gurevich, G. M. Milikh, and R. Roussel-Dupre, Physics Letters A, 165, 463 (1992).
- (6) J. R Dwyer, Phys. Plasmas, 14, 042901 (2007).
- (7) J. R. Dwyer, J. Geophys. Res., 113, D10103 (2008).
- (8) M. S. Briggs et al., J. Geophys. Res., 115, A07323 (2010).
- (9) M. Tavani et al., Astronomy and Astrophysics, 502, 995 (2009).
- (10) M. Feroci et al., Nucl. Instrum. Methods A, 581, 728 (2007).
- (11) M. Prest et al., Nucl. Instrum. Methods A, 501, 280 (2003).
- (12) C. Labanti et al., Nucl. Instrum. Methods A, 598, 470 (2009).
- (13) F. Perotti et al., Nucl. Instrum. Methods A, 556, 228 (2006).
- (14) F. Fuschino et al., Nucl. Instrum. Methods A, 588, 17 (2008).
- (15) A. Argan et al., 2004 IEEE Nuclear Science Symposium Conference Record, 371 (2004).
- (16) M. Marisaldi et al., J. Geophys. Res., 115, A00E13 (2010).
- (17) M. Tavani et al., Phys. Rev. Lett., 106, 018501 (2011).
- (18) M. Marisaldi et al., Phys. Rev. Lett., 105, 128501 (2010).
- (19) F. Fuschino et al., Geophys. Res. Lett., 38, L14806 (2011).
- (20) R. Roussel-Dupre and A. V. Gurevich, J. Geophys. Res., 101 (A2), 2297 (1996).
- (21) N. Lehtinen, T. F. Bell and U. S. Inan, J. Geophys. Res., 104 (A11), 699 (1999).
- (22) B. E. Carlson, N. G. Lehtinen. and N. G. Inan, Geophys. Res. Letters, 34, L08809 (2007).
- (23) A. V. Gurevich, K. Zybin and Y. Medvedev, Phys. Lett. A, 349, 331 (2006).
- (24) B. E. Carlson, N. G. Lehtinen and U. S. Inan, J. Geophys. Res., 115, A00E19 (2010).
- (25) S. A. Cummer et al., Geophys. Res. Lett., 32, L08811 (2005).
- (26) B. J. Hazelton et al., Geophys. Res. Lett., 36, L01108 (2009).
- (27) M. B. Cohen et al., Geophys. Res. Lett., 37, L02801 (2010).
- (28) V. Connaughton et al., J. Geophys. Res., 115, A12307 (2010).
- (29) G. Lu et al., Geophys. Res. Lett., 37, L11806 (2010).
- (30) D. M. Smith et al., J. Geophys. Res., 115, A00E49 (2010).
- (31) M. E. Splitt et al., J. Geophys. Res., 115, A00E38 (2010).
- (32) H. J. Christian et al., J. Geophys. Res., 108, 4005 (2003).
- (33) B. E. Carlson et al., J. Geophys. Res., 114, A00E08 (2009).