Comparison of the diffuse H and FUV continuum backgrounds:
On the Origins of the diffuse H background
Abstract
We compare the diffuse H map of our Galaxy with the FUV (1370–1710Å) continuum map. The H intensity correlates well with the FUV intensity. The H/FUV intensity ratio increases in general with the H intensity and the FUV hardness ratio (1370–1520Å to 1560–1710Å), implying that late OB stars may be the main source of the H recombination line at high latitudes. The variation of the H intensity as a function of the Galactic latitude is also very similar to that of the FUV intensity. The results likely suggest that not only the original radiation sources of the H and FUV backgrounds but also the radiative transfer mechanisms responsible for the diffuse backgrounds are largely common. Therefore, we propose a scenario wherein the H background at high latitudes is mostly composed of two components, H photons produced by in-situ recombination at the ionized regions around late OB stars and dust-scattered light of the H photons originating from late OB stars.
Subject headings:
diffuse radiation — ISM: structure — ultraviolet: ISM1. Introduction
The diffuse H background is generally believed to originate from the extended, nearly fully ionized regions (called warm ionized medium, or WIM) along the lines of sight (Reynolds et al. 1998; see Haffner et al. 2009 for a recent review). The volume filling fraction of the WIM increases from at the midplane to at kpc (Kulkarni & Heiles, 1987; Reynolds, 1991; Peterson & Webber, 2002). The large energy requirement of the WIM strongly suggests that O stars in the Galactic plane are the primary ionization source (Reynolds, 1984, 1990a). There have been numerous investigations about how the Lyman continuum (Lyc) photons can escape the immediate vicinity of the O stars (or the bright H II regions) in the Galactic plane and ionize the diffuse interstellar medium (ISM) (Miller & Cox, 1993; Dove & Shull, 1994; Seon, 2009a; Wood et al., 2010). However, the question of how the Lyc photons can propagate almost freely up to the scaleheight ( kpc) of the WIM has not been fully resolved because the photoionization models require the presence of very low density paths through the ISM.
In this paper, we explore two alternatives to explain the diffuse H emission of our Galaxy. The first scenario, which was investigated for external galaxies, is that late, field OB stars outside the bright H II regions ionize some of the WIM, reducing the required Lyc leakage from the bright H II regions in the galactic plane (Hoopes & Walterbos, 2000; Hoopes et al., 2001). The mean spectral type of stars in the field is later than that in H II regions (Massey et al., 1995; Hoopes & Walterbos, 2000). As the H intensity is directly proportional to Lyc intensity in the ionization bounded regions and the later-type stars would produce a lower ratio of ionizing Lyc to non-ionizing far-ultraviolet (FUV) luminosities, the H/FUV intensity ratio can constrain the spectral type of the ionizing stars. Hoopes & Walterbos (2000) and Hoopes et al. (2001) measured H/FUV intensity ratios for 10 nearby spiral galaxies, and concluded that late OB stars in the field are indeed an important source of ionization in those galaxies.
Secondly, we note that the majority of the H excess intensity in a number of high-latitude clouds in our Galaxy can be understood as light scattered off the interstellar dust (Mattila et al., 2007; Lehtinen et al., 2010; Witt et al., 2010). The possible presence of scattered H radiation at high-latitude clouds was first considered by Jura (1979). Photoionization by an external field of Lyc is expected to result in ionization of a thin outer shell of an isolated interstellar cloud while the observations of the Hα light from the high-latitude clouds clearly showed the dense inner core of the cloud as the brightest feature. Witt et al. (2010) argued that both a substantial fraction of the diffuse high-latitude H background intensity and much of the variance in the high-latitude H background are due to scattering by interstellar dust of H photons originating elsewhere in the Galaxy. If this is the case, the diffuse H emission should be closely related to the far-ultraviolet (FUV) continuum background, which is mostly dust-scattered light of the FUV stellar radiation (Bowyer, 1991; Seon et al., 2011).
Therefore, comparison of the diffuse H emission with the FUV continuum background could not only provide a clue to the spectral type of ionizing sources of the WIM in our Galaxy but also confirm the significance of dust-scattering in the diffuse H. In fact, Seon et al. (2011) found a strong correlation between the diffuse FUV (1370–1710Å) and H backgrounds, suggesting a similarity between the origins of both backgrounds. In this paper, we present a more detailed comparison of the Galactic H map with the FUV continuum map and propose a scenario on the origin of the diffuse H emission. We describe the data used in the present study in Section 2. In Section 3, the spectral type of the stars responsible for the diffuse H emission is investigated. Section 4 contains a discussion on the dust-scattering of H photons. We discuss the main result in Section 5. A brief summary is presented in Section 6.
2. Data
The FUV data was obtained by the Spectroscopy of Plasma Evolution from Astrophysical Radiation (SPEAR) instruments, also known as Far Ultraviolet Imaging Spectrograph (FIMS) (Edelstein et al., 2006a, b; Seon et al., 2011). The SPEAR/FIMS instrument is a dual-channel FUV imaging spectrograph (“Short” wavelength channel [S-band] 900-1150Å, “Long” wavelength channel [L-band] 1350–1750Å; ) with a large field of view (S-band, ; L-band, ) and imaging resolution onboard the first Korean astronomical satellite STSAT-1, designed to observe diffuse FUV emission. The SPEAR/FIMS survey observations were performed by scanning the sky at constant ecliptic longitude from the north ecliptic pole to the south ecliptic pole, during the eclipses. The pole-to-pole scanning drifted 360∘ along the ecliptic equator for one year because of the properties of a sun-synchronous orbit. The mission observed % of the sky.
The diffuse FUV map in L-band was obtained by eliminating stars from the total FUV sky map and by binning photon events using the Hierarchical Equal Area isoLatitude Pixelization (HEALPix) tessellation scheme (Górski et al., 2005) with pixels (resolution parameter ). We excluded the wavelength regions of the strongest emission lines (Si IV 1398, Si II* 1532, C IV 1548, 1551, and Al II 1671) and averaged the data in the wavelength regions of 1370–1520Å, 1560–1660Å, and 1680–1710Å. A detailed description of the FUV continuum map is presented in Seon et al. (2011).
The all-sky survey maps in H and 100 m were obtained from Finkbeiner (2003) and Schlegel et al. (1998), respectively. The all-sky map of H I column density is from the Leiden/Argentine/Bonn (LAB) Survey (Kalberla et al., 2005). The data interpolated onto a HEALPix projection were obtained from the Legacy Archive for Microwave Background Data Analysis (LAMBDA).
3. Spectral Type of Ionizing Sources
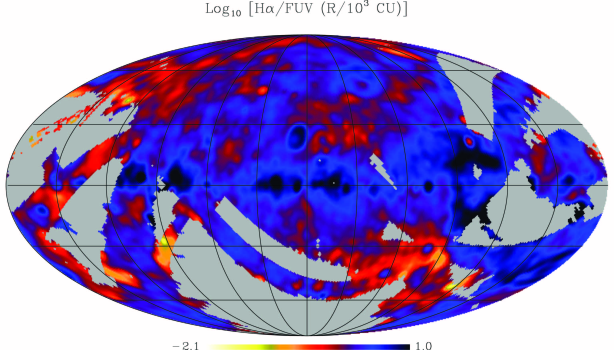
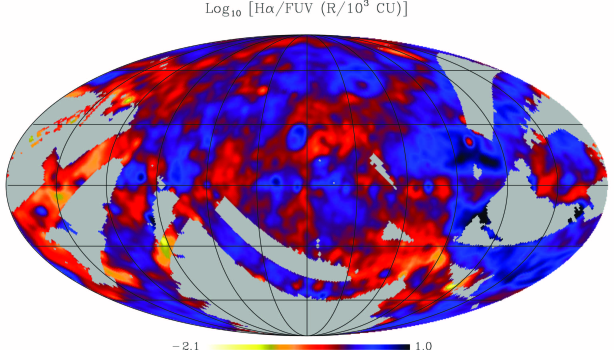
Figure 1 shows the H/FUV intensity ratio maps obtained by dividing the H intensity with the FUV continuum intensity and smoothed with a spherical Gaussian function with a full-width at half maximum (FWHM) (Seon, 2006). The smoothing was performed using the spherical harmonic transform in the HEALPix scheme so to smear the same surface areas in all directions. We excluded the regions with low signal-to-noise ratio (S/N ) and two regions between edges of observing strips centered at and , which appeared to produce an artifact with very high H/FUV intensity ratios after the smoothing. The FUV and H intensities are expressed in units of rayleighs (1 rayleigh [R] photons cm-2 s-1 sr-1) and continuum unit (1 CU = photons cm-2 s-1 sr-1 Å-1). In the figure, the region with higher H/FUV ratio is represented in blue. Top and bottom panels show the intensity ratio maps before and after dust-extinction correction, respectively. Using the standard approach of Bennett et al. (2003) for the emitting medium coexisting with dust and the extinction map of Schlegel et al. (1998), the correction for dust-extinction was performed for both radiations. In the top panel of the figure, it is clear that bright H II regions have higher H/FUV ratios than the diffuse H regions. Correction for dust-extinction lowers the ratio, because the correction for FUV is larger than for Hα. As dust-extinction is stronger at low latitudes, the correction for H II regions is bigger than for the WIM. Therefore, the distinction between the bright H II and the WIM regions becomes less clear after the dust-extinction correction, as shown in the bottom panel.
For the quantitative comparison, the WIM regions (we will use the term WIM to denote the diffuse H regions that are not related to the bright H II regions, regardless of physical origin) were isolated in the H image using a masking procedure similar to that described in Hoopes et al. (2001). The H image was smoothed with a median filter using a pixel size of which corresponds approximately to the size of the largest H II regions. The smoothed image was subtracted from the original, leaving an image of the small-scale structures only. In other words, the smoothly varying component was subtracted. On this image a mask was created by assigning the value ‘1’ to the pixels with intensity lower than a prescribed threshold and ‘0’ to the others. We tried several threshold values between 0.1 and 50 R as the separation between the WIM and H II regions was rather fuzzy. The unsmoothed H image was then multiplied by the mask, leaving an image of only the WIM. A WIM FUV image was also created using the same mask. The H and FUV images for H II regions were created by multiplying the inverted WIM mask.
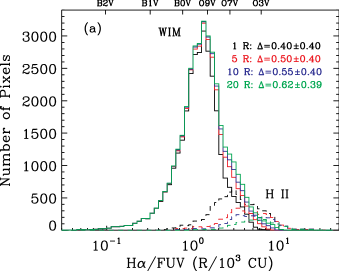
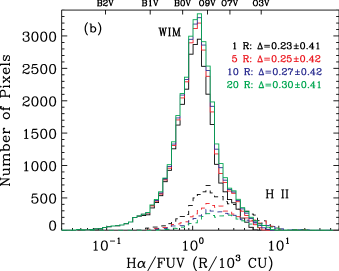
Figure 2(a) shows the histograms of the H/FUV intensity ratios for the WIM and H II regions in our Galaxy, with the thresholds of 1, 5, 10 and 20 R. The threshold ‘1 R’ masks most of the H II regions and ‘20 R’ the brightest ones. The mean ratios for the H II regions are generally higher than the mean ratios in the WIM. The difference in the logarithm of the average ratio between the H II regions and the WIM increases smoothly from to dex as the threshold increases from 1 to 20 R. These values are smaller than those found in 10 external galaxies in Hoopes et al. (2001), although the largest value of is consistent with the results for NGC 2903, NGC 5457, and NGC 1512 within the error ranges. Figure 2(b) shows the histograms of the H/FUV intensity ratios after dust-extinction correction. Correction for dust-extinction lowers the difference in the average ratio, as in the bottom panel of Figure 1.
The smaller difference of the mean ratios in our Galaxy than those of other galaxies may be attributable to geometrical effects, as the WIM and H II regions overlap in our Galaxy while in the face-on external galaxies examined in Hoopes & Walterbos (2000) and Hoopes et al. (2001) two regions are better separated from each other. The field stars in the Galactic plane overlapping with H II regions would lower the H/FUV intensity ratio observed toward the bright H II regions. Some of the H and FUV photons originating from H II regions are scattered into high latitudes (Wood & Reynolds, 1999; Witt et al., 2010; Seon et al., 2011). The dust-scattering of H and FUV photons from the H II regions to high latitudes would then increase the ratio for the WIM, further lowering the difference of the ratios. Furthermore, all the H II regions are at the same distance in a face-on external galaxy while in the Milky Way the apparent size of H II regions is potentially dominated by their distances making the separation more difficult. Therefore, the difference between the H II regions and the WIM in our Galaxy may not be significantly different from other galaxies when the Galaxy is viewed face-on.
Along the top axis of Figure 2 are shown the stellar spectral types that would yield the corresponding H/FUV ratios. We derived a temperature and effective gravity for given spectral types using the calibration of Vacca et al. (1996). We then calculated the Lyc and FUV photon luminosities and for spectral types of B2–O3 stars in the wavebands Å and Å, respectively, by interpolating on a grid of Kurucz models (Castelli & Kurucz, 2003). The H luminosities equal , assuming case B recombination. Since Vacca et al. (1996) covers spectral types only earlier than or equal to B0.5, we extrapolated the calibration down to B2. The temperatures estimated in this way were % higher than the values obtained from the older calibration of Straižys & Kuriliene (1981). The extraporation to B2 would be accurate within %. Figure 2 suggests that the difference between the H/FUV ratios in the WIM and those in the H II regions is due to the difference in main ionizing sources.
An interesting result in Figure 2 is that the median value of the observed ratios in the WIM corresponds to a value predictable from O9 – B0 stars with effective temperatures of 35,000 K. Sembach et al. (2000) modeled the WIM as a combination of overlapping H II regions and found that typical values of the line ratios [S II] 6716/H , [N II] 6583/H , [O I] 6300/H , [O III] 5007/H , and He I 5876/H observed in the Galactic WIM can be well reproduced by an ionizing spectrum of a star with K; Domgörgen & Mathis (1994) also found that the WIM observations best agree with K. The results are consistent with the H/FUV ratios, thereby strongly supporting that the H emission originates from late OB-type stars. The optical line ratios will be discussed more in Section 5. We also note that the H/FUV ratio has a well-defined limiting value corresponding to B2 stars, meaning that the latest stellar type that is capable of ionizing the WIM may be about B2.
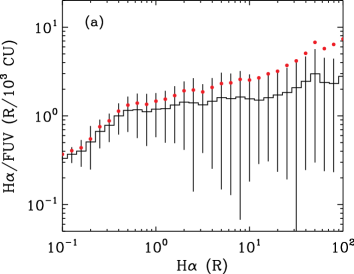
The mean H/FUV intensity ratio after and before the dust-extinction correction as a function of H intensity is shown together with the standard deviation of ratios from the mean value for a given H intensity inverval in Figure 3(a). Uncertainty of the ratio toward an individual sightline is much smaller than the deviation of ratios. Red and black symbols represent the intensity ratio before and after the dust-extinction correction, respectively. There is a general trend for the average ratio to increase with the H intensity, although it scatters a lot. Both the general trend and large scatter are qualitatively similar to those found in the external galaxies in Hoopes et al. (2001). The scatter in the ratio tends to increase with the H intensity. At low latitudes and highest H intensities, the H radiation may be dominated by recombination lines originated from H II regions around early O-type stars, while the FUV background is from dust-scattering (Seon et al., 2011). Therefore, a much wider range of variability in the H intensity and the H/FUV ratio is found. On the other hand, at high latitudes and low values of H intensity, much of the structure in the faint H background may have the same origin as that of the FUV background and the variation of H/FUV decreases. In other words, the H contribution from dust-scattering becomes increasingly important at higher latitudes. A similar feature was found in Figure 21 of Seon et al. (2011), where a linear correlation of the H intensity with the FUV intensity was found only in low intensities. In addition, at lowest H intensities, only early B-type stars would contribute to both backgrounds and the ratio would then converge to a single value. The converged value corresponds to a spectral type of B0 – B1.
Interestingly, line ratios [S II]/H and [N II]/H, and the H/FUV ratio show a similar trend with decreasing H intensity, except the line ratios increase while the H/FUV ratio decreases. Mean values of the optical line ratios increase with decreasing H intensity. The ratios also show large scatter as the H/FUV ratio does. The mean H/FUV ratio decreases rapidly below H intensity of R with decreasing H intensity in Figure 3(a). The mean line ratios increase most dramatically below the same H intensity ( R) (Figures 6, 12, and 15 in Madsen et al., 2006). The similar trend in both the optical line ratios and the H/FUV ratio may be understood as an increasing contribution of late OB stars to the WIM as the H intensity decreases.
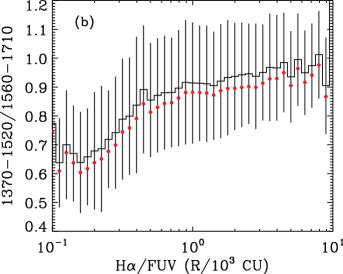
We also plotted the hardness ratio in FUV wavelengths versus the H/FUV ratio as the FUV hardness ratio might also provide an additional clue on the spectral type of the ionizing source of the WIM. The hardness ratio is defined as the ratio of average intensities at Å and Å, excluding the bright C IV, Si II, and Al II emission lines, as in Seon et al. (2011). We found an overall correlation between the FUV hardness ratio with the H/FUV intensity ratio, as shown in Figure 3(b), where the standard deviation of the FUV hardness ratios from its mean value for a given H/FUV bin is also indicated. The mean FUV hardness ratio shows rather rapid decrease below the H/FUV (R/ CU), corresponding to the approximate mean value of the H/FUV ratio of the WIM. Seon et al. (2011) found that a map of the hardness ratio of 1370–1520Å to 1560–1710Å band intensity shows that the sky is divided into roughly two parts, which are determined by the longitudinal distribution of OB-type stars in the Galactic plane. Therefore, the correlation between the FUV hardness ratio and a large portion, if not all, of the H/FUV ratio supports that the diffuse H background is produced by relatively late-type stars rather than H II regions in the Galactic plane.
Statistically significant correlation coefficients of 0.9 and 0.8 for Figure 3(a) and (b), respectively, were obtained. We also note that most of the H/FUV intensity ratios are so concentrated to ~ 1 (R/103 CU), as can be noted in Figure 2, that the two-dimensional histograms and/or contours as in Figure 4 show strong peaks at the H/FUV intensity ratio of ~ 1 (R/103 CU). Therefore, the average intensity ratio versus the abscissa in Figure 3 was the best way to represent clearly the correlations. We note that the H/FUV ratio map (Figure 1) does not match perfectly with the FUV hardness ratio map (Figure 14 of Seon et al. 2011). However, the maps generally correlate well with each other, except a few regions such as near .
Hoopes & Walterbos (2000) and Hoopes et al. (2001) compared the observed H/FUV ratios with the theoretical calculations assuming that the FUV photons are emitted from unresolved point sources in the observed regions. However, FUV photons are well scattered by interstellar dust grains to large distances and the diffuse FUV emission is wide-spread over regions where no point sources are present (Bowyer, 1991; Witt et al., 1997; Schiminovich et al., 2001; Seon et al., 2011). The FUV intensity used in the analysis of face-on galaxies would be produced by in-situ point sources as well as dust-scattered light in the regions, whereas the FUV data in the present study is dominated by dust-scattered light originating from late O- and early B-type stars (Henry, 2002; Seon et al., 2011). We also note that the spectral type of dominant radiation source of the FUV continuum background is consistent with that inferred from H/FUV intensity ratio.
It would be interesting to estimate how a large portion of the ionizing power required for the H background can be provided by late OB stars. If the H emission originates from ionized gas in a plane-parallel geometry, the hydrogen recombination rate per cm2 of galactic disk in the vicinity of the Sun is given by
where is the H intensity at galactic latitude (Reynolds, 1984). Using an approximate H intensity distribution R, which was obtained from rather limited observations, Reynolds obtained s-1 cm-2. However, using the result of Hill et al. (2008) obtained from the full WIM observations, the distribution of H at high latitudes is fitted on average by R (see also Dong & Draine 2011). This leads to a lower recombination rate of s-1 cm-2. The Lyc luminosities per cm2 of the Galactic disk estimated for the solar neighborhood are and photons s-1 cm-2 for O and B stars, respectively (Reynolds, 1984). The fraction of Lyc luminosity of O9 and O9.5 stars in total Lyc luminosity due to O stars is % (Terzian, 1974; Torres-Peimbert et al., 1974). The Lyc luminosity from the stars later than or equal to O9 would then be photons s-1 cm-2. Therefore, late OB stars are able to account for at least one-half of the required ionizing power.
In fact, Elmegreen (1975) considered the intensity of the H background at and concluded that isolated H II regions surrounding early B stars could account for up to one-half of the observed H background in some regions of the Galactic plane. He predicted that near the Galactic poles, B star H II regions would account for a mean H intensity of R. This result is consistent with our estimation.
4. Dust Scattering
The late OB-type stars may not have enough power to produce the whole H background if the H photons originate purely from ionized gas around late OB stars, as noted by Reynolds (1984) and in Section 3. However, if dust-scattering plays an important role, the dust-scattered H photons originating from the sources other than O stars in bright H II regions would contribute a larger portion to the H background at high-latitudes and the severe requirement of Lyc leakage from H II regions in the midplane may be potentially alleviated. In this section, we examine how the contribution of dust-scattering could be significant in the H background.
Galactic observables may generally correlate with each other because of the general property of a plane-parallel ISM. The correlation between a pair of Galactic quantities would be enhanced when their sources and radiative transfer mechanisms are analogous. If a large portion of the diffuse H intensity is due to dust-scattering, the H intensity would show a better correlation with FUV intensity than that with other quantities, such as neutral hydrogen column density (H I). On the other hand, if the radiative transfer mechanism for the diffuse H emission is not related with the dust-scattering, the correlation between the H and FUV intensities would not be improved.
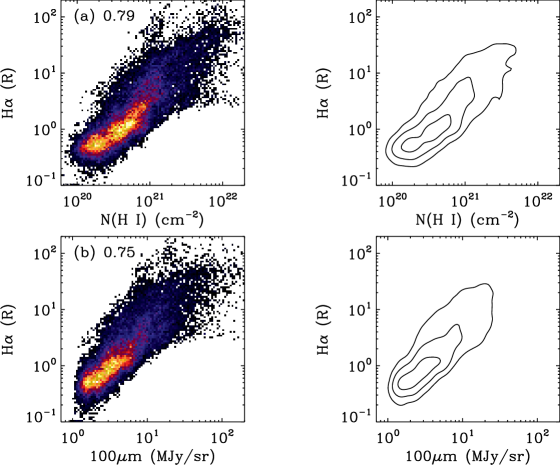
Figure 4 shows the correlation plots of H intensity with 100 m dust emission and H I column density (H I) in the same forms of two-dimensional histograms and contours as in Figure 21 of Seon et al. (2011), in which the FUV intensity is compared with 100 m intensity, (H I), and H intensity. Correlation coefficients estimated in logarithmic scale are also shown in the figure. We find that the correlation of H intensity with FUV (shown in Figure 21(c) of Seon et al. 2011) is a bit better, at least qualitatively, than with the others ISM tracers shown in Figure 4. The correlation relations with 100 m intensity and (H I) are a bit curved and flaring, whereas the correlation with the FUV background is quite straight. However, the correlation coefficient between the H and FUV backgrounds is not significantly higher than the other correlation coefficients.
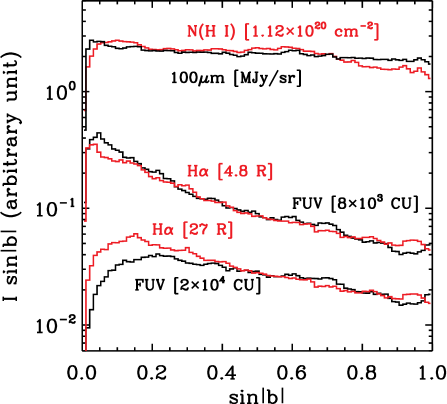
The fact that the correlation coefficients show no significant differences may be caused by large scatter in the correlation relations and the general similarity in the latitude dependence of the data sets (the H I column density, 100 m, H, and FUV intensities). Although the H emissivity and H I column density have different dependences on the gas density, their latitude dependences have the same trend with inverse- if they arise in plane-parallel geometries. The inverse- dependence of the data sets dominates the correlations in Figure 4. To reduce the latitude dependence and scatter, we therefore plotted the average intensities multiplied by versus within each of the latitude intervals for (H I), 100 m, H, and FUV intensities in Figure 5. In the figure, the curves were paired and arbitrarily moved to compare the shapes. The top two curves compare the (H I) and 100 m emission. The middle and bottom pairs show the variations of H and FUV intensities after and before dust-extinction correction, respectively. The (H I) and 100 m emission are well described by the plane-parallel or inverse- law, whereas H and FUV intensities deviate from the law. The deviation of H and FUV intensities from the inverse- law is mainly attributable to the effect of dust absorption and scattering. A radiative transfer model of diffuse Galactic light in plane-parallel dust layer shows the similar dependence of on as in the bottom curves of Figure 5 (van de Hulst & de Jong, 1969; see also Wood & Reynolds 1999 and Seon 2009b). We also note that the inverse- equation of the H intensity described in Section 3 is still a good approximation because of the major dependence of the H intensity on inverse-, especially at high latitudes, even is not a constant in Figure 5.
We note from the bottom two curves before dust-extinction correction that the dependences of the H and FUV backgrounds on the Galactic latitude are very similar at high latitudes () (See also Figure 13 of Haffner et al. 1999 and Figure 9 of Seon et al. 2011), whereas at low latitudes () they show a difference. Stronger dust-extinction in FUV would suppress the FUV intensity near the Galactic plane, as shown in low latitudes. We therefore corrected the dust-extinction as denoted by the middle two curves (red and black solid lines for H and FUV, respectively). The dust-extinction correction for both backgrounds was performed using the standard approach of Bennett et al. (2003). The variations of both backgrounds are remarkably similar to each other. The FUV radiation can be emitted even from late B-type stars, whereas the H emission requires excitation from earlier stars. Therefore, the scaleheight of the FUV sources is a bit higher than that of the H sources. On the other hands, ionized H II regions must be more extended than point sources for the FUV photons, and the dust-scattered H originating from H II regions should be more extended than those from point sources. Accordingly, the dependences of both backgrounds on the Galactic latitude are very similar even at low latitudes, after extinction corrections are applied.
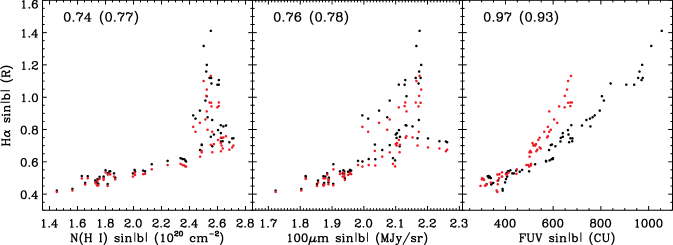
In Figure 6, we also examine correlations of the diffuse H intensity with (H I), 100 m emission, and the diffuse FUV background after the removal of inverse- dependence. In the correlation plot, we used only the latitude range of to avoid the strong dust-extinction effect. Red and black symbols represent the data points after and before the dust-extinction correction, respectively. The figure also shows correlation coefficients. It is obvious that the correlation with the FUV background is now significantly stronger than the correlations with others. In Seon et al. (2011), we compared the FUV continuum background with other ISM tracers and found that the FUV intensity correlates better with the H intensity than with others. The two-photon emission in the WIM is unlikely to be the cause of the strong correlation between the H and FUV backgrounds (Seon et al., 2011). We are therefore convinced of the result that a significant portion of the diffuse H emission at high latitudes is dust-scattered light originated from elsewhere in the Galaxy.
We now estimate the fraction of dust-scattered H emission. Seon et al. (2011) derived two equations (Equations (7) and (8)) relating the FUV intensity to 100 m and H emissions at high latitudes. Since the constant terms in the relations are often regarded as extragalactic background, they should be identical. The difference between the constant terms is indeed negligible. Therefore, the relation between the 100 m and H emission are given by MJy/sr. Witt et al. (2010) provides an empirical relation, which relates the scattered H intensity to the 100 m emission at high latitudes. Using these relations, we obtain an average ratio of the scattered H intensity to total intensity, . Therefore, in general, about 37% of the diffuse H emission at high latitudes would be due to dust-scattering. Contribution of the Lyc leakage from bright H II regions may be 13% on average if late OB stars produce about half of the H emission. However, these numbers should be referenced with caution. The scattered portion can be much higher or lower depending on location, as shown in Witt et al. (2010). Since the FUV background traces the dust-scattered light, we expect that the FUV to H ratio would be more or less proportional to the scattered fraction of H background. We note that the scattered fraction of H background shown in Figure 5 of Witt et al. (2010) is more or less anti-correlated with the H/FUV ratio map of Figure 1, verifying the expectation.
5. Discussion
By combing the previous results, we propose that most of the diffuse H background at high latitudes may originate from relatively late O- and early B-stars outside the bright H II regions and from dust-scattered H photons from elsewhere in the Milky Way. The observed H/FUV intensity ratio in general increases with the H intensity, indicating that late OB stars could be important contributors to the diffuse H. As suggested by the strong correlation between the diffuse H and FUV backgrounds, dust-scattering may widely spread out the H recombination photons into regions where there is no ionizing source.
5.1. Ionizing and heating sources
The present scenario is able to explain the line ratios observed in the WIM much more easily than or equally as well as the photoionization models. The higher [S II] 6716/H and [N II] 6583/H line ratios observed in the diffuse H regions compared to those in H II regions have been believed to be the strongest evidence against the theory of a dust-scattering origin of the diffuse H emission (Reynolds, 1990b). However, we have to note that the argument has been based solely on comparison with the line ratios from the bright H II regions. If the line ratios from the ionized regions due to the late-type OB stars are compared with the line ratios in the WIM, the present scenario seems to explain the trend equally as well as the previous photoionization models do.
As already noted in Section 3, mean values of [S II]/H and [N II]/H intensity ratios in the diffuse H regions are well reproduced with late OB stars (Sembach et al., 2000). Figure 3 in Reynolds (1988) shows that the [S II]/H ratios observed in H II regions around late-type stars are higher than those found around earlier-type stars. Recently, O’Dell et al. (2011) pointed out that the similarity of the line ratios between the Barnard’s Loop, the Orion-Eridanus Bubble, and the typical WIM samples is striking and probably indicates a common set of their physical conditions. The ionizing stars of the Barnard’s Loop are O9.5 and O9 types. They found that the photoionization models with the ionization parameter and the stellar temperature K – 40,000 K fully enclose the space of [S II]/H versus [N II]/H occupied by Barnard’s Loop, the Orion-Eridaunus Bubble, and the WIM samples. It is also noticeable that most of the WIM samples in their Figure 7 occupies the region defined by a stellar temperature lower than 40,000 K, probably 35,000 K. Another interesting fact to note is that the elemental abundances required to explain the line ratios in the WIM are close to the B star abundances both in Sembach et al. (2000) and in O’Dell et al. (2011). These results strongly support the late OB star origin of the diffuse H emission.
Weak [O III] 5007/H and He I 5876/H emission line ratios also indicate that the spectrum of the diffuse interstellar radiation field is significantly softer than that from the average Galactic O star population (Reynolds & Tufte, 1995; Madsen et al., 2006).
The increase of the line ratios [S II]/H and [N II]/H can be understood as a significant ioninzation contribution by late OB stars to the WIM. However, their highest values observed in the WIM may need other non-ionizing heating sources, such as shocks, photoelectric heating, and/or turbulent mixing layers (Reynolds & Cox, 1992; Slavin et al., 1993; Collins & Rand, 2001). Other heating sources may include cooling, falling galactic fountain gas initially raised from the midplane by supernovae and microflares from magnetic reconnection (Raymond, 1992; Shapiro & Benjamin, 1993). It should be noted that the pure photoionization models by O-type stars in the midplane also need additional heating sources to explain the highest ratios (Reynolds et al., 1999). The emission lines due to the heating sources that provide the highest line ratios would also be scattered into more extended regions than those originally produced by the heating/ionizing sources. Therefore, the dust-scattering will hamper the clear identification of the original ionization sources.
As noted by Hoopes & Walterbos (2003), the [S II]/[N II] ratio is almost independent of ionizing stellar temperature but depends on the ionization parameter. The photoionization models explain the enhanced [S II]/H line ratios by a diluted radiation field and thus the lowered ionization parameter. Hence the models cannot reproduce the observed constancy of the [S II]/[N II] ratios. Instead, the dust-scattering scenario can naturally explain the constancy of the line ratios.
5.2. Physical properties
Dust scattering has a significant impact on line ratios which are used to determine physical properties of H II regions (O’Dell & Goss, 2009; O’Dell & Harris, 2010). Scattered light is enhanced at shorter wavelengths, which can lead to observed Balmer line ratios that are theoretically impossible. This effect can also lead to overestimates of the electron temperatures derived from the auroral and nebular line ratios of forbidden lines, such as [N II] 5755 /[N II] 6583 which has been used to derive the temperature of the WIM. Serious discrepancies between the H intensity and radio and/or IR intensities could be found when a large portion of the H intensity is due to dust-scattering. This effect was found in the Extended Orion Nebula (EON). O’Dell & Goss (2009) combined 327.5 MHz radio observations and optical spectroscopy to study conditions in the EON. They found an increase in the ratio of emission measures derived from the H line and the 327.5 MHz radio continuum with increasing distance from the dominant photoionizing star Ori C, indicating the increasing contribution of a dust-scattering component to the H intensity with the distance.
Recent observations using the Wilkinson Microwave Anisotropy Probe have found that the ratio of the free-free radio continuum to H is surprisingly low in the WIM (Davies et al., 2006; Dobler & Finkbeiner, 2008; Dobler et al., 2009; Gold et al., 2011). Dong & Draine (2011) proposed a three-component model consisting of a mix of (1) hot gas currently being photoionized, (2) gas that is recombining and cooling after removal of a photoionizing source, and (3) cold H I gas. In the standard model for explaining the observed intensity ratios of the free-free radio continuum to H and [N II] 6583 to H, they assumed that the scattered fraction of the H originating from the hot gas is 20%. The fractions of the hot, cooling, and H I gases were found to be 22, 56, and 2%, respectively. The model predicted that the photoionization should switch off and the gas begins to cool and recombine in a much shorter time ( yr) than O star lifetimes ( yr). Such a short photoionization time scale is rather surprising in that O stars have been generally favored as the source of ionization for the WIM. They therefore suggested that the ionizing radiation for the WIM may be provided in large part by runaway O and B stars, with space velocities km s-1. In the analysis, they assumed the [N II]/H line ratio of for the WIM, which is well reproduced by late OB-type stars (Sembach et al., 2000). The ratio of free-free to H is estimated to be kJy sr-1 R-1 for the WIM with a temperature of 8000 K (Equation (11) in Dong & Draine, 2011), which is about 1.9 times larger than the observed ratio of 0.085 kJy sr-1 R-1. If we assume that 37% of the observed H intensity is from dust-scattering and the temperature of the WIM is 8000 K, the fractions of the hot and cooling gases are found to be 44% and 18%, respectively.
The WIM is thought to have a temperature 2000 K higher than the bright classical H II regions (Reynolds et al., 2001; Madsen et al., 2006). However, O’Dell et al. (2011) found no evidence that the WIM components have a systematically higher temperature than the well known higher-density H II regions. As already noted, the temperature derived from [N II] 5755 /[N II] 6583 may be uncertain. Temperature of the Barnard’s Loop is found to be K (Heiles et al., 2000; O’Dell et al., 2011). From the similarity of the physical conditions between the Barnard’s Loop and the typical WIM sample, we may assume an extreme case that the temperature of the WIM is K, and there is no contribution from either cooling or cold H I gas. The assumptions may be rather extreme, but still plausible at some sightlines since the physical conditions and constribution of dust scattering in individual sightlines would generally differ from the average and vary from sightline to sightline (Madsen et al., 2006; Witt et al., 2010). The free-free to H ratio of is then obtained, which agrees with the observed ratio. Therefore, relatively late O and/or early B-type stars, as proposed in the present study, appear to explain the observed values of not only optical line ratios but also free-free to H intensity ratios even without considering a significant contribution of either cooling or cold H I gas. However, we emphasize that the aim of this study is to explain averaged observational results and our results do not indicate that all the diffuse H emission is produced by late OB stars outside bright H II regions and dust scattering. Large scatter found in Figure 3 also indicates that not only the physical conditions and contributions of various components (dust-scattered component, hot and cooling gases) but also the ionizing and/or heating sources of the WIM vary significantly from sightline to sightline.
Low extinction at 2.17 m Br emission line should allow to probe the WIM throughout the Galactic plane. A pilot survey of the Br emission carried out using the Goddard-Wisconsin near-IR cryogenic spectrometer revealed that the volume filling fraction of the Br-emitting medium is typically around 1%, indicating the Br emission is likely related to more compact sources (Kutyrev et al., 2001, 2004). If the Lyc photons are indeed leaked out of the bright H II regions in the Galactic plane and photoionize the surrounding medium to produce the diffuse H emission, as usually supposed, the filling fraction of the Br-emitting gas in the Galactic plane should be equal to or higher than the filling fraction of 10% obtained by the H observations (Kulkarni & Heiles, 1987; Reynolds, 1991; Peterson & Webber, 2002). This discrepancy strongly suggests that the Lyc leaked out of bright H II regions is unlikely the major source of the diffuse H background and a significant portion of the H background originates from dust-scattering. More detailed observations using hydrogen recombination lines in the near-IR wavelenths, such as Pa (1.87 m), Br (4.05 m), and Br, would be needed to understand the origin of the diffuse H emission. The Multi-purpose Infra-Red Imaging System (MIRIS) is being developed to survey the Galactic plane at Pa emission line, which may help to understand the origin of the diffuse H emission (Han et al., 2010).
The volume filling fraction and scaleheight of the WIM were estimated from the assumption that the pulsar dispersion measure and the H photons probe the same ionized medium. However, as a large portion of the diffuse H background at high latitudes may be the result of dust-scattering, the filling fraction and scaleheight must be reexamined. We also found that some of the small-scale features in the FUV sky coincided with the Hα sky, but not always. A detailed examination of small-scale correlation between the H and FUV background, which should provide better understanding of the origin of the diffuse H emission, will be presented in the future.
5.3. Radiative transfer mechanisms
Assuming the conventional photoionization models of the H background, the ISM may have low-density paths and voids that allow for ionizing photons from midplane OB stars to reach and ionize gas many kiloparsecs above the Galactic plane (Wood et al., 2010). Pathways that provide lower than average densities to high latitudes could enhance both scattered FUV and gas ionized by the Lyc from the same OB stars in the Galactic plane. Stars that can reproduce most of the FUV continuum background in the radiative transfer models (e.g., Witt et al., 1997; Schiminovich et al., 2001) are located within only a few hundred pc from the Sun. FUV photons are predominantly scattered in the forward direction (Witt et al., 1997; Schiminovich et al., 2001; Lee et al., 2008), implying that dust-scattering occurs mostly in between the observer and the source. Preliminary results from our Monte-Carlo 3D radiative transfer models for the FUV continuum background indicate that most of the FUV continuum background originates from stars and dust located within a volume with a size of 1 kpc centered at the Sun (Seon et al., in preparation). The H photons of the WIM are thought to originate within 2–3 kpc distance (e.g., Reynolds, 1984), implying that Lyc photons would also originate from a volume within a few kpc. In this regard, we note that the dust-scattering cross-section at 1550Å is times lower than the photoionization cross-section at 912Å (Weingartner & Draine, 2001; Verner & Yakovlev, 1995), assuming a Galactic dust-to-gas ratio. This suggests that FUV photons should originate from much (probably times) larger volume than H photons, which is in contrast with the radiative transfer models of the FUV continuum background. Meanwhile, the dust-scattering cross-section for H photons is lower than that for FUV (1550 Å) by a factor of (Weingartner & Draine, 2001), indicating that dust-scattering of the FUV photons will occur at closer distances than H photons. Therefore, the dust-scattering of H photons provide a much easier way to explain the diffuse H background than the conventional photoionization models.
Wood & Reynolds (1999) found that the H intensity from midplane H II regions that is scattered by dust at high latitudes is in the range 5-20% of the total intensity. However, we should note that in-situ H recombination photons at high latitudes would be also scattered and this component was not included in the estimation. In Figure 3 of Wood & Reynolds (1999), the scattered H intensity that is originating from the WIM through in-situ recombination is compatible with the scattered light from bright H II regions (point sources) at some high latitudes, indicating higher fraction of dust scattering than 5-20%. Moreover, as noted in Witt et al. (2010), the highly structured distribution in the ratio of H scattering to H in situ emission was not accounted for in the model of Wood & Reynolds (1999). The dust-scattered light of in-situ H emission (originating mostly from late OB-type stars) at high latitudes, and the complex structures of the ISM and ionizing sources may result in a higher fraction of dust-scattering than predicted by the simplistic calculation.
If late OB stars produce about half of the diffuse H intensity, the dust-scattered fraction of the H intensity is more or less at the same level as that due to in-situ recombination. The direct FUV starlight and the diffuse FUV background were found to contribute approximately the same amounts to the total FUV intensity on average (Seon et al., 2011). The similarity of the dust-scattered fractions between the FUV continuum and H backgrounds supports again the idea wherein their sources and radiative transfer mechanisms are similar.
6. Summary
In summary, we found that the H/FUV intensity ratio increases with the H intensity and FUV hardness ratio, implying that late OB-type stars mostly produce the diffuse Hα at high latitudes. We also found that the H correlates with the FUV background very well. The correlations strongly suggest that a large portion of the diffuse H photons originate from late OB-type stars and dust-scattering. We therefore propose a scenario wherein both late OB-type stars and dust-scattering play significant roles in the diffuse H emission. The H background at high Galactic latitudes may mostly originate from late OB stars existing outside the bright H II regions and dust-scattering of the H photons. The proposed scenario appears to reproduce most of the observed line ratios, such as average values of [S II]/H, [N II]/H, [O III]/H and He I/H, and free-free to H ratios. Their extreme values may need additional heating sources, as is also needed in the pure photoionization models. Our scenario is also in better accord with the relative constancy of the [S II]/[N II] intensity ratio, which cannot be explained with the standard photoionization models.
References
- Bennett et al. (2003) Bennett, C. L., Hill, R. S., Hinshaw, G., et al. 2003, ApJS, 148, 97
- Bowyer (1991) Bowyer, S. 1991, ARA&A, 29, 59
- Castelli & Kurucz (2003) Castelli, F., & Kurucz, R. L. 2003, in IAU Symp. 210 (Cambridge: Cambridge Univ. Press), 20
- Collins & Rand (2001) Collins, J. A., & Rand, R. J. 2001, ApJ, 551, 57
- Davies et al. (2006) Davies, R. D., Dickinson, C., Banday, et al. 2006, MNRAS, 370, 1125
- Dong & Draine (2011) Dong, R., & Draine, B. T., 2011, ApJ, 727, 35
- Dove & Shull (1994) Dove, J. B., & Shull, J. M. 1994, ApJ, 430, 222
- Draine (2003) Draine, B. T. 2003, ApJ, 598, 1017
- Dobler et al. (2009) Dobler, G., Draine, B., & Finkbeiner, D. P. 2009, ApJ, 699, 1374
- Dobler & Finkbeiner (2008) Dobler, G., & Finkbeiner, D. P. 2008, ApJ, 680, 1235
- Domgörgen & Mathis (1994) Domgörgen, H., & Mathis, J. S. 1994, ApJ, 428, 647
- Edelstein et al. (2006a) Edelstein, J., Min, K.-W., Han, W., et al. 2006a, ApJ, 644, L153
- Edelstein et al. (2006b) Edelstein, J., Korpela, E. J., Adolfo, J., et al. 2006b, ApJ, 644, L159
- Elmegreen (1975) Elmegreen, B. G. 1975, ApJ, 198, L31.
- Ferguson et al. (1996) Ferguson, A. M. N., Wyse, R. F. G., Gallagher, J. S. III, Hunter, D. A. 1996, AJ, 111, 2265
- Finkbeiner (2003) Finkbeiner, D. P. 2003, ApJS, 146, 407
- Gold et al. (2011) Gold, B., Odegard, N., Weiland, J. L., et al. 2011, ApJS, 192, 15
- Górski et al. (2005) Górski, K. M., Hivon, E., Banday, A. J., et al. 2005, ApJ, 622, 759
- Han et al. (2010) Han, W., Lee, D.-H., Park, Y., et al. 2010, Proc. of SPIE, 7731, 77311W
- Haffner et al. (1999) Haffner, L. M., Reynolds, R. J., & Tufte, S. L. 1999, ApJ, 523, 223
- Haffner et al. (2009) Haffner, L. M. 2009, Rev. of Mod. Phys., 81, 696
- Heiles et al. (2000) Heiles, C., Haffner, L. M., Reynolds, R. J., & Tufte, S. L. 2000, ApJ, 536, 335
- Henry (2002) Henry, R. C. 2002, ApJ, 570, 697
- Hill et al. (2008) Hill, A. S., Benjamin, R. A., Kowal, G., et al. 2008, ApJ, 686, 363
- Hoopes & Walterbos (2000) Hoopes, C. G., & Walterbos, R. A. M. 2000, ApJ, 541, 597
- Hoopes et al. (2001) Hoopes, C. G., Walterbos, R. A. M., & Bothun, G. D. 2001, ApJ, 559, 878
- Hoopes & Walterbos (2003) Hoopes, C. G., & Walterbos, R. A. M. 2003, ApJ, 586, 902
- Jura (1979) Jura, M. 1979, ApJ, 227, 798
- Kalberla et al. (2005) Kalberla, P. M. W., Burton, W. B., Hartmann, D., et al. 2005, A&A, 440, 775
- Kulkarni & Heiles (1987) Kulkarni, S. R., and C. Heiles, 1987, “The atomic component,” in Interstellar Processes, edited by D. J. Hollenbach and H. A. Thronson, Jr., Vol. 134 of Astrophysics and Space Science Library (Reidel, Dordrecht, pp. 87–122.
- Kutyrev et al. (2001) Kutyrev, A. S., Bennett, C. L., Moseley, S. H., Reynolds, R. J., & Roesler, F. 2001, Tetons 4: Galactic Structure, Stars, & the Interstellar Medium, eds. C. E. Woodward, M. D. Bicay, and J. M. Shull 360
- Kutyrev et al. (2004) Kutyrev, A. S., Bennett, C. L., Moseley, S. H., Reynolds, R. J., & Roesler, F. 2004, How Does the Galaxy Work?, eds. E. J. Alfraro et al. 79
- Lee et al. (2008) Lee, D.-H., Seon, K.-I., Min, K.-W., et al. 2008, ApJ, 686, 1155
- Lehtinen et al. (2010) Lehtinen, K., M. Juvela, M., & Mattila, K. 2010, A&A, 517, A79
- Madsen et al. (2006) Madsen, G. J., Reynolds, R. J., & Haffner, L. M. 2006, ApJ, 652, 401
- Massey et al. (1995) Massey, P., Lang, C. C., DeGioia-Eastwood, K., & Garmany, C. D. 1995, ApJ, 438, 188
- Mathis (1986) Mathis, J. S. 1986, ApJ, 301, 423
- Mattila et al. (2007) Mattila, K., Juvela, M., & Lehtinen, K. 2007, ApJ, 654, L131
- Miller & Cox (1993) Miller, W. W., III, & Cox, D. P. 1993, ApJ, 417, 579
- O’Dell et al. (2011) O’Dell, C. R., Ferland, G. J., Porter, R. L., & van Hoof, P. A. M. 2011, ApJ, 733, 9
- O’Dell & Goss (2009) O’Dell, C. R., & Goss, W. M. 2009, AJ, 138, 1235
- O’Dell & Harris (2010) O’Dell, C. R., & Harris, J. A. 2010, AJ, 140, 985
- Peterson & Webber (2002) Peterson, J. P, & Webber, W. R. 2002, ApJ, 575, 217
- Raymond (1992) Raymond, J. C. 1992, ApJ, 384, 502
- Reynolds (1984) Reynolds, R. J. 1984, ApJ, 282, 191
- Reynolds (1988) Reynolds, R. J. 1988, ApJ, 333, 341
- Reynolds (1990a) Reynolds, R. J. 1990a, ApJ, 349, L17
- Reynolds (1990b) Reynolds, R. J. 1990b, in IAU Symp. 139, The Galactic and Extragalactic Background Radiation, ed. S. Bowyer & C. Leinert (Dordrecht : Kluwer), 157
- Reynolds (1991) Reynolds, R. J. 1991, ApJ, 372, L17
- Reynolds & Cox (1992) Reynolds, R. J., & Cox, D. P. 1992, ApJ, 400, L33
- Reynolds & Tufte (1995) Reynolds, R. J., & Tufte, S. L. 1995, ApJ, 439, L17
- Reynolds et al. (1998) Reynolds, R. J., Hausen, N. R., Tufte, S. L., & Haffner, L. M. 1998, ApJ, 494, L99
- Reynolds et al. (1999) Reynolds, R. J., Haffner, L. M., & Tufte, S. L. 1999, ApJ, 525, L21
- Reynolds et al. (2001) Reynolds, R. J., Sterling, N. C., Haffner, L. M., & Tufte, S. L. 2001, ApJ, 548, L221
- Shapiro & Benjamin (1993) Shapiro, P. R., & Benjamin, R. A. 1993, in Star Formation, Galaxies, and the Interstellar Medium, ed. J. Franco, F. Ferrini & G. Tenorio-Tagle (Cambridge Univ. Press), p. 275
- Schlegel et al. (1998) Schlegel, D. J., Finkbeiner, D. P., & Davis, M. 1998, ApJ, 500, 525
- Schiminovich et al. (2001) Schiminovich, D., Friedman, P. G., Martin, C., & Morrissey, P. F. 2001, ApJ, 563, L161
- Sembach et al. (2000) Sembach, K. R., Howk, J. C., Ryans, R. S. I., & Keenan, F. P. 2000, ApJ, 528, 310
- Seon (2006) Seon, K.-I. 2006, J. Korean Phys. Soc., 48, L331 (arXiv:0703168)
- Seon (2009a) Seon, K.-I. 2009a, ApJ, 703, 1159
- Seon (2009b) Seon, K.-I. 2009b, Pub. of Korean Astron. Soc., 24, 1
- Seon et al. (2011) Seon, K.-I., Edelstein, J., Korpela, E. J., et al. 2011, ApJS, 196, 15
- Slavin et al. (1993) Slavin, J. D., Shull, J. M., & Begelman, M. C. 1993, ApJ, 407, 83
- Straižys & Kuriliene (1981) Straižys, V., & Kuriliene, G. 1981, Ap&SS, 80, 353
- Terzian (1974) Terzian, Y. 1974, ApJ, 193, 93
- Torres-Peimbert et al. (1974) Torres-Peimbert, S., Lazcano-Araujo, A., & Peimbert, M. 1974, ApJ, 191, 401
- Vacca et al. (1996) Vacca, W. D., Gramany, C. D., & Shull, J. M. 1996, ApJ, 460, 914
- van de Hulst & de Jong (1969) van de Hulst, H. C., & de Jong, T. 1969, Physica, 41, 151
- Verner & Yakovlev (1995) Verner, D. A., & Yakovlev, D. G. 1995, A&AS, 109, 125
- Weingartner & Draine (2001) Weingartner, J. C., Draine, B. T., 2001, ApJ, 548, 296
- Witt et al. (1997) Witt, A. N., Friedmann, B. C., & Sasseen, T. P. 1997, ApJ, 481, 809
- Witt et al. (2010) Witt, A. N., Gold, B., Barnes, F. S., III, DeRoo, C. T., & Vijh, U. P. 2010, ApJ, 724, 1151
- Wood & Reynolds (1999) Wood, K., & Reynolds, R. J. 1999, ApJ, 525, 799
- Wood et al. (2010) Wood, K., Hill, A. S., Joung, M. R., et al. 2010, ApJ, 721, 1397