2D simulations of the double-detonation model for thermonuclear transients from low-mass carbon–oxygen white dwarfs
Abstract
Thermonuclear explosions may arise in binary star systems in which a carbon–oxygen (CO) white dwarf (WD) accretes helium-rich material from a companion star. If the accretion rate allows a sufficiently large mass of helium to accumulate prior to ignition of nuclear burning, the helium surface layer may detonate, giving rise to an astrophysical transient. Detonation of the accreted helium layer generates shock waves that propagate into the underlying CO WD. This might directly ignite a detonation of the CO WD at its surface (an edge-lit secondary detonation) or compress the core of the WD sufficiently to trigger a CO detonation near the centre. If either of these ignition mechanisms works, the two detonations (helium and CO) can then release sufficient energy to completely unbind the WD. These “double-detonation” scenarios for thermonuclear explosion of WDs have previously been investigated as a potential channel for the production of type Ia supernovae from WDs of around one solar mass. Here we extend our 2D studies of the double-detonation model to significantly less massive CO WDs, the explosion of which could produce fainter, more rapidly evolving transients. We investigate the feasibility of triggering a secondary core detonation by shock convergence in low-mass CO WDs and the observable consequences of such a detonation. Our results suggest that core detonation is probable, even for the lowest CO core masses that are likely to be realized in nature. To quantify the observable signatures of core detonation, we compute spectra and light curves for models in which either an edge-lit or compression-triggered CO detonation is assumed to occur. We compare these to synthetic observables for models in which no CO detonation was allowed to occur. If significant shock compression of the CO WD occurs prior to detonation, explosion of the CO WD can produce a sufficiently large mass of radioactive iron-group nuclei to significantly affect the light curves. In particular, this can lead to relatively slow post-maximum decline. If the secondary detonation is edge-lit, however, the CO WD explosion primarily yields intermediate-mass elements that affect the observables more subtly. In this case, near-infrared observations and detailed spectroscopic analysis would be needed to determine whether a core detonation occurred. We comment on the implications of our results for understanding peculiar astrophysical transients including SN 2002bj, SN 2010X and SN 2005E.
keywords:
hydrodynamics – radiative transfer – methods: numerical – binaries: close – supernovae: general – white dwarfs1 Introduction
Type Ia supernovae (SNe Ia) are understood to result from the thermonuclear disruption of a carbon–oxygen (CO) white dwarf (WD) star (e.g. Hillebrandt & Niemeyer, 2000). One possible mechanism for igniting such an explosion can occur in binary systems in which a primary CO WD accretes He-rich material from a donor star. When a sufficiently large surface He layer is accreted, it is expected to ignite explosively leading to detonation of the accreted He layer (see e.g. Nomoto, 1980, 1982; Woosley et al., 1980; Woosley & Weaver, 1994). Detonation of the He layer can then lead to a secondary detonation of the core, either by directly igniting the CO fuel near to the interface with the overlying He layer (see e.g. Nomoto, 1982; Livne & Glasner, 1990) or due to compressional heating of the core by inward propagating shocks (see e.g. Livne, 1990). The consequence of this “double-detonation” model is the incineration of the CO WD and its He-rich outer layer, leading to an explosion in which the primary star is completely destroyed.
However, the question of whether the secondary detonation forms is challenging owing to the wide range of relevant length-scales that must be resolved if it is to be simulated (Seitenzahl et al., 2009a, b). To date only a few multi-dimensional studies have been made of the double-detonation scenario for a handful of progenitor models (Livne & Glasner, 1990; Dgani & Livio, 1990; Livne & Glasner, 1991; Livne & Arnett, 1995; Benz, 1997; García-Senz et al., 1999; Forcada et al., 2006; Forcada, 2007; Fink et al., 2007; Fink et al., 2010). If the secondary core detonation does not occur, the result of He ignition is quite different from the double-detonation SN Ia model – as described by Bildsten et al. (2007) and Shen & Bildsten (2009), explosive burning of an accreted He-layer alone will lead to a thermonuclear transient that is roughly ten times fainter and evolves significantly faster than a SN Ia. Dubbed “point-Ia” (hereafter p-Ia), this class of explosion is readily accessible to observation by the current generation of transient surveys (e.g. the Panoramic Survey Telescope & Rapid Response System [Pan-STARRS]***http://pan-starrs.ifa.hawaii.edu, the Palomar Transient Factory [PTF]†††http://www.astro.caltech.edu/ptf and planned wide-field surveys by instruments such as SkyMapper [Keller et al. 2007] and the Large Synoptic Survey Telescope [LSST Science Collaboration 2009]). Indeed, transient events with some similarities to the predicted properties of p-Ia explosions have already been reported and modelled in the context of the p-Ia scenario (e.g. Foley et al., 2009; Perets et al., 2010; Poznanski et al., 2010; Kasliwal et al., 2010; Waldman et al., 2011; Sullivan et al., 2011). It is to be expected that other similar events will be found and studied in the near future.
In our previous studies (Fink et al., 2010; Kromer et al., 2010), we investigated the double-detonation scenario for systems with fairly massive CO cores ( M⊙). Such cases are the most promising for yielding thermonuclear explosions as bright as normal SNe Ia. In those works, we focused on the possibility of core detonation triggered by converging shocks deep in the CO WD. We found that secondary core detonation was very likely in all of the models we considered (Fink et al., 2010). This implies that the p-Ia scenario should not be realised following He detonation in such systems unless some additional effect comes into play (see Section 6.1). We now wish to extend our 2D studies of the double-detonation scenario to investigate systems with less massive CO cores (e.g. M⊙) and quantify the observable properties of double detonations for such systems. Compared to their more massive counterparts, these low-mass systems have two important differences. First, prior to any explosion, the central density of the CO core will be lower. In principle, this might make it harder for the converging shocks to compress the centre sufficiently for a core detonation to occur. Previous 2D studies have already suggested that secondary detonations can be produced for CO cores with masses as low as 0.55 M⊙ (Livne & Arnett, 1995). Thus the first objective of our study is to extend our studies to even lower mass, around the minimum CO core mass that is expected to be realized in nature (in the recent binary synthesis calculations of Ruiter et al. 2011, the lowest CO core mass is M⊙). Second, even if a core detonation does occur, the low core density means it will produce little 56Ni (see e.g. the lowest mass model of Livne & Arnett, 1995, which yields only 0.14 M⊙ of 56Ni). In the limit of a very low 56Ni-yield in the core, the radioactive products produced in the He-detonation may still play a dominant role in determining the explosion brightness and light curve evolution (as in the p-Ia scenario). Our second goal, therefore, will be to quantify the observable properties of explosions in which the core detonates but produces only a small mass ( M⊙) of 56Ni.
We begin, in Section 2, by introducing the models adopted for this study and the suite of numerical simulations used to study them. In Section 3 we describe our simulations in which we investigate shock convergence and detonation in low mass CO cores. We then present the results of alternative explosion simulations (in which either an edge-lit CO core detonation is assumed or in which it is assumed that no core detonation occurs; see Section 4). In Section 5 we present the synthetic observables computed for all our simulations before discussing our results and drawing conclusions in Section 6.
2 Methods
For this study we have performed sets of 2D numerical simulations that follow the explosion dynamics, nucleosynthesis and radiation transport of different explosions for two specific initial systems. Here we describe the parameters of the initial systems and the means by which the numerical simulations were performed.
2.1 Initial models
As initial conditions for our explosion simulations, we adopt models describing the state of the system immediately prior to He detonation. These are not based on evolutionary/accretion calculations (cf. Woosley & Weaver, 1994; Woosley & Kasen, 2011) but are idealized representations of low-mass CO WDs that have accreted a surface layer of He. Thus, in this work, it is an assumption that the system has evolved to reach conditions for He detonation – we only determine whether subsequent detonation of the CO core is probable and quantify its observable consequences.
We have considered two sets of system parameters, which are described below. Population synthesis calculations suggest that He-rich accretion by CO WDs leading to helium shell detonation most commonly occurs in binaries containing a CO WD primary and a He WD donor (e.g. Ruiter et al., 2011)‡‡‡Note, however, that the Ruiter et al. (2011) calculations assumed explosions occurred once a 0.1 M⊙ layer of He builds up; the systems we discuss here require additional He accretion beyond that point.. However, that channel is not predicted to yield significant numbers of systems with very low CO mass (M⊙). For the CO masses we consider a non-degenerate He star companion is more probable (see figure 3 of Ruiter et al., 2011). The evolutionary path to a low-mass CO WD accreting from a He star involves one or more stable mass-transfer episodes and at least one common envelope phase leading to a tight binary ( hr orbital period). Compared to binaries with He WD donors, systems that evolve to a final state involving a CO WD and a He star donor are rarer and the evolutionary timescale is usually relatively short ( Gy; Ruiter et al. 2011). Nevertheless, the He-star donor scenario is likely to be the most promising route to the low CO mass explosions that we will discuss.
For our standard system (hereafter “S” model), we adopted a CO core mass of M⊙ and a mass for the accreted He layer of M⊙, yielding a total mass of M⊙. Here, is close to the minimum mass for detonation suggested by Bildsten et al. (2007) and Shen & Bildsten (2009) for our chosen value of . This model naturally extends the study of Fink et al. (2010) into the regime of physically plausible low-mass systems that might be realised in systems where a primary CO WD accretes from a He-burning star (see Section 6.4). Its masses are very similar to the least massive models considered in the studies of Woosley & Weaver (1994), Livne & Arnett (1995) and Shen et al. (2010), and also to model CO.55HE.2 of Waldman et al. (2011).
As a second case, we also considered an extremely low-mass system. This model (hereafter model “L”) is designed to robustly bracket the low-mass end of the distribution of potential initial systems. The adopted CO core mass ( M⊙) lies at the lower boundary of the distribution in the population synthesis calculations of Ruiter et al. (2011). We have also adopted a very low mass ( M⊙) for the He layer when the explosion occurs. This is close to the most optimistic (i.e. lowest) estimate for the mass of He needed for detonation, following the arguments of Shen & Bildsten (2009)§§§From figure 5 of Shen & Bildsten (2009), a minimum He-layer mass of M⊙ (for M⊙) is required, if one adopts the condition that the dynamical timescale is one tenth of the local heating timescale when dynamical burning sets in.. Moreover, the evolutionary models of Woosley & Kasen (2011) imply that the conditions suggested by Shen & Bildsten (2009) lead to He layer masses that are generally too small for detonation. Thus, our L-model likely lies outside the regime in which He detonation is probable. However, we include it as an important numerical experiment to test the limit of the double-detonation model – if He detonation in this system leads to CO core detonation, then it can be concluded that our method would predict secondary detonation for any combination of CO-core/He-layer mass for which He detonation is realistic. Our L-model is similar to the lowest mass model considered by Waldman et al. (2011) (CO.45HE.2).
The initial models are set up in exactly the same manner as the models described by Fink et al. (2010) by choosing appropriate values for the temperature and central density of the CO core (), and the temperature and density at the base of the He layer (). These parameters are listed in Table 1.
In our S-model we aimed at achieving a bright explosion and therefore assumed a cold shell (i.e. as dense as possible for a given mass). For degenerate matter, the exact value of does not matter. Thus, we simply assumed a constant temperature K in the whole WD. Following Shen & Bildsten (2009) and Waldman et al. (2011), we adopted higher temperatures for our L-model ( K in the core and K at the base of the shell, decreasing adiabatically outwards). Higher temperatures reduce the density, leading to less complete burning and making it harder to trigger a secondary core detonation. Thus, this choice maintains the status of our L-model as a fairly extreme test for the plausibility of secondary detonation by shock compression.
For simplicity, the core is assumed to consist of uniformly mixed 12C and 16O (equal parts by mass) and the surface layer is assumed to be pure He. Following Fink et al. (2010), the density profile within the model is constructed by solving for hydrostatic equilibrium conditions with the adopted value of , , and using the same equation of state adopted by Fink et al. (2007); Fink et al. (2010).
| Parameter | Model S | Model L |
|---|---|---|
| (K) | ||
| ( g cm-3) | 8.5 | 3.81 |
| (K) | ||
| ( g cm-3) | 1.3 | 0.592 |
| a () | 0.58 | 0.45 |
| a () | 0.21 | 0.21 |
| a () | 0.79 | 0.66 |
a Note that the masses are not independent parameters but follow from , , and and the assumption of hydrostatic equilibrium (see Fink et al. 2010).
2.2 Explosion simulations, nucleosynthesis and radiation transport
In most respects, our simulations were performed in the same way as those described by Fink et al. (2010). Therefore, we will only summarise the main points and highlight the small number of modifications to the numerical implementation adopted.
All the simulations presented here were carried out in 2D with rotational symmetry about the -axis. As in Fink et al. (2010), we begin by igniting a detonation at a single point in the He layer. As noted in Section 2.1, that such a He detonation ignites is a fundamental assumption of our simulations. In all cases, we choose to ignite the He detonation at the base of the He layer on the positive -axis. In the absence of evolutionary calculations prior to explosion, this is the simplest choice for He ignition but we note that it is disfavourable for edge-lit secondary detonations (see Section 4.2).
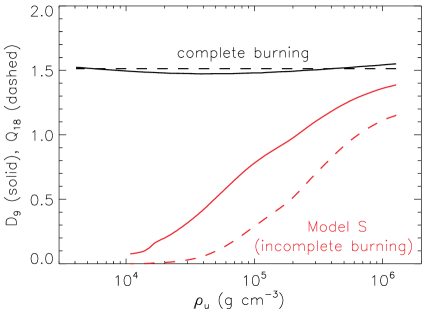
As in Fink et al. (2010), detonations in CO and He were modelled with a front tracking scheme using tabulated values for both detonation speeds () and energy release per unit mass () behind the burning front (hereafter referred to as “detonation tables”). Since it takes place entirely in a low-density incomplete burning regime, the He detonation nucleosynthesis is very sensitive to the input parameters of the front-tracking scheme. The detonation tables were therefore determined for each model of this work by applying the hydrodynamics/post-processing iteration scheme described in the appendix of Fink et al. (2010). This time, however, the setup in the calibration runs was identical to that of the models, i.e., a detonation propagating laterally through the same He layers. To calibrate the He-detonation speed, the Rankine-Hugoniot jump conditions for detonations were solved for the minimum possible value of , which corresponds to the flow velocity of the final ash state being exactly sonic relative to the front. This procedure was repeated for every point on the tabulated grid of density values. In the calculations we use the same equation of state as in the hydrodynamics code and the energy release from the previous iteration step. This procedure leads to converged detonation speeds after around six iteration steps. The final detonation tables for our standard (“S”) model are illustrated in Figure 1. It can be seen that complete He burning is never achieved for the densities present in the model and that this substantially reduces the detonation speed at low densities, compared to the complete burning case.
Unlike in the models of Fink et al. (2010), we suppressed any volume burning in the He layer before the arrival of the detonation wave. This provides a well-defined initial condition in the He layer (allowing the composition to change due to volume burning prior to detonation would not be self-consistent as we do not simulate the evolution of the progenitor before the initiation of the He detonation).
We performed detailed nucleosynthesis calculations for the explosion models using a tracer particle method (Travaglio et al., 2004). Here, tracer particles are passively advected in the hydrodynamical simulation and used to record the thermodynamic trajectories of mass elements. These are then used as input to a post-processing step in which detailed isotopic yields are obtained from calculations with an extensive nucleosynthesis network (384 species). We adopted an updated version of the REACLIB reaction rate library (Rauscher & Thielemann, 2000, updated 2009) and a refined method with variable tracer masses (Seitenzahl et al., 2010) was applied. Variable tracer masses allow for a better spatial resolution at the edge of the CO core.
The nucleosynthesis tracer particles are used to reconstruct the detailed abundances throughout the ejecta. This gives a complete, 2D model for the structure of the ejecta at the final time of the hydrodynamical simulations (i.e. density and composition as functions of expansion velocity in the - and -directions). We then used the artis code (Sim, 2007; Kromer & Sim, 2009) to compute synthetic light curves and spectra for the models. For all the radiative transfer simulations we used our set of atomic data extracted from CD23 of Kurucz & Bell (1995) (see Kromer & Sim 2009), but we expanded the range of ions included to i – vii for elements with atomic number to allow for higher ionization states that may be present at early times when the ejecta are hot.
3 Secondary detonation by converging shocks; CSDD models
Our first simulations are the most similar to those described by Fink et al. (2010) – they study the shock convergence and potential for formation of a secondary detonation via compression of the CO core in less-massive systems. We investigate this scenario for both our initial systems (S and L, see above).
As in Fink et al. (2010), we simulate the propagation of the He detonation as it wraps around the CO core. The He detonation drives a shock front that propagates into the core leading to strong compression around a convergence point. Although the convergence point is off-centre in both models, it is less off-centre than in the models of Fink et al. (2010). This is a continuation of the trend for ignition closer to centre in less massive cores (see table 2 of Fink et al. 2010).
Our first question is whether this compression leads to a large enough volume of sufficiently hot and dense material that a secondary CO detonation could ignite. To assess this we compared the density and temperature reached in our simulation to critical temperatures and densities for detonation from Niemeyer & Woosley (1997) and Röpke et al. (2007)¶¶¶Note that for the high densities reached in the shock convergence region, the critical volume for initiation of a detonation is small compared to our grid resolution (see table 1 of Fink et al., 2007). Therefore only temperature and density can be considered as detonation criteria in this case.. From this comparison (see Table 2), we find that critical conditions for CO core detonation are robustly met in the simulation for both our initial systems – in fact, the peak temperatures and densities are very similar to those of models 1 and 2 of Fink et al. (2010), implying that core detonation is not significantly harder to achieve in the systems we consider here. Given the extreme properties of our model L, we therefore conclude that 2D converging shock simulations performed with our current approach will favour secondary core detonations for any physically plausible pair of CO core/He-layer mass. To study this further would require much higher resolution simulations that resolve the critical volumes for detonation.
| Parameter | Model S | Model L |
|---|---|---|
| (s) | 1.34 | 1.81 |
| ( cm) | ||
| 0.31 | 0.31 | |
| ( K) | 6.44 | 4.68 |
| ( g cm-3) | 18.0 | 7.83 |
| ( cm) | 3.71 | 4.94 |
Since our simulations of the shock convergence suggests that a detonation in the CO core is likely, we initiate a second detonation wave at the location of the hot spot in the CO core. This detonation sweeps over the whole CO core and releases sufficient energy to completely unbind the star. Hereafter, we will refer to the results of these simulations as our converging-shock double-detonation (CSDD) models (CSDD-S and CSDD-L for our two initial systems, respectively).
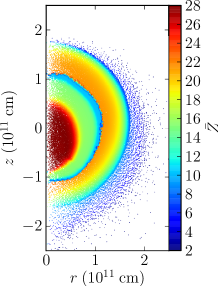
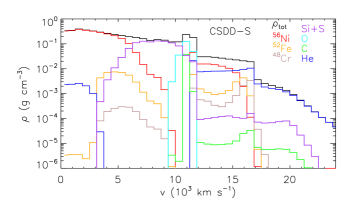
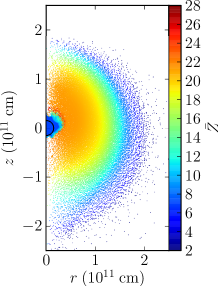
The mass yields obtained from the nucleosynthesis post-processing of the CSDD models are tabulated in Table 3. The ejecta composition of model CSDD-S is illustrated in the top panels of Figure 2, which shows both the 2D distribution of mean atomic number and the detailed composition for a slice through the equatorial plane of the model.
| CSDD-S | ELDD-S | HeD-S | CSDD-L | ELDD-L | HeD-L | ||
|---|---|---|---|---|---|---|---|
| He-layer ejecta | 56Ni (M⊙) | ||||||
| composition | 52Fe (M⊙) | ||||||
| 48Cr (M⊙) | |||||||
| Ti (M⊙) | |||||||
| Ca (M⊙) | |||||||
| S (M⊙) | |||||||
| Si (M⊙) | |||||||
| Mg (M⊙) | |||||||
| O (M⊙) | |||||||
| C (M⊙) | |||||||
| He (M⊙) | |||||||
| CO core ejecta | 56Ni (M⊙) | – | – | ||||
| composition | 52Fe (M⊙) | – | – | ||||
| 48Cr (M⊙) | – | – | |||||
| Ti (M⊙) | – | – | |||||
| Ca (M⊙) | – | ||||||
| S (M⊙) | |||||||
| Si (M⊙) | |||||||
| Mg (M⊙) | |||||||
| O (M⊙) | |||||||
| C (M⊙) | |||||||
| He (M⊙) | – | – | – | – |
For our CSDD-S model, a significant mass of radioactive nuclei (specifically M⊙ of 56Ni and 52Fe) is produced by the detonation of the He layer. This yield of radioactive nuclei is similar to that found by Shen et al. (2010) and Waldman et al. (2011) for models with comparable values of (specifically, our pattern of radioactive yields lies between those of Shen et al. 2010 for detonations of 0.2 and 0.3 M⊙ He-layers around 0.6 M⊙ CO cores). The decay of this material will power the early phases of the light curve and produce a transient that brightens rapidly, on a timescale of several days, as predicted by Bildsten et al. (2007) (see Section 5). In our model, however, the shock compression is sufficient to yield an even larger mass of 56Ni ( M⊙) from the core detonation. As in double-detonation models for more massive CO WDs (e.g. Woosley & Weaver, 1994; Livne & Arnett, 1995; Fink et al., 2007; Woosley & Kasen, 2011), this 56Ni is concentrated at low velocities and surrounded by an envelope of intermediate mass elements, predominantly silicon and sulphur (see Figure 2). Since this centrally concentrated 56Ni is enshrouded by a much larger mass envelope than the 56Ni from the He-detonation, the outwards diffusion time will be longer. Thus the light curve will evolve on longer timescales than for the p-Ia events predicted by Bildsten et al. (2007), Shen & Bildsten (2009) and Shen et al. (2010); see Section 5.
Qualitatively similar results are found for our CSDD-L model. In this case, 48Cr is the dominant radioactive product from burning of the He layer. Also, the low density of the CO core means that the 56Ni mass produced in the core detonation is now smaller than the mass of radioactive elements produced in the He-shell. Nevertheless, the core 56Ni mass is not negligible and affects the synthetic observables, as will be discussed in Section 5.
4 Additional models
For comparison of the results obtained with our CSDD models, we have performed additional simulations to quantify the observable properties of alternative explosion mechanisms. These were set up and carried out in an identical manner except that the detonation of the CO core was handled differently.
4.1 He detonation only; HeD models
Although the simulations described in Section 3 suggest that detonation of the surrounding He layer will trigger a secondary detonation of the core, the difficulty in determining whether a detonation is initiated must be recognized (e.g. Seitenzahl et al., 2009b, see also Section 6.1). Therefore, as an experiment, we also performed calculations in which it is assumed that no core detonation is ignited (hereafter, our HeD models, which were carried out for both our S and L initial systems). These models are an important comparison point since they are the realisations of the Bildsten et al. (2007) p-Ia explosion scenario that correspond to our CSDD models.
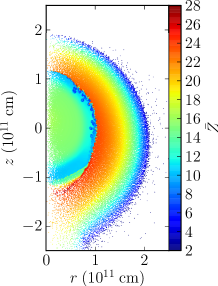
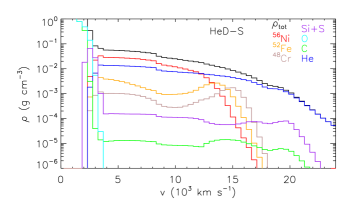
For these simulations, the He detonation was ignited exactly as before and produces very similar nucleosynthetic yields to the He layer in the CSDD model (Table 3). Since it is assumed that no core detonation takes place, most of the underlying CO core is unaffected by the He detonation and remains tightly bound∥∥∥We note, however, that even in this case the heating in the shock convergence leads to burning a small fraction of the mass to 56Ni ( M⊙ for our S-model) and intermediate-mass elements ( M⊙).. This bound material is not included in our radiative transfer simulations, which involve only the homologously expanding ejecta. However, part of the CO core ( M⊙ for HeD-S and 0.029 M⊙ for HeD-L) is unbound as a result of kinetic energy transferred from the He detonation to material of the CO core (see also Woosley et al., 1986). Therefore, some material from the core is still present in the ejecta and dominates the composition at low velocities (see lower right panel of Figure 2).
4.2 Edge-lit core detonation; ELDD
An alternative to the CSDD model is that the He detonation directly ignites an inward propagating detonation at the edge of the CO core. Whether such a detonation can be ignited depends on many factors including the density at the edge of the CO core (), the composition and the geometry. 1D simulations have suggested that it is most likely to happen if the ignition point is some way above the base of the He-shell (see e.g. Nomoto, 1982; Livne, 1990; Benz, 1997; García-Senz et al., 1999). Edge-lit detonation has been found in some multi-dimensional simulations (e.g. Livne & Glasner, 1991) although it may be harder when the 1D symmetry is broken (Forcada, 2007).
Edge-lit CO detonation requires that densities of at least g cm-3 and critical temperatures of several billion Kelvin are reached in the outer CO material (Röpke et al., 2007). In the simulations for our S-model, we do find that some regions at the very edge of the CO core are heated to temperatures K and that densities in excess of g cm-3 are reached in some places (particularly close to the He detonation convergence point on the -axis). However, these hot/dense conditions appear in only a handful of our nucleosynthesis tracer particles and it is therefore marginal whether critical volumes for detonation are really reached. Moreover, since our models are not based on evolutionary calculations, we cannot predict at what height in the He-layer ignition of the detonation is most likely to occur – we have simply chosen to ignite our He detonations at the base of our He layers. Thus, our simulations are ill-suited to determine whether edge-lit detonation is probable in our particular systems.
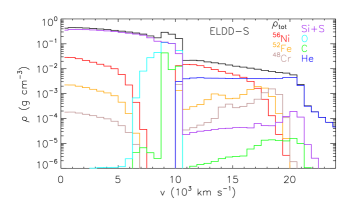
Nevertheless, we can investigate the observable consequences if such an edge-lit detonation were to occur – to do this we performed simulations in which a CO detonation was ignited by hand at the edge of the core immediately below the ignition point of the He detonation. The two detonations were ignited simultaneously but modelled independently. We will refer to the results of these simulation as our edge-lit double-detonation models (ELDD-S and ELDD-L, for our two initial systems, respectively). The important difference from the CSDD models is that there is no strong shock convergence in the core prior to ignition of the CO detonation. This means that the densities in the core remain close to their initial values, which are too low to lead to significant 56Ni production in the core. Thus, although sufficient energy is released to unbind the core, the core is primarily burned to intermediate mass elements (see Table 3 and Figure 2). In addition, these models have slightly more complete burning of the He shell material, a consequence of additional heating of the burning region just behind the He detonation by oblique shocks generated from the CO detonation.
5 Synthetic observables
5.1 Light curve morphology
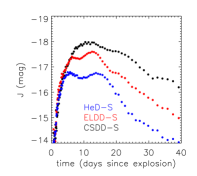
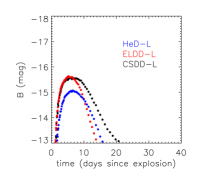
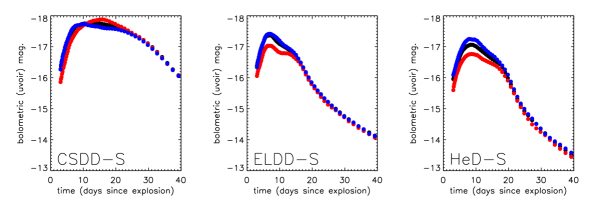
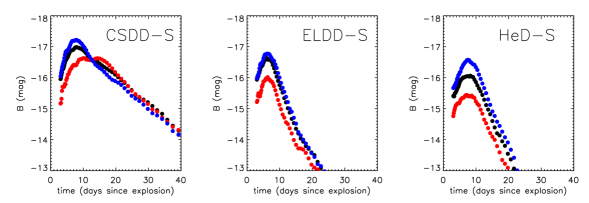
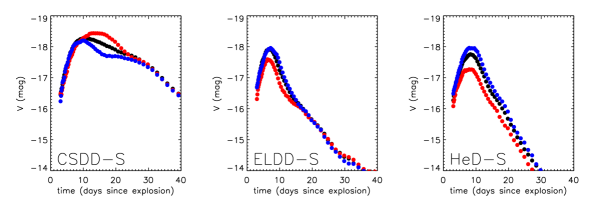
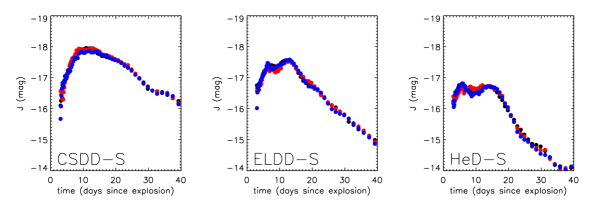
Figures 3 and 4 show synthetic bolometric (ultraviolet–optical–infrared; hereafter UVOIR), optical- and infrared-band light curves computed for the three explosion mechanisms (CSDD, ELDD, HeD) for our two model systems (S and L, respectively). Here, we show the angle-average synthetic light curves – the dependence of the light curve properties on observer inclination will be discussed briefly in Section 5.3.
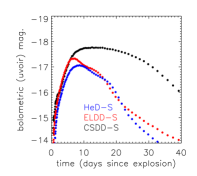
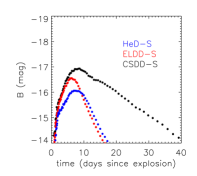
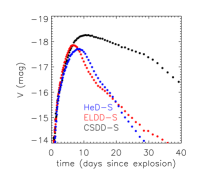
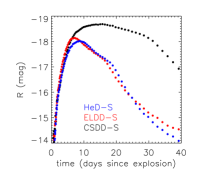
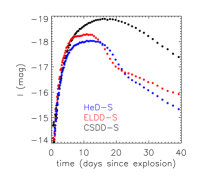
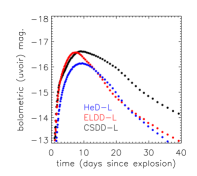
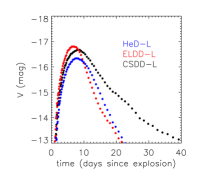
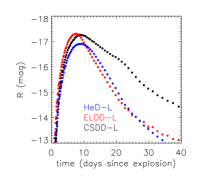
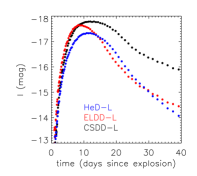
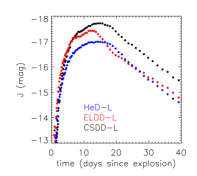
It is apparent from Figure 3 that the CSDD scenario leads to a very different transient from a p-Ia model (i.e. the HeD model) for our S-model. In agreement with the calculations for p-Ia models by Shen et al. (2010), our HeD-S bolometric light curve reaches peak around 8 days after explosion and then decays fairly rapidly, dropping by mag during a two-week period after maximum. In contrast, the CSDD-S model takes several days longer to reach peak and remains bright for an extended period – significant bolometric decline does not commence until days after explosion. The luminosity of the CSDD-S model is always higher than the HeD-S model. Similar conclusions are drawn from our low-mass model (compare CSDD-L and HeD-L in Figure 4). Here the scale of the effect is less extreme but the slower light curve evolution is still very apparent in the optical bands.
These differences can be understood as consequences of 56Ni-rich material produced in the core detonation (see Table 3). Decay of 56Ni in the core produces a comparable amount of energy to that supplied by decay of radioactive nuclei in the outer layer of He-burning products. Moreover, the 56Ni in the core is deep inside the ejecta meaning that this energy takes longer to diffuse outward and -ray trapping is more effective for a longer period of time. This causes the slow light curve evolution. The scale of these effects is large and easily observable, corresponding to differences in excess of a magnitude in most bands at post-maximum epochs for our S-model.
The influence of the core material in the ELDD models is considerably more subtle. From about 8 days after explosion, the ELDD-S bolometric and optical light curves are much more similar to the HeD-S than CSDD-S light curves. This is because the ELDD-S light curve is predominantly powered by the radioactive nuclei produced in the He detonation; the small mass of 56Ni in the core of the ELDD-S model only becomes a noticeable energy source well after maximum light (at times greater than days after explosion, the ELDD-S optical band light curves are systematically brighter than those of the HeD-S model). Compared to the HeD-S model, the ELDD-S light curves reach peak slightly earlier (and are a few tenths of a magnitude brighter at peak). This follows from the different velocity distribution of the products of He burning in these models. In the ELDD-S model, the He-layer ashes have all been pushed out to relatively high velocity by the underlying core material (see Figure 2). Consequently, the outward column density from the surface layer of 56Ni and 52Fe is smaller in the ELDD-S model, leading to earlier -ray escape and downturn of the UVOIR light curves. This effect, however, is relatively modest in scale: overall the optical band ELDD-S light curves are not very different from those of the HeD-S model. Similar conclusions can be drawn by comparing the HeD-L and ELDD-L optical band light curves in Figure 4.
An important difference between ELDD and HeD light curves manifests in the near-infrared (e.g. the -band for our S-model shown in Figure 3). In the near-infrared, a significant fraction of the emission in both the CSDD and ELDD models is provided by the intermediate-mass elements in the relatively cool and dense ejecta from the CO core, particularly around maximum light for the CSDD-S and ELDD-S simulations. This emission from the core is powered by a combination of energy injected by the radioactive material in the core ejecta (significant for the CSDD-S model) and irradiation by the overlying He-shell ejecta – around maximum light, re-radiation of energy originating from the He-detonation ash is the dominant source of NIR emission for the ELDD-S simulation. Since only a very small mass of material was unbound from the CO core in our HeD models, these processes are largely absent in the HeD models, making them fainter at these wavelengths******Although the remnant CO WD will remain in the centre of the ejecta, it is expected to be too small to intercept a significant fraction of the radiation created in the rapidly expanding He detonation ash. Therefore, in contrast to the core ejecta in the CSDD and ELDD models, the WD is not expected to provide an effective target for re-radiating a significant fraction of the emission around maximum light.. Thus, near-infrared data could be particularly valuable when hunting for direct observable signatures of the core detonation.
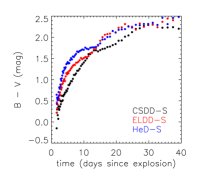
5.2 Colours and spectra
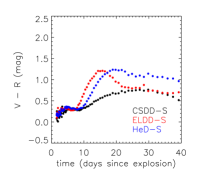
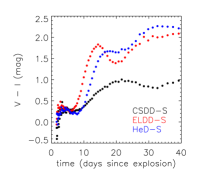
Maximum light colours only weakly discriminate between our models. In all cases, , and are positive around maximum light (see Figure 5 for our S-model results) and differ by at most a few tenths of a magnitude between the explosion scenarios.
After maximum light, the colour rapidly becomes more positive because of the decline in -band for all models. Evolution of the redder optical colours is complex but qualitatively similar to the colour evolution found in the double-detonation models studied by Kromer et al. (2010). In particular, our CSDD-S model displays similar colour evolution to the lowest mass models in figure 3 of Kromer et al. (2010). The ELDD-S and HeD-S models also show evolution to redder colours immediately after maximum light. This is both faster and more pronounced than in the CSDD-S model and both models show extremely red colours within two weeks of maximum light, a consequence of strong cooling emission by the Ca ii infrared triplet contributing to the -band††††††Some caution must be applied to the interpretation of our prediction of very powerful Ca ii emission at days after explosion in the ELDD and HeD models – by these epochs the ejecta are sufficiently dilute that forbidden line emission may contribute significantly to the line cooling. Such emission is neglected in the current implementation of artis (Kromer & Sim, 2009) meaning that the calculations may overestimate the strength of Ca ii emission at late epochs..
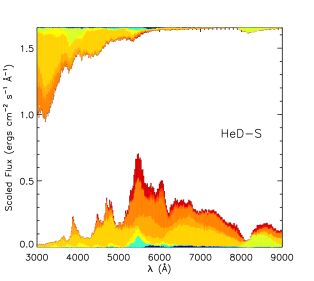
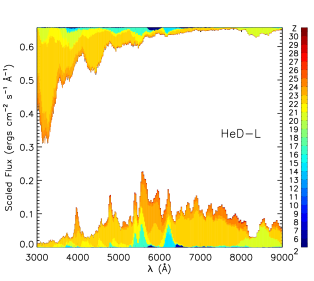
As in the Kromer et al. (2010) calculations, the red colours in our models are a consequence of effective line-blocking at blue wavelengths by iron group elements in the outer ejecta. In particular, the He detonation in all models yielded significant masses of Ti and Cr that, along with Ca, strongly influence the spectrum. This is illustrated in Figure 6, which shows the spectra of the HeD-S and HeD-L models at 8 days after explosion (the result is very similar for our other models). The colour coding in the figure indicates which elements were responsible for the last physical interactions of escaping Monte Carlo quanta in our radiative transfer simulations, making clear the dominance of elements with to 24 (Ca to Cr) in shaping the emergent spectrum.
Figure 7 compares the spectra for our explosion scenarios at two epochs, 8 and 20 days after explosion. At the earlier epoch (around peak brightness for the ELDD and HeD models), the spectra are all quite similar with strong absorption in the Ca ii infrared triplet and Ti ii lines (e.g. the characteristic trough around 4200 Å). There are some subtle differences, however – for example, the ELDD calculations (for both S- and L-models) typically show higher velocity line features than the HeD simulations, a consequence of the He-layer ejecta having been pushed to higher velocity by the CO detonation in the ELDD model. In general, our spectra are qualitatively similar to the maximum light spectra for the low-mass models of Kromer et al. (2010) but with a noticeable reduction in the role played by silicon and sulphur.
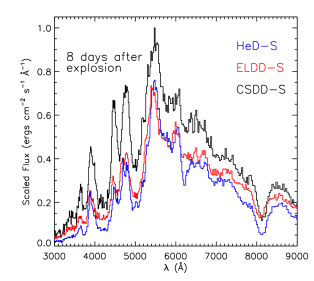
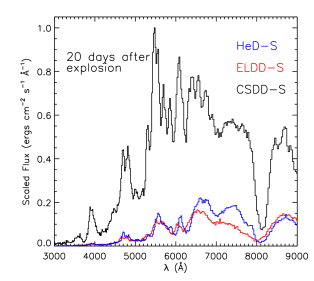
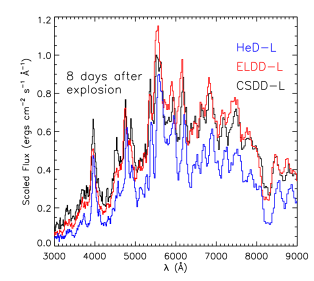
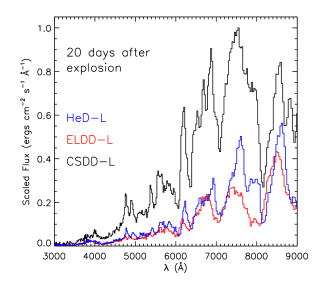
By 20 days, the differences between the models are more apparent in the spectra. In particular, the CSDD-S model begins to show additional, relatively narrow line features (e.g. between 5600 and 5900 Å) – these are formed in the slowly expanding ejecta from the CO core detonation. In contrast, the ELDD-S and HeD-S spectra remain dominated by broad line features that form in the outer ejecta. In addition, the ELDD-S (and ELDD-L) spectra now very clearly show higher velocity features than the corresponding HeD models.
5.3 Observer inclination
As discussed by Fink et al. (2010), single-spot ignition of the He layer leads to a global asymmetry in the explosion that influences the ejecta from both the He layer and the core (see Figure 2). In particular, the He-layer detonation ash tends to sweep around the CO material (in the same sense as the laterally propagating He detonation), leading to a more geometrically extended layer of He-burning products around the pole opposite to the He ignition point. This asymmetry affects the light curves and spectra, particularly at blue wavelengths (see e.g. Kromer et al., 2010). Figure 8 illustrates this for our CSDD-S, ELDD-S and HeD-S models in the UVOIR, -, - and -band light curves. The UVOIR curves are sensitive to observer inclination by several tenths of a magnitude while the bluer optical bands (- and -band) are affected more strongly (up to mag variation around the angle-averaged in -band). As in the simulations discussed by Kromer et al. (2010), the colours are bluest and the light curves decline most rapidly when viewed from the side on which the He detonation was ignited (i.e. from the -direction). At red wavelengths, observer inclination is less important and becomes negligible in the near-infrared (see lowest panels in Figure 8), in accordance with the findings of Kromer et al. (2010).
The influence of observer orientation is more complex in the CSDD-S model than the HeD-S and ELDD-S models. In that case, maximum light in both - and -band occurs significantly later (and is brighter in ) when viewed from the -direction. The broad light curve peaks in these models are sustained by radiation diffusing out from the 56Ni-rich inner parts of the ejecta (the CO ash). Since the CO detonation is off-centre (displaced down the -direction; see Figure 2 and Table 2), more of this radiation emerges in the -direction, leading to brighter extended optical emission when viewed from this direction (cf. Sim et al., 2007).
In the L-model simulations, the burning of the He-layer is significantly more complete in the ash around the -axis than in other directions (the 56Ni mass fraction is small in most regions of the the He-layer ash but it becomes significant around the -axis because of the enhanced burning in the region where the He detonation converges‡‡‡‡‡‡Due to reduction of surface area, the detonation shock strengthens and the detonation becomes over-driven around the convergence point (Livne, 1997). This affects the yields since the densities are just below the critical densities at which 56Ni is produced in a detonation.). Nevertheless, the effect of orientation on the L-model light curves is qualitatively similar to that found in the S-model and the scale of variation is comparable (up to mag in the blue bands and negligible in the near-infrared).
Overall, the influence of observer inclination is modest compared to the difference in light curve morphology between the CSDD and ELDD/HeD models. In particular, by days after explosion, the light curves are fairly orientation-independent in all bands. Thus, observer orientation should not severely hinder observational discrimination between the CSDD and ELDD/HeD scenarios. However, it does affect the light curve shapes on a similar scale to the difference between the ELDD and HeD models and therefore will complicate attempts to distinguish these mechanisms.
6 Discussion and conclusions
6.1 Core detonation
In previous work, we have studied the double-detonation model applied to sub-Chandrasekhar mass CO white dwarfs with masses M⊙: this scenario predicts transients with a range of brightness compatible with SNe Ia (e.g. Höflich & Khokhlov, 1996; Nugent et al., 1997; Kromer et al., 2010; Woosley & Kasen, 2011) and appears to be a robust explosion mechanism (Livne & Arnett, 1995; Fink et al., 2010).
Here we have investigated the plausibility of double-detonation models for systems with relatively low CO core mass and high He-layer mass, following the methodology of Fink et al. (2010). We concluded that, if detonation of the He layer occurs, the resulting compression and heating of the CO core by inwardly propagating shocks can produce sufficiently high densities and temperatures that core detonation may occur, even for core masses as low as 0.45 M⊙. Together with previous results (Livne & Arnett, 1995; Fink et al., 2010) this suggests that detonation of an accreted He layer (as in the p-Ia scenario of Bildsten et al. 2007) could be accompanied by explosion of the underlying core for all CO core masses that are commonly realized in nature.
Although our results suggest that core detonation is probable in all cases, they do not prove that it must always occur. For example, strong rotation might inhibit the shock convergence. Alternatively, the converging shocks might heat the material around the putative detonation point sufficiently that burning occurs prior to ignition of a detonation. Depending on the geometry, this might mean that the CO hot spot is completely enshrouded in nuclear ash, starving the detonation of fuel such that it is not able to propagate and incinerate the whole star. To investigate these possibilities in the future will require high-resolution, three-dimensional hydrodynamical/nucleosynthesis simulations. It will also be important to study the double-detonation mechanism for systems with ONe WD cores – in this case it will be harder to ignite a core detonation, potentially opening an alternative parameter-space for He-layer explosions.
6.2 Observable signatures of core detonation
For large CO core masses ( M⊙), the double-detonation model predicts light curves that are primarily powered by the large mass of 56Ni synthesised in the core detonation. Therefore these events will look very different from predictions of the p-Ia scenario for explosion of the corresponding He layer without the core detonation. For lower mass CO cores, however, the 56Ni mass produced in the core explosion is reduced such that some portion of the light curves will be predominantly powered by the radioactive nuclei formed in the burning of the He layer, as in the p-Ia model. To study this, we performed radiative transfer simulations for three explosion scenarios: He detonation followed by core detonation triggered following shock convergence (CSDD models), He detonation followed by prompt edge-lit core detonation (ELDD models) and He detonation with no core detonation (HeD models). We investigated these explosion scenarios for two initial model systems ( and M⊙ together with He layers of M⊙).
We found that the CSDD models can be easily distinguished from the ELDD and HeD models by their light curve morphologies: compression of the core prior to detonation means that the CSDD model yields relatively large masses of 56Ni from the core (for both our initial systems, the mass of 56Ni produced in the core is comparable to the total mass of radioactive nuclei produced in burning of the He layer). This central 56Ni causes the light curves to fade more slowly than in the other models. Consequently, this scenario can be easily distinguished observationally from an explosion of a He surface layer alone.
In contrast, our ELDD models show that if core detonation is ignited without significant pre-compression, its influence on the observables is much more subtle for the low- systems we consider. The modest differences between the synthetic observables for our ELDD and HeD models can mostly be attributed to the differing structure of the ejecta layers produced in the He detonation. In particular, explosion of the core in the ELDD model clears out the He detonation products from the inner ejecta leading to light curves that evolve a little more rapidly and spectroscopic features that are broader and more blue-shifted. Thus rapidly evolving thermonuclear transients can be produced by edge-lit double-detonation of low-mass systems. Distinguishing them from pure He-layer detonations could best be done via the evolution of spectral line shapes and infrared photometry (see Section 5).
It is noteworthy that the difference between our CSDD and ELDD models is stronger for our more massive initial system ( M⊙) than our extremely low-mass system ( M⊙). In both cases, the pre-explosion CO densities are too low to yield large 56Ni-masses in a prompt detonation. However, for our more massive system, the compression by converging shocks is able to raise the density sufficiently to produce 56Ni in a fairly substantial fraction of the core (our CSDD-S model) – this leads to the differences in shape between our CSDD-S and ELDD-S light curves. For the low-mass system, the same effect occurs but is less dramatic because the initial CO densities are so low that even with shock compression only a small fraction of the core is burned to 56Ni. For even more massive systems ( M⊙), a large fraction of the CO fuel will be at sufficiently high densities to produce 56Ni regardless of shock compression (see e.g. table 1 of Sim et al., 2010). Double detonations of such systems will therefore always produce significant masses of 56Ni from the core, meaning that the differences between the ELDD and CSDD scenarios should be relatively small for massive systems. Thus the best opportunity to observationally distinguish between the ELDD and CSDD mechanisms will be in systems where the pre-explosion densities in the core are close to but below the critical densities at which 56Ni is produced in a detonation.
6.3 Relation to known transients
The goal of this study has been to investigate whether secondary core detonation is likely for low mass CO cores and to predict the influence of CO core detonation on synthetic observables. We have not yet conducted an exploration of parameter space as required to attempt a quantitative comparison with observations. We can, however, comment qualitatively on the relation of our synthetic observables to the properties of known astrophysical transients. For reference, we tabulate important light curve shape parameters (rise times and decline timescales) for our simulations in Table 4.
Perets et al. (2010) proposed that the Type Ib event SN 2005E could be attributed to an explosion of an accreted He-layer on a WD. Its peak brightness suggests that only a few thousandths of a solar mass of 56Ni, 52Fe and 48Cr were produced, if such a model is applicable. A p-Ia like explosion was also discussed as one possibility to explain SN 2008ha (Foley et al., 2009); this event was even fainter than SN 2005E and spectroscopically different, showing low expansion velocities and no evidence of He. In both cases, however, the rise time was estimated to be days and the light curve decline parameter was mag. These rapid timescales clearly invite proper comparison with models for He-layer explosions. Waldman et al. (2011) attempted to model SN 2005E in the context of the p-Ia scenario. They investigated a model with M⊙ and M⊙ (their CO.45HE.2 model) and found that such a model might be able to account for the peak brightness of SN 2005E. However, they also found that, although significantly faster than normal SNe Ia, the decline rate of SN 2005E was slower than could be easily explained with a p-Ia model.
SN 2005E (Perets et al., 2010) was significantly fainter ( mag at peak) than our models. Although the parameters of our L-system are very similar to the Waldman et al. (2011) CO.45HE.2 simulation, our explosions are significantly brighter. The large difference in brightness stems from the fact that is the most abundant radioactive nucleus produced in the CO.45HE.2 simulation while our HeD-L model predicts to be dominant. Although only a modest shift in the mean nucleosynthetic yields, this strongly affects the brightness since the half-life of is much longer than that of . Modification of our nucleosynthesis to produce less complete burning (i.e. a lower mass of ) could be achieved by reducing the density of the He layer, although this is likely unphysical (Shen & Bildsten, 2009; Woosley & Kasen, 2011). Alternatively, significantly polluting the He layer with a heavier element such as carbon will alter the nucleosynthesis (Kromer et al., 2010; Waldman et al., 2011). For a sufficiently large initial mass fraction, adding carbon reduces the typical atomic weight of the burning products and leads to more intermediate-mass elements rather than iron-group material. Reduced yields of radioactive iron-group elements would make our models fainter and alter the spectral features. We have not investigated such possibilities here. Nevertheless, our simulations have relevance to the study of SN 2005E and similar faint and fast transients, potentially including e.g. SN 2008ha – in particular, they show that if a He layer detonation in a low-mass system is followed by a core detonation triggered by converging shocks, the core material can significantly retard the post-maximum decline of the light curves. For example, in our p-Ia-like HeD-L model, the -band decline during the 15 day period after maximum light is mag while for our CSDD-L model, mag (the scale of this effect is even more dramatic in our S-model simulations; see Table 4). Thus, in future studies, it will be important to consider whether CSDD explosions of low-mass systems might be able to account for faint thermonuclear transients whose light curves decline more slowly than can be explained by p-Ia models.
It has also been suggested that p-Ia explosions may account for a class of very rapidly evolving thermonuclear explosions that includes SN 2002bj (Poznanski et al., 2010), SN 2010X (Kasliwal et al., 2010), SN 1939B and SN 1885A (Perets et al., 2011). These events are considerably brighter than SN 2005E: for example, Kasliwal et al. (2010) estimate mag for SN 2010X while SN 2002bj is around 1.5 mag brighter. Moreover, the light curves of these events have a very rapid post-maximum decline (for example, mag for SN 2002bj; Perets et al. 2011). The rapid post-maximum decline of this class of object is inconsistent with our CSDD simulations, particularly for our brighter S-model. However, it may be compatible with the rapid decline in our ELDD (or HeD) models (see Table 4). Therefore focused modelling may be warranted to properly investigate whether ELDD models could be applicable to this class of transients.
| Parameter | CSDD-S | ELDD-S | HeD-S | CSDD-L | ELDD-L | HeD-L |
|---|---|---|---|---|---|---|
| (days) | 12 | 7.1 | 8.7 | 11 | 7.6 | 9.9 |
| (mag) | 0.4 | 1.8 | 1.8 | 1.3 | 2.0 | 1.9 |
| (days) | 8.1 | 6.0 | 7.7 | 5.4 | 5.2 | 6.4 |
| (mag) | 1.2 | 3.2 | 3.1 | 2.5 | 4.0 | 3.4 |
6.4 Future work
There remain many open questions to be addressed. Most important, perhaps, is detailed study of burning of the He layer. The He burning products play a critical role in determining the observational properties of double-detonation explosion models but their yields are sensitive to many issues including the exact densities and composition of the He layer (Shen & Bildsten, 2009; Kromer et al., 2010; Woosley & Kasen, 2011; Waldman et al., 2011), the direction in which the detonation propagates (radial or azimuthal; Fink et al. 2010; Woosley & Kasen 2011) and the structure of the detonation front. For example, Kromer et al. (2010) and Waldman et al. (2011) both showed how introducing C to the He-layer prior to burning can alter the final composition – for double detonation of models with massive CO cores, this dramatically affects the colours and can lead to much improved agreement with observed SNe Ia spectra.
In addition, we have shown that the observational consequences of core detonation in low-mass CO cores are quite different if the core detonation is edge-lit rather than triggered by shock compression. Although the triggering of the secondary detonation in our CSDD models is based on previous studies of the necessary conditions for CO detonation (Niemeyer & Woosley, 1997; Röpke et al., 2007), we have not investigated the physical plausibility of edge-lit detonation. Further study of this is clearly warranted. This is of primary interest for models with low CO core masses (e.g. the S-model studied here rather than those of Fink et al. 2010 and Kromer et al. 2010) since the difference between the CSDD and ELDD mechanisms will be largest in this case (see Section 5). However, it does have some relevance to the study of more massive cores since the position of an off-centre ignition imprints distinctive signatures on the explosion ejecta (Chamulak et al., 2011).
It will also be important to quantify the relative frequency of bright (i.e. SNe Ia-like luminosity) and fainter (i.e. p-Ia-like luminosity) explosions as a check on the plausibility of the double-detonation scenario contributing to both populations. The core/He-layer mass combinations used in this study are close to the low-mass extreme for which potential progenitor systems can be realised in nature. For low core masses, the minimum mass of accreted He required for detonation becomes large (Bildsten et al., 2007). As noted by Shen et al. (2010), systems with massive He layers ( M⊙) are not expected to be reached via the evolution of systems in which a CO WD accretes from a He WD donor. Our models, however, might be realised in systems where the donor is a He-burning star (Iben & Tutukov, 1991; Shen & Bildsten, 2009). When investigating potential progenitors for SNe Ia, Ruiter et al. (2011) found that the population of potential double-detonation systems with He-burning star donors is sub-dominant but can provide a significant event rate in young stellar populations. If extended to less massive CO cores, such population synthesis studies could estimate the relative occurrence of progenitors for the double-detonation scenario leading to both bright and fainter thermonuclear transients, a prediction that can be tested by the current and future generations of wide-field transient surveys.
Acknowledgments
This work was supported by the NCI National Facility at the Australian National University, the Deutsche Forschungsgemeinschaft via the Transregional Collaborative Research Center TRR 33 “The Dark Universe”, the Excellence Cluster EXC153 “Origin and Structure of the Universe” and the Emmy Noether Program (RO 3676/1-1). Parts of the simulations were carried out at the John von Neumann Institute for Computing (NIC) in Jülich, Germany (project HMU14).
SAS thanks Ivo Seitenzahl, Ken Shen, Lars Bildsten and Brian Schmidt for illuminating conversations. We thank Rüdiger Pakmor for developing tools to map nucleosynthesis tracer particle yields for our explosion models.
We thank the referee for useful comments that helped clarify the presentation of our work.
References
- Benz (1997) Benz W., 1997, in Ruiz-Lapuente P., Canal R., Isern J., eds, Thermonuclear Supernovae Vol. 486 of NATO ASIC Proc., Three-dimensional simulations of core ignition in sub-Chandrasekhar mass models. Kluwer Academic Publishers, Dordrecht, pp 457–474
- Bildsten et al. (2007) Bildsten L., Shen K. J., Weinberg N. N., Nelemans G., 2007, ApJL, 662, L95
- Chamulak et al. (2011) Chamulak D. A., Meakin C. A., Seitenzahl I. R., Truran J. W., 2011, ArXiv e-prints
- Dgani & Livio (1990) Dgani R., Livio M., 1990, ApJ, 361, 540
- Fink et al. (2007) Fink M., Hillebrandt W., Röpke F. K., 2007, A&A, 476, 1133
- Fink et al. (2010) Fink M., Röpke F. K., Hillebrandt W., Seitenzahl I. R., Sim S. A., Kromer M., 2010, A&A, 514, A53
- Foley et al. (2009) Foley R. J. et al., 2009, AJ, 138, 376
- Forcada (2007) Forcada R., 2007, in Supernovae: lights in the darkness Edge-lit double detonation in subchandrasekhar-mass models for type ia supernovae
- Forcada et al. (2006) Forcada R., Garcia-Senz D., José J., 2006, in International Symposium on Nuclear Astrophysics - Nuclei in the Cosmos Single point off-center helium ignitions as origin of some Type Ia supernovae
- García-Senz et al. (1999) García-Senz D., Bravo E., Woosley S. E., 1999, A&A, 349, 177
- Hillebrandt & Niemeyer (2000) Hillebrandt W., Niemeyer J. C., 2000, Ann. Rev. Astron. Astrophys., 38, 191
- Höflich & Khokhlov (1996) Höflich P., Khokhlov A., 1996, ApJ, 457, 500
- Iben & Tutukov (1991) Iben Jr. I., Tutukov A. V., 1991, ApJ, 370, 615
- Kasliwal et al. (2010) Kasliwal M. M. et al., 2010, ApJL, 723, L98
- Keller et al. (2007) Keller S. C. et al., 2007, PASA, 24, 1
- Kromer & Sim (2009) Kromer M., Sim S. A., 2009, MNRAS, 398, 1809
- Kromer et al. (2010) Kromer M., Sim S. A., Fink M., Röpke F. K., Seitenzahl I. R., Hillebrandt W., 2010, ApJ, 719, 1067
- Kurucz & Bell (1995) Kurucz R. L., Bell B., 1995, Atomic line list
- Livne (1990) Livne E., 1990, ApJL, 354, L53
- Livne (1997) Livne E., 1997, in Ruiz-Lapuente P., Canal R., Isern J., eds, NATO ASIC Proc. 486: Thermonuclear Supernovae Helium and carbon detonations in sub-Chandrasekhar white dwarfs. pp 425–440
- Livne & Arnett (1995) Livne E., Arnett D., 1995, ApJ, 452, 62
- Livne & Glasner (1990) Livne E., Glasner A. S., 1990, ApJ, 361, 244
- Livne & Glasner (1991) Livne E., Glasner A. S., 1991, ApJ, 370, 272
- LSST Science Collaboration (2009) LSST Science Collaborations, 2009, ArXiv e-prints: 0912.0201
- Niemeyer & Woosley (1997) Niemeyer J. C., Woosley S. E., 1997, ApJ, 475, 740
- Nomoto (1980) Nomoto K., 1980, Space Science Reviews, 27, 563
- Nomoto (1982) Nomoto K., 1982, ApJ, 257, 780
- Nugent et al. (1997) Nugent P., Baron E., Branch D., Fisher A., Hauschildt P. H., 1997, ApJ, 485, 812
- Perets et al. (2011) Perets H. B., Badenes C., Arcavi I., Simon J. D., Gal-yam A., 2011, ApJ, 730, 89
- Perets et al. (2010) Perets H. B. et al., 2010, Nature, 465, 322
- Poznanski et al. (2010) Poznanski D. et al., 2010, Science, 327, 58
- Rauscher & Thielemann (2000) Rauscher T., Thielemann F.-K., 2000, Atomic Data and Nuclear Data Tables, 75, 1
- Röpke et al. (2007) Röpke F. K., Woosley S. E., Hillebrandt W., 2007, ApJ, 660, 1344
- Ruiter et al. (2011) Ruiter A. J., Belczynski K., Sim S. A., Hillebrandt W., Fryer C. L., Fink M., Kromer M., 2011, MNRAS, 417, 408
- Seitenzahl et al. (2009a) Seitenzahl I. R., Meakin C. A., Lamb D. Q., Truran J. W., 2009a, ApJ, 700, 642
- Seitenzahl et al. (2009b) Seitenzahl I. R., Meakin C. A., Townsley D. M., Lamb D. Q., Truran J. W., 2009b, ApJ, 696, 515
- Seitenzahl et al. (2010) Seitenzahl I. R., Röpke F. K., Fink M., Pakmor R., 2010, MNRAS, 407, 2297
- Shen & Bildsten (2009) Shen K. J., Bildsten L., 2009, ApJ, 699, 1365
- Shen et al. (2010) Shen K. J., Kasen D., Weinberg N. N., Bildsten L., Scannapieco E., 2010, ApJ, 715, 767
- Sim (2007) Sim S. A., 2007, MNRAS, 375, 154
- Sim et al. (2010) Sim S. A., Röpke F. K., Hillebrandt W., Kromer M., Pakmor R., Fink M., Ruiter A. J., Seitenzahl I. R., 2010, ApJL, 714, L52
- Sim et al. (2007) Sim S. A., Sauer D. N., Röpke F. K., Hillebrandt W., 2007, MNRAS, 378, 2
- Sullivan et al. (2011) Sullivan M. et al., 2011, ApJ, 732, 118
- Travaglio et al. (2004) Travaglio C., Hillebrandt W., Reinecke M., Thielemann F.-K., 2004, A&A, 425, 1029
- Waldman et al. (2011) Waldman R., Sauer D., Livne E., Perets H., Glasner A., Mazzali P., Truran J. W., Gal-Yam A., 2011, ApJ, 738, 21
- Woosley & Kasen (2011) Woosley S. E., Kasen D., 2011, ApJ, 734, 38
- Woosley et al. (1986) Woosley S. E., Taam R. E., Weaver T. A., 1986, ApJ, 301, 601
- Woosley & Weaver (1994) Woosley S. E., Weaver T. A., 1994, ApJ, 423, 371
- Woosley et al. (1980) Woosley S. E., Weaver T. A., Taam R. E., 1980, in J. C. Wheeler ed., Texas Workshop on Type I Supernovae Models for Type I supernovae. pp 96–112