Recent Progress of Cepheid Research at National Central University: From Spitzer to Kepler
Abstract
In this presentation I summarize recent work on Cepheid research carried out at the National Central University. The mid-infrared period-luminosity (P-L) relations for Cepheids are important in the James Webb Space Telescope era for distance scale work, as the relations have potential to derive the Hubble constant within % accuracy – a critical constraint in the precision cosmology. Consequently, we have derived the mid-infrared P-L relations for Cepheids in the Large and Small Magellanic Clouds, using archival data from the Spitzer Space Telescope. Kepler Space Telescope is a NASA mission to search for Earth-size and larger planets around Sun-like stars, by observing continuously the stars in a dedicated patch of the sky. As a result, the almost un-interrupted observation is also used for stellar variability and asteroseismological study. However, Kepler observations are carried out with a single broad-band filter, hence ground-based follow-up observation needed to complement Kepler light curves to fully characterize the properties of the target stars. Here I present the ground-based optical follow-up observations for two Cepheid candidates located within the Kepler’s field-of-view. Together with Kepler light curves, our ground-based data rule out V2279 Cyg being a Cepheid. Hence V1154 Cyg is the only Cepheid in the Kepler’s field.
National Central University, 320 Jhongli City, Taoyuan Country, Taiwan
1 Introduction
Classical Cepheid variables (hereafter Cepheids) are post main-sequence yellow supergiants. Cepheid masses range from to with surface temperatures between to . Cepheids obey the period-mean density relation, hence their pulsating periods (, where is period in days) are well correlated with luminosity. This is known as the period-luminosity (P-L) relation, also referred as the Leavitt Law, commonly written in the form of or . Since Cepheids are evolved pulsating stars, they are ideal laboratories for testing the stellar pulsation and evolution theories. The Cepheid P-L relation is an important rung in the cosmic distance scale ladder that can be used to calibrate a host of secondary distance indicators (for examples, the Tully-Fisher relation, peak brightness of Type Ia supernovae and surface brightness fluctuations). These secondary distance indicators, located well within the Hubble-flow, can then be used to measure one of the most important parameter in modern cosmology – the Hubble constant.
In this proceeding, I will present some recent progress on Cepheid research carried out at the National Central University (NCU), that focused on the following two topics: (a) derivation of the mid-infrared Cepheid P-L relations based on archival data from Spitzer observations; and (b) investigation of potential Cepheids located within the Kepler field using ground-based follow-up data.
2 Derivation of the Mid-Infrared Cepheid P-L Relation Using Spitzer Archival Data
In the era of precision cosmology, it is desirable to independently derive an accurate Hubble constant, This is because degeneracy exists in CMB (cosmic microwave background) anisotropies between the flatness of the Universe and the Hubble constant. Therefore, as stated in Hu (2005):
“… to test the cosmological constant hypothesis and measure the equation of state of the dark energy at - , the best complement to current and future CMB measurements is a measurement of the Hubble constant that is accurate at the few percent level.”
Furthermore, Figures 23 and 24 from Macri et al. (2006) clearly illustrate the improved precision of measured dark energy parameters when the accuracy of Hubble constant is increased. Current systematic errors of Hubble constant measurements based on optical data, using the Cepheid P-L relation as first rung of the distance scale ladder, is % to % (see the review given in Freedman & Madore 2010). In the near future, it is possible to reduce the systematic error of Hubble constant to % from mid-infrared observations from the Spitzer and/or next generation James Webb Space Telescope (JWST) (Freedman & Madore 2010), taking huge advantage of the fact that extinction is negligible in the mid-infrared (Freedman et al. 2008; Ngeow & Kanbur 2008; Ngeow et al. 2009; Freedman & Madore 2010). The first step toward this goal is to derive and calibrate the Cepheid P-L relation in the mid-infrared.
2.1 The IRAC Band P-L Relations
Prior to 2008, the longest available wavelength for the Cepheid P-L relation is in the band. In 2007, archival data from SAGE (Surveying the Agents of a Galaxy’s Evolution) was released, where SAGE is one of the Spitzer Legacy programs that map out the Large Magellanic Cloud (LMC) in Spitzer IRAC bands111The IRAC bands include , , and bands. (and MIPS bands, see Meixner et al. 2006). Hence, mid-infrared Cepheid P-L relations can be derived by matching the known LMC Cepheids to the SAGE catalog – this has resulted two papers published in 2008 (Freedman et al. 2008; Ngeow & Kanbur 2008). Both papers utilized the SAGE Epoch 1 data matched to different samples of LMC Cepheids: Freedman et al. (2008) matched to Cepheids from Persson et al. (2004) while Ngeow & Kanbur (2008) used the OGLE-II Catalog (Optical Gravitational Lensing Experiment, Udalski et al. 1999) that includes LMC Cepheids.
After the release of SAGE Epoch 1 and 2 data, the IRAC band LMC P-L relations have been updated in Madore et al. (2009) and Ngeow et al. (2009) by averaging the two epochs photometry. Ngeow et al. (2009) also included the LMC Cepheids from the latest OGLE-III Catalog (Soszynski et al. 2008, with more Cepheids than OGLE-II Catalog). In addition to LMC, IRAC band P-L relations have also been derived for SMC Cepheids (see Ngeow & Kanbur 2010, for details) using the publicly available SAGE-SMC data. Finally, IRAC band P-L relations for a small number of Galactic Cepheids that possess independent distance measurements have been presented by Marengo et al. (2010). All together, there are six sets of IRAC band P-L relations for Cepheids in our Galaxy and in Magellanic Clouds. Slopes of these P-L relations are summarized in Figure 1.


As mentioned in Ngeow & Kanbur (2010), these six sets of P-L slopes can be grouped into two groups: one group with “shallow” slopes around , and another group with “steeper” slopes around . The expected IRAC band P-L slope can be calculated from , hence (where is the slope of period-radius relation taken from Gieren et al. 1999). If assumed is constant at long wavelength, then the expected P-L slops is . On the other hand, due to Rayleigh-Jean approximation, at the IRAC band wavelength, then estimated from color-temperature conversion (for details, see Neilson et al. 2010), the expected P-L slope becomes . Both of these expected slopes are close to the averaged slopes in the observed “steep” and “shallow” groups. Finally, these empirical P-L slopes were compared to the slopes from synthetic P-L relations, based on theoretical pulsational models with varying metallicity, in Figure 2. Details of these synthetic P-L relations will be given elsewhere (Ngeow et al. – in preparation). The trends of synthetic P-L slopes with appear to be in agreement to the empirical slopes given in “shallow” group.

3 Ground-Based Light Curves for Cepheids Located Within Kepler Field-Of-View
Kepler is a NASA space mission to search for Earth-like exo-planets using the transit method. Hence, the field-of-view for Kepler, with , is constantly pointing toward :. In addition to searching for exo-planets, light curve data from almost un-interrupted observations from Kepler are also very useful and valuable for asteroseismic and stellar variability study. Therefore, a consortium called Kepler Asteroseismic Science Consortium (KASC)222http://astro.phys.au.dk/KASC/ was formed. KASC consists of 14 working groups (WG), and WG7 is dedicated to Cepheids study with Kepler data.
Since Cepheids are radially pulsating variable stars with periods longer than a day, it is not necessary to continuously monitor Cepheids in a given night or from different observatories across the globe. These multiple-site observing campaigns, on the other hand, have been practiced for other kinds of variable stars such as short period delta-Scuti stars to investigate, for example, various pulsating modes of these stars. Continuous photometry from Kepler, however, offers a great opportunity to study the possible non-radial pulsating modes as suggested by theory (Mulet-Marquis et al. 2007), or even stochastically excited modes, in Cepheids. However, Kepler observations are conducted in a customized broad-band filter, and complementary ground-based multi-color photometric and spectroscopic follow-up observations are needed for the Cepheid candidates located within the Kepler field-of-view. Detailed investigation of these candidates using both of the Kepler light curves and ground-based follow-up data can be found in Szabo et al. (2011), only a brief overview will be presented in this proceeding.
3.1 Follow-Up Observations for Selected Cepheid Candidates
Prior to the launch of Kepler, V1154 Cyg was the only Cepheid located in Kepler’s field, while V2279 Cyg was a strong Cepheid candidate. Several other Cepheid candidates were also selected based on the Kepler Input Catalog or other variable stars catalogs (Szabo et al. 2011). Ground-based follow-up observations for these Cepheid candidates were carried out at Lulin Observatory (located at central Taiwan) and Tenagra II Observatory (located in Arizona, USA), mostly from March to August 2010. The author is responsible for the observations from these two observatories, where the telescopes and CCD used are listed in Table 1. Figure 3 shows the distributions of in band images taken from these telescopes. Data reductions were done based on the following steps:
| Tel. Abbreviation | Observatory | Aperture [m] | CCD | Pixel Scale [”/pix] |
|---|---|---|---|---|
| LOT | Lulin Obs. | 1.0 | PI-1300B | 0.52 |
| SLT | Lulin Obs. | 0.4 | Apogee U9000 | 0.99 |
| TNG | Tenagra II Obs. | 0.8 | STIe | 0.86 |


-
1.
Images were bias-subtracted, dark-subtracted and flat-fielded using 333 is distributed by the National Optical Astronomy Observatories, which are operated by the Association of Universities for Research in Astronomy, Inc., under cooperative agreement with the National Science Foundation.. Fringe corrections were applied to the band images from LOT.
- 2.
-
3.
Instrumental magnitudes were extracted from the images using SExtractor (Bertin & Arnouts 1996). These magnitudes were based on MAG_AUTO aperture photometry.
-
4.
Observations from Tenagra II Observatory on 12 May 2010 included the Landolt standard fields (Landolt 2009). Instrumental magnitudes from this night were calibrated to the standard magnitudes.
-
5.
Photometry from other nights were relatively calibrated using the calibrated magnitudes from 12 May 2010.
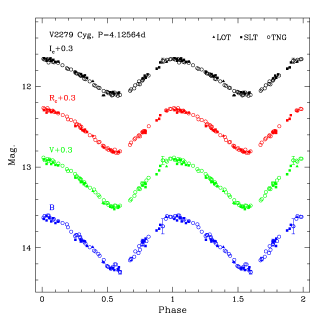
The resulted light curves for two of the candidates, V1154 Cyg and V2279 Cyg, are presented in Figure 4. Additional data were available from Sonoita Research Observatory444Observations and the data reduction from Sonoita Research Observatory have been taken care by A. Henden. (Szabo et al. 2011).
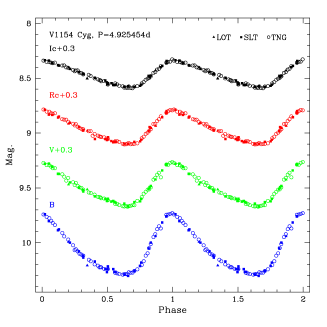
Light curves of V1154 Cyg from Kepler observations resemble a typical sawtooth shape of a Cepheid’s light curve (see Figure 4 in Szabo et al. 2011). Frequency analysis of almost continuous Kepler light curves for this variable showing a strong peak at the fundamental frequency, with other detectable harmonics in the spectrum (see Figure 12 in Szabo et al. 2011). This suggests that V1154 Cyg pulsates radially in a regular fashion, without any non-radial or stochastic modes. The light curves of V1154 Cyg also strongly support the Cepheid nature of this variable. Fourier parameters ( and ), based on the band light curve, of this Cepheid also fall within the distributions defined by Galactic Cepheids. The phase lag from band light curve and radial velocity curve confirms that V1154 Cyg is a fundamental mode Cepheid.
Even though the band light curves for V2279 Cyg mimic the light curve of a first overtone Cepheids, Fourier analysis of this variable revealed that this star is not a Cepheid. Furthermore, flares show up in Kepler light curves, and the light curve morphology is in agreement with rotational modulation. Additional spectroscopic follow-up observations confirmed that this variable is not a Cepheid. Cepheid nature of other candidates has been ruled out based on Kepler light curves and/or light curves, and V1154 Cyg remains the only Cepheid located within the Kepler’s field.
4 Conclusion
I have presented some recent work on Cepheid research that carried out at NCU. In summary:
-
•
Mid-infrared P-L relations will be important in near future and in JWST era with the potential to reduce the systematic error of Hubble constant. Consequently, P-L relations based on Cepheids in Magellanic Clouds have been derived using the archival Spitzer data.
-
•
Almost continuous observation from Kepler is very valuable for stellar variability and pulsation study. However, ground-based follow-up observations are needed to complement Kepler data to fully investigate the variable stars in the Kepler’s field. Together with Kepler light curves, the ground-based follow-up observations for Cepheid candidates confirmed that V1154 Cyg is the only Cepheid located within Kepler’s field.
Acknowledgments
CCN would like to thank the support from National Science Council under the contract NSC98-2112-M-008-013-MY3. We would also like to thank the collaboration and discussion with Shashi Kanbur, Hilding Neilson, Marcella Marconi, Ilaria Musella, Michele Cignoni, Robert Szabo, Laszlo Szabados, Arne Henden and the Kepler Cepheid Working Group. This work is based [in part] on observations made with the Spitzer Space Telescope, which is operated by the Jet Propulsion Laboratory, California Institute of Technology under a contract with NASA. Funding for the Kepler Mission is provided by NASA’s Science Mission Directorate. We acknowledge assistance of the queue observers, Chi-Sheng Lin and Hsiang-Yao Hsiao, from Lulin Observatory, which is operated by the National Central University of Taiwan, and is funded partially by the grant NSC97-2112-M-008-005-MY3. We also acknowledge the variable star observations from the AAVSO International Database contributed by observers worldwide and used in this research.
References
- Bertin (2006) Bertin, E. 2006, in Astronomical Data Analysis Software and Systems XV,, edited by C. Gabriel, C. Arviset, D. Ponz, & E. Solano (San Francisco: Astronomical Society of the Pacific), vol. 351 of ASP Conference Series, 112
- Bertin & Arnouts (1996) Bertin, E., & Arnouts, S. 1996, A&AS, 117, 393
- Freedman & Madore (2010) Freedman, W., & Madore, B. 2010, Annual Review of Astronomy and Astrophysics, 48, 673
- Freedman et al. (2008) Freedman, W., Madore, B., Rigby, J., Persson, S. E., & Sturch, L. 2008, ApJ, 679, 71
- Gieren et al. (1999) Gieren, W., Moffett, T., & Barnes, T. III 1999, ApJ, 512, 553
- Hu (2005) Hu, W. 2005, in Observing Dark Energy, edited by S. C. Wolff, & T. R. Lauer (San Francisco: Astronomical Society of the Pacific), vol. 339 of ASP Conference Series, 215
- Landolt (2009) Landolt, A. 2009, AJ, 137, 4186
- Lang et al. (2010) Lang, D., Hogg, D. W., Mierle, K., Blanton, M., & Roweis, S. 2010, AJ, 139, 1782
- Macri et al. (2006) Macri, L. M., Stanek, K. Z., Bersier, D., Greenhill, L. J., & Reid, M. J. 2006, ApJ, 652, 1133
- Madore et al. (2009) Madore, B., Freedman, W., Rigby, J., Persson, S. E., Sturch, L., & Mager, V. 2009, ApJ, 695, 988
- Marengo et al. (2010) Marengo, M., Evans, N. R., Barmby, P., Bono, G., Welch, D. L., & Romaniello, M. 2010, ApJ, 709, 120
- Meixner et al. (2006) Meixner, M., Gordon, K., Indebetouw, R., & et al. 2006, AJ, 132, 2268
- Mulet-Marquis et al. (2007) Mulet-Marquis, C., Glatzel, W., Baraffe, I., & Winisdoerffer, C. 2007, A&A, 465, 937
- Neilson et al. (2010) Neilson, H., Ngeow, C.-C., Kanbur, S., & Lester, J. 2010, ApJ, 716, 1136
- Ngeow & Kanbur (2008) Ngeow, C.-C., & Kanbur, S. 2008, ApJ, 679, 76
- Ngeow & Kanbur (2010) — 2010, ApJ, 720, 626
- Ngeow et al. (2009) Ngeow, C.-C., Kanbur, S., Neilson, H., Nanthakumar, A., & Buonaccorsi, J. 2009, ApJ, 693, 691
- Persson et al. (2004) Persson, S. E., Madore, B., Krzemiński, W., Freedman, W., Roth, M., & Murphy, D. 2004, AJ, 128, 2239
- Soszynski et al. (2008) Soszynski, I., Poleski, R., Udalski, A., Szymanski, M. K., Kubiak, M., Pietrzynski, G., Wyrzykowski, L., Szewczyk, O., & Ulaczyk, K. 2008, Acta Astronomica, 58, 163
- Szabo et al. (2011) Szabo, R., Szabados, L., Ngeow, C.-C., & et al. 2011, MNRAS, 413, 2709
- Udalski et al. (1999) Udalski, A., Soszynski, I., Szymanski, M., Kubiak, M., Pietrzynski, G., Wozniak, P., & Zebrun, K. 1999, Acta Astronomica, 49, 223