Ab-Initio Simulations of Deformation Potentials and Electron Mobility in Chemically Modified Graphene and two-dimensional hexagonal Boron-Nitride
Abstract
We present an ab-initio study of electron mobility and electron-phonon coupling in chemically modified graphene, considering fluorinated and hydrogenated graphene at different percentage coverage. Hexagonal Boron Carbon Nitrogen (h-BCN) is also investigated due the increased interest shown by the research community towards this material. In particular, the Deformation Potentials are computed by means of Density Functional Theory (DFT), while the carrier mobility is obtained according to the Takagi model (S. Takagi, A. Toriumi, and H. Tango, IEEE Trans. Electr. Dev. , 2363 (1994)). We will show that graphene with a reduced degree of hydrogenation can compete, in terms of mobility, with silicon technology.
pacs:
73.63.-b,73.50.Dn,72.80.Vp,63.22.-mUnderstanding electron mobility in chemically modified graphene is a matter of primary importance, in order to clarify if graphene will manage to come after industry requirements in the mid-term.
Despite two dimensional graphene is now at the core of both fundamental and applied research, it presents lights and shadows, like its outstanding electronic properties, such as its extremely high mobility Neto et al. (2009); Bolotin et al. (2008), but, at the same time, the lack of an energy bandgap, which prevents its use in digital applications.
Chemical modification of graphene has recently entered the research scenario as a possible candidate to tackle such a problem. Elias et al. Elias et al. (2009) managed to experimentally induce an energy gap in hydrogenated graphene, previously predicted by Sofo et al. Sofo et al. (2007) through numerical calculations, while graphene fluorination Luo et al. (2010) has shown a clear dependence of the band gap on fluorine concentration.
An alternative option to obtain two-dimensional materials with tunable electronic properties has been recently demonstrated by Ci et al. Ci et al. (2001), exploiting hexagonal Boron Nitride (h-BN) and including different percentages of C atoms (h-BCN), or isomers.
However, fabrication techniques are still at an embryonic stage Elias et al. (2009), so that an experimental investigation of the main figure of merit for electronic application like electron mobility is still far from being performed. From this point of view computational approach is the only tool able to provide relevant information regarding the intrinsic mobility to be expected.
To this purpose, in this work we focus on the electron-phonon interaction, in order to investigate the ultimate intrinsic mobility in hydrogenated/fluorinated graphene at different percentage coverage, as well as in h-BCN structures.
We follow the Bardeen and Shockley’s Bardeen and Shockley (1950) approach, where the atomic displacement associated with a long-wavelength acoustic phonon leads to a deformation of the crystal Herring and Vogt (1956), and in turn, to a shift of the electronic energy dispersion. The band edge shift is related to the differential displacement of the crystal by the electron-phonon coupling Hamiltonian Long et al. (2009); Murphy-Armando et al. (2010); Xu et al. (2010):
| (1) |
where is the so-called deformation potential and is the displacement at the spatial coordinate Sum et al. (2010). In order to evaluate , we define a second-rank tensor , where and are the component of vector and the cartesian coordinates, respectively, while and are the antisymmetric and symmetric tensors, respectively. In particular, describes a rigid rotation of the crystal and does not lead to a shift of the electronic energies, so that, to our purposes, it can be ignored. instead describes a strain induced in the crystal by the atomic displacements, which indeed is able to shift the bands. By definition, its trace is equal to the fractional volume change of the elementary cell induced by the strain. Representing the long wavelength acoustic vibration by a plane wave with frequency and wave vector as , the strain tensor in proximity of the point, for the longitudinal acoustic (LA) mode, is diagonal, i.e. , where and are the component of the wave vector and the atomic displacement from equilibrium geometry, respectively. In this hypothesis, since , we obtain
| (2) |
where is the induced band edge shift due to acoustic phonon. Once known , the carrier mobility can be estimated by means of the Takagi formula Takagi et al. (1994), which reads
| (3) |
where is the mass density, is the temperature, the Boltzmann’s constant, is the elementary charge, is the sound velocity, while is the mass along the transport direction (either or along the and direction, respectively) and is the equivalent density-of-state mass defined as . , and are computed by means of ab-initio calculation, and are extracted from the phonon and electronic dispersion relations , according to and . The deformation potential is instead computed through mimicking the lattice deformation due to phonons by multiplying the lattice constant by different factors (0.99, 0.995, 1.005 and 1.01), i.e. dilating and relaxing the primitive cell. is then obtained computing the energy shift of the bottom of the conduction band and applying Eq.(2).
Ab-initio calculations have been performed by means of the Quantum Espresso Giannozzi et al. (2009) code, using a plane wave basis set in the generalized gradient approximation (GGA) with the Perdew-Burke-Ernzerhof (PBE) exchange correlation functional. A 50 Ry wave function cutoff and 400 Ry charge density cutoff have been considered, while the Brillouin zone has been sampled using a MonkhorstPack grid. A 30 bohr layer of vacuum is considered to separate the sheet from its periodical images, which we have verified to be sufficient to avoid any unphysical interactions. The dynamical properties are calculated within the density-functional perturbation theory Baroni et al. (2001). We have also verified that extracting the main parameter of interest, i.e. the effective mass, from DFT-GGA simulations manages to provide results in close agreements with those extracted from GW calculations (within 5% of accuracy), but with fewer computational requirements (an overall simulation walltime almost 3 order of magnitude smaller).
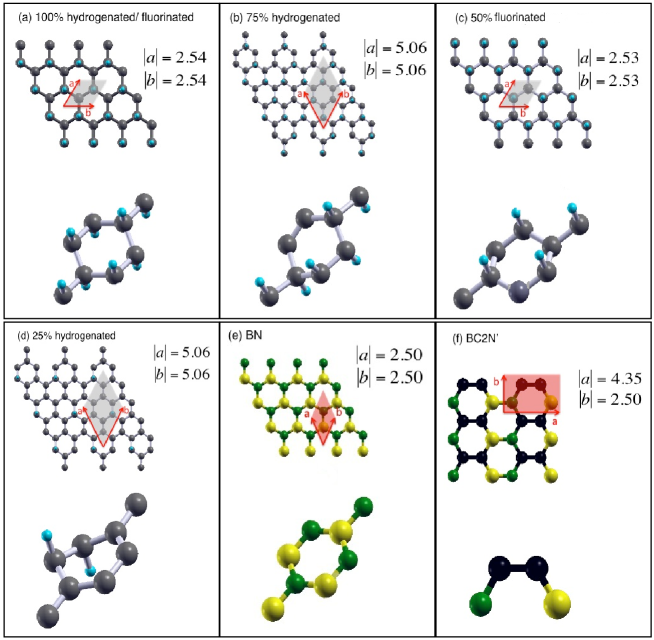
In Fig. 1, we show the considered structures. Relaxed structures for 100% hydrogenated and fluorinated graphene and 50% fluorinated graphene (from here on H100%, F100% and F50%, respectively) are in agreement with results already shown in the literature Sofo et al. (2007); Sahin et al. (2011). 25% and 75% hydrogenated graphene (H25% and H75%) have been studied considering a cell composed by 8 C atoms and 2 H and 6 H, respectively. In particular, the topological shown in Fig.1 is the most energetically favourable over all possible geometric and spin configurations. Simple chemical consideration can support these results. The relaxed H25% configuration is the only one possessing a resonant chain of alternating double and single bonds, which guarantees structure stability. On the other hand, the considered H75% structure shows a double bond inside the cell, which assures a stable structure. All the structures are nonmagnetic, since unsaturated C atoms are all neighbors and their orbitals form -bonding, which quenches magnetism.
All the considered materials (except F50%, which is a metal) are semiconducting and have non-degenerate conduction band minimum at the point.
| effective | effective | ||||
|---|---|---|---|---|---|
| reduced | reduced | ||||
| mass () | mass () | ||||
| H 100% | 1.02 | 1.02 | 6.9 | ||
| H 75% | 1.59 | 1.39 | 8.58 | ||
| H 25% | 0.12 | 0.53 | 9.44 | ||
| F 100% | 0.53 | 0.53 | 20.84 | ||
| F 50% | 0.99 | 0.99 | 10.94 | ||
| h-BN | 0.97 | 0.97 | 3.66 | ||
| () () | () | () | |||
| BN | ; | 0.39 | 0.27 | 18.74 |
The effective masses shown in Tab. 1 are evaluated through a five-point second derivative, considering a k-point spacing smaller than in order to avoid nonparabolic effects. The sound velocities are extracted from the slope of the acoustic longitudinal phonon branch. H25% and H75% show different values for the effective mass along the and directions, leading to two different values of electron mobility. The relative effective mass is quite large and close to one for the larger degree of functionalization. At the lowest degree of H coverage, the electron effective mass is small, since in the limit of no functionalization, the null mass of graphene has to be recovered.
In order to understand the deformation potential trend as a function of H percentage, we focus on the LUMO (Lowest Unoccupied Molecular Orbital) at the point.
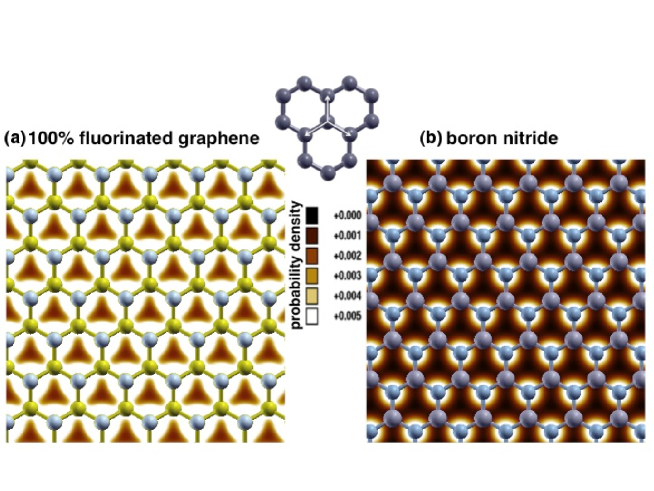
In Fig. 2, we show the LUMO for the F100% and h-BN, corresponding to the largest and smallest obtained , respectively (the lighter the colour, the higher the probability density). In particular, the h-BN shows the LUMO strongly localized on single atoms (Fig. 2b), while in the F100% case the LUMO is spread over groups of atoms (Fig. 2a). Since the deformation of the crystalline lattice due to longitudinal acoustic phonon is represented as an homogeneous, symmetrical dilation on the plane (picture at the top, where the direction of the stretching is depicted by the arrows in white), the LUMO of F100% is largely deformed by the phonon motion, leading to a stronger electron-phonon coupling, and consequently, to large value of . On the other hand, when the LUMO is strongly localized, the electron-phonon coupling is poor and the deformation potential is consequently low, as in the case of h-BN.
In Tab. 2, the electron mobilities computed for all the considered materials along the main symmetry directions are shown. H25%, H75% and BN exhibit different mobilities along the two considered directions, as a consequence of the asymmetry of the conduction energy band.
| H 100% | 104.8 | 104.7 |
|---|---|---|
| H 75% | 45.7 | 52.1 |
| H 25% | 3597.6 | 805.1 |
| F 100% | 44.9 | 44.9 |
| F 50% | 42.6 | 42.6 |
| BN | 486.9 | 486.9 |
| BN | 153.3 | 179.8 |
The low mobility values for highly hydrogenated graphene are in quantitative agreement with available experimental data recently reported in the literature as a function of the exposure time to H Jaiswal et al. (2011). While fluorinated compounds show the smallest mobilities among the considered structures, H25% possess mobility comparable to bulk silicon, and an energy gap suitable for electronic applications, which could lead to a possible exploitation of such material in next-generation nanoscale devices. Finally, while BC2N shows poor mobility in both and directions, in BN is large enough for digital applications.
To conclude, we have computed the electron mobility of hydrogenated and fluorinated graphene as well as h-BCN from first-principles. The adopted method manages to provide accurate results with reduced computational requirements, since it avoids explicit calculation of electron-phonon scattering coefficients. Deformation potentials have been extracted from DFT calculations, which can be useful for future works dealing with Monte Carlo simulations of transport in functionalized graphene based transistors. Among the considered structures, H25% has better performance in terms of mobility, showing comparable with bulk Silicon, which could open its exploitation as device channel in the next technological nodes. As a word of caution, we have to point out that the obtained mobility represents an upper limit for the intrinsic mobility achievable in such structures, since additional degree of inhomogeneity (not considered in the present work) could lead to mobility reduction.
Authors gratefully acknowledge support from the EU FP7 Project NANOSIL (n. 216171), GRAND (n. 215752) grants, and by the MIUR-PRIN project GRANFET (Prot. 2008S2CLJ9) via the IUNET consortium.
References
- Neto et al. (2009) A. H. C. Neto, F. Guinea, N. M. R. Peres, K. S. Novoselov, and A. K. Geim, Rev. Mod. Phys. 81, 109 (2009).
- Bolotin et al. (2008) K. I. Bolotin, K. J. Sikes, Z. Jiang, M. Klima, G. Fudenberg, J. Hone, P. Kim, and H. L. Stormer, Solid State Commun. 146, 351 (2008).
- Elias et al. (2009) D. C. Elias, T. M. G. M. R. R. Nair, S. V. Morozov, P. Blake, M. P. Halsall, A. C. Ferrari, D. W. Boukhvalov, M. I. Katsnelson, A. K. Geim, and K. S. Novoselov, Science 323, 610 (2009).
- Sofo et al. (2007) J. O. Sofo, A. S. Chaudhari, and G. D. Barber, Phys. Rev. B 75, 153401 (2007).
- Luo et al. (2010) Z. Luo, J. Shang, S. Lim, D. Li, Q. Xiong, Z. Shen, J. Lin, and T. Yu, App. Phys. Lett. 97, 233111 (2010).
- Ci et al. (2001) L. Ci, L. Song, C. Jin, D. Jariwala, D. Wu, Y. Li, A. Srivastava, Z. F. Wang, K. Storr, and P. M. A. L. Balicas, F. Liu, Nat. Mater. 9, 430 (2001).
- Bardeen and Shockley (1950) J. Bardeen and W. Shockley, Phys. Rev. 50, 72 (1950).
- Herring and Vogt (1956) C. Herring and E. Vogt, Phys. Rev. 101, 944 (1956).
- Long et al. (2009) M. Q. Long, L. Tang, D. Wang, L. Wang, and Z. Shuai, J. Am. Chem. Soc. 131, 17728 (2009).
- Murphy-Armando et al. (2010) F. Murphy-Armando, G. Fagas, and J. C. Greer, Nano Lett. 10, 869 (2010).
- Xu et al. (2010) B. Xu, Y. Xia, J. Yin, X. Wan, K. Jiang, A. Li, D. Wu, and Z. Liu, Appl. Phys. Lett. 96, 183108 (2010).
- Sum et al. (2010) Y. Sum, S. E. Thompson, and T. Nishida, Strain Effects in Semiconductors (Springer, New York, 2010), 1st ed.
- de Walle (1988) C. G. V. de Walle, Phys. Rev. B 39, 1871 (1988).
- Takagi et al. (1994) S. Takagi, A. Toriumi, and H. Tango, IEEE Trans. Electr. Dev. 41, 2363 (1994).
- Giannozzi et al. (2009) P. Giannozzi, S. Baroni, N. Bonini, M. Calandra, R. Car, C. Cavazzoni, D. Ceresoli, G. L. Chiarotti, M. Cococcioni, I. Dabo1, et al., J. Phys.: Condens. Matter 21, 395502 (2009).
- Baroni et al. (2001) S. Baroni, S. de Gironcoli, A. D. Corso, and P. Giannozzi, Rev. Mod. Phys. 73, 515 (2001).
- Sahin et al. (2011) H. Sahin, M. Topsakal, and S. Ciraci, Phys. Rev. B. 83, 115432 (2011).
- Jaiswal et al. (2011) M. Jaiswal, C. H. Y. X. Lim, Q. Bao, C. T. Toh, K. P. Loh, and B. Ozyilmaz, ACS Nano 2, 888 (2011).