-COS Observations of Hydrogen, Helium, Carbon and Nitrogen Emission from the SN 1987A Reverse Shock**affiliation: Based on observations made with the NASA/ESA S , obtained from the data archive at the Space Telescope Science Institute. STScI is operated by the Association of Universities for Research in Astronomy, Inc. under NASA contract NAS 5-26555.
Abstract
We present the most sensitive ultraviolet observations of Supernova 1987A to date. Imaging spectroscopy from the Hubble Space Telescope-Cosmic Origins Spectrograph shows many narrow ( 300 km s-1) emission lines from the circumstellar ring, broad ( 10 – 20 103 km s-1) emission lines from the reverse shock, and ultraviolet continuum emission. The high signal-to-noise ( 40 per resolution element) broad Ly emission is excited by soft X-ray and EUV heating of mostly neutral gas in the circumstellar ring and outer supernova debris. The ultraviolet continuum at 1350 Å can be explained by H I 2-photon (2 – 1 ) emission from the same region. We confirm our earlier, tentative detection of N V 1240 emission from the reverse shock and present the first detections of broad He II 1640, C IV 1550, and N IV] 1486 emission lines from the reverse shock. The helium abundance in the high-velocity material is He/H = 0.14 0.06. The N V/H line ratio requires partial ion-electron equilibration (/ 0.14 – 0.35). We find that the N/C abundance ratio in the gas crossing the reverse shock is significantly higher than that in the circumstellar ring, a result that may be attributed to chemical stratification in the outer envelope of the supernova progenitor. The N/C abundance ratio may have been stratified prior to the ring expulsion, or this result may indicate continued CNO processing in the progenitor subsequent to the expulsion of the circumstellar ring.
Subject headings:
supernovae: individual (SN 1987A) — shock waves — circumstellar matter1. Introduction
Borkowski, Blondin, & McCray (1997) predicted that the spectrum of SN 1987A should display very broad ( 12,000 km s-1) emission lines of Ly, H, N V 1240, and He II 1640, produced where the freely expanding supernova debris crosses a reverse shock located inside the equatorial circumstellar ring. In September 1997, using the Hubble Space Telescope-Space Telescope Imaging Spectrograph (-STIS), Sonneborn et al. (1998) detected broad Ly emission, and Michael et al. (1998) showed how observations of this emission can be used to map the shape of the reverse shock and the flux of H I atoms crossing it. Michael et al (2003) and Heng et al. (2006) analyzed subsequent (February 1999 – October 2002) STIS observations of both Ly and H to map the increasing flux of H I atoms across the reverse shock.
The evolution of the broad H emission can also be tracked with ground-based telescopes, notably in February 2005 with the Magellan telescope (Smith et al., 2005) and from December 2000 to January 2009 with the Very Large Telescope (Fransson et al 2011). Smith et al. pointed out that the H emission from the reverse shock could be suppressed due to preionization of hydrogen in the supernova debris by soft X-rays and EUV radiation from the rapidly brightening shock interaction with the inner circumstellar ring. Extrapolating the X-ray light curve, they predicted that this preionization would cause the broad H emission to vanish by 2012. However, since 2005, the X-ray light curve has leveled off (Park et al., 2011), so the preionization effect should be less than that predicted by Smith et al.
France et al. (2010) analyzed the most recent (31 January 2010) STIS observations of SN 1987A. They pointed out that the observed ratio of Ly/H photon fluxes was 30 at large, negative velocities, much greater than the value 5 that would be expected for hydrogen atoms excited as they cross the reverse shock. Moreover, the spatially resolved Ly line profile differed dramatically from that of H. France et al. proposed that the broad Ly emission is dominated by Ly emission from the nearly stationary equatorial ring that has been resonantly scattered by hydrogen atoms in the expanding supernova debris. France et al. also noticed a faint glow at wavelengths ranging from about 1260 – 1290 Å, which they attributed to the N V 1240 emission predicted by Borkowski et al. They suggested that a critical test of that hypothesis would be detection of broad emission from C IV1550.
Here we describe far-ultraviolet (1140 – 1780 Å) spectra of SN 1987A obtained with the Cosmic Origins Spectrograph (COS) that was installed on in May 2009. With COS, we have measured the profiles of Ly and N V 1240 with signal-to-noise ratios (S/N) far superior to the previous STIS spectra. We have also detected the broad He II 1640 emission predicted by Borkowski et al. (1997) and the broad C IV 1550 emission predicted by France et al (2010). We find that while the He/H abundance ratio in the outer ejecta is consistent with that of the circumstellar ring, the N/C ratio is enhanced by more than a factor of two over the ring abundances.
2. -COS Observations, Imaging Spectroscopy, and Data Reduction
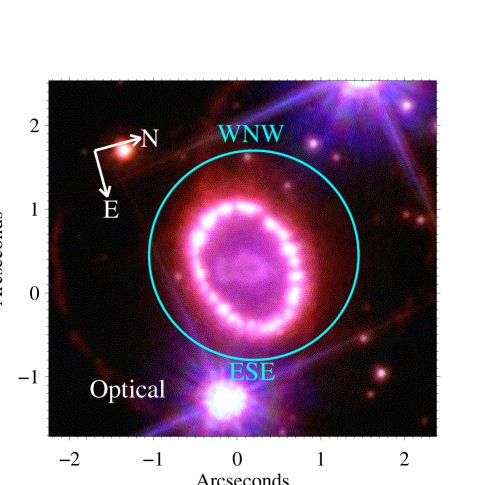
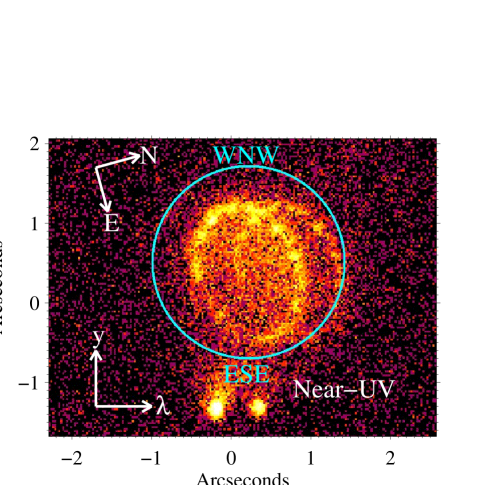
SN 1987A was observed with the medium resolution far-UV modes of -COS (G130M and G160M) on 2011 February 11 and March 14 for a total of 7 spacecraft orbits (18555 s; Table 1) as part of the Supernova 1987A INTensive Study (SAINTS - GO12241; PI - R. Kirshner). A description of the COS instrument and on-orbit performance characteristics can be found in Osterman et al. (2011). All observations were approximately centered on the SN 1987A circumstellar ring (R.A. = 05h 35m 28.07s, Dec. = -69°16′10.8″; J2000) and COS performed an offset imaging target acquisition from a reference star 8″ away. A NUV image was obtained with the MIRRORB imaging mode after the slew to the science pointing in order to verify that the circumstellar ring was in the primary science aperture (PSA). Figure 1 () shows the COS aperture location on an optical image of SN 1987A, The MIRRORB configuration introduces optical distortions into the image, but a first-order analysis indicates that the entire circumstellar ring was inside the 2.5″ diameter PSA (Figure 1, ).
The COS position angle was chosen to maximize the spatial separation on the COS detector between Star 3 and the supernova emission we aim to study. The G130M observations were made at a position angle of 75°, while the G160M observations were acquired with a position angle of 45°. Light from objects outside the nominal 1.25″ COS aperture radius can be recorded with the science spectrum in crowded fields. Star 3 is a far-UV-bright Be star (Gilmozzi et al., 1987; Walborn et al., 1993) separated from the center of the SN 1987A ring by 1.7″. Stellar contamination could compromise supernova data quality if the two objects overlapped on the spectroscopic detector. Thus, we used the imaging spectroscopic capability of COS to keep SN 1987A centered while placing Star 3 at the bottom of the microchannel plate (MCP) detector.
We complemented this observing strategy with post-processing techniques and custom spectral extractions to maximize the spatial resolution of the instrument in the cross-dispersion direction. Due to long-term exposure of the COS MCP to geocoronal Ly and hot-star spectra, the number of electrons generated by each incident photon at a given detector location has been decreasing. This is manifest as lower pulse heights observed by the detector electronics111We refer the reader to the cycle 19 COS Instrument Handbook for more details: http://www.stsci.edu/hst/cos/documents/handbooks/current/cos_cover.html. The exact form of the pulse-height evolution is a complicated function of the dispersion and cross-dispersion arrival location of the incident photon, but to first order we can approximate this as a pulse-height dependent mislocation of the photon -location. The approximate form of this mislocation is -0.47 pixels per pulse height bin drop. We have reprocessed the COS observations of SN 1987A, including a correction for the cross-dispersion misplacement, producing more accurate photon arrival positions. This additional data reduction step improves the far-UV angular resolution of the instrument by 20 – 30% across the bandpass.
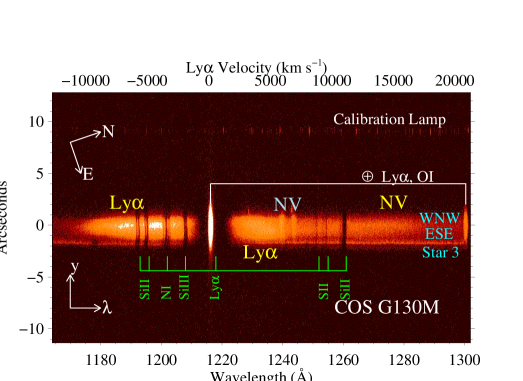
Star 3 can be seen at the bottom of the two-dimensional spectrogram shown in Figure 2. Star 3 is well isolated at the bottom of the detector. The angular resolution in the reprocessed two-dimensional data is 0.8″. This imaging capability allows us to make custom spectral extractions at three spatially resolved locations: the “WNW” region at the top of the detector (approximately centered on the hotspots at: R.A. = 05h 35m 27.98s, Dec. = -69°16′10.5″; J2000), the ”ESE” region towards Star 3 (approximately the telescope pointing coordinates), and a separate extraction of Star 3 itself. Star 3 contributes negligible flux to the one-dimensional WNW spectrum and less than 15% of the flux in the ESE extraction. The spatially resolved spectra will be analyzed in a future work, and we focus on the combined WNW + ESE spectra here.
The custom data extractions were then reprocessed with the COS calibration pipeline, CALCOS v2.13.6, and combined with the custom IDL coaddition procedure described by Danforth et al. (2010) and Shull et al. (2010). The coaddition routine interpolates all detector segments and grating settings onto a common wavelength grid, and makes a correction for the detector QE-enhancement grid. No correction for the detector hex pattern is performed. Data were obtained in four central wavelength settings in each far-UV grating mode (1291, 1300, 1309, and 1318 with G130M and 1577, 1589, 1600, and 1611 with G160M) at the default focal-plane split position. The instrumental configurations are summarized in Table 1. Observations at multiple wavelength settings provide continuous spectral coverage over the 1136 – 1782 Å bandpass and minimize the residual fixed pattern noise from the detector grid wires and the MCP pores. The point source resolving power of the medium resolution COS far-UV modes is / 18,000 ( = 17 km s-1); however, the filled-aperture resolving power is 1500 ( 200 km s-1; France et al. 2009). Multiple point sources within the aperture (e.g., the multiple hotspots along the SN 1987A circumstellar ring) produce spectral resolution that is similar to the extended source response. The point source flux calibration of COS is accurate to better than 3%; however, the extended source and custom processing limit the absolute flux calibration of the SN 1987A far-UV spectroscopic data to 10%.
3. Data Analysis
3.1. Emission Spectrum and Interstellar Corrections
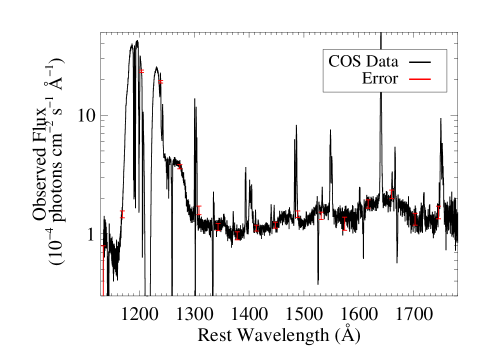
The extracted emission spectrum of SN 1987A is shown in Figure 3. The spectra presented here are shown in photon units as these are the natural units for line flux comparisons. There is a wealth of narrow and broad emission and absorption features in the spectrum as well as a strong underlying continuum. The “narrow” (FWHM 200 – 300 km s-1) resolved emission features are attributed to the circumstellar ring. The circumstellar ring spectrum is dominated by the hotspots which originate at shock interfaces where the forward blast wave encounters regions of high density in the circumstellar ring (Lawrence et al. 2000). A discussion of the ring-ejecta interaction is given by Larsson et al. (2011). Most of the circumstellar ring emission lines have been observed in previous -STIS (e.g., Pun et al. 2002) and (Lundqvist & Fransson 1996) observations, including N V 1239, 1243, C II 1334, 1335, Si IV 1394, 1403, the O IV] 1400 multiplet, N IV] 1483, 1486, C IV 1548, 1550, [Ne IV] 1602, He II 1640, O III] 1661, 1666, and the N III] 1750 multiplet. Our deep COS observations enable first detections of O V 1371 and Si II 1526, 1533, although the ground state transition of Si II is blocked by the interstellar medium. We also tentatively detect the coronal [Si VIII] doublet 1441, 1446. These features will be discussed in detail in a future work, though we will make use of the circumstellar ring line fluxes where relevant.
| Date | COS Mode | Central Wavelengths | FP-POS | Texp (s) |
|---|---|---|---|---|
| 2011 February 11 | G130M | 1291,1300,1309,1218 | 3 | 7884 |
| 2011 March 14 | G160M | 1577,1589,1600,1611 | 3 | 10671 |
The broad emission features observed in the spectrum of SN 1987A arise as atoms and ions cross the reverse shock front (Michael et al., 1998), located just interior to the circumstellar ring. H I Ly (and the corresponding H) emission from the reverse shock has been well studied (Michael et al., 2003; Smith et al., 2005; Heng et al., 2006; France et al., 2010), and we display the broad ( 13,000 – +7,000 km s-1) Ly emission seen in the COS observations in Figures 4 and 5. The second broad feature to the red of Ly in Figure 3 is consistent with the putative N V reverse shock emission described by France et al. (2010) and has a velocity distribution and total flux that are approximately consistent with those predicted by Borkowski et al. (1997); see also §4.3.1. In light of these results and the large relative offset from the observed Ly profile, we claim that reverse shock N V emission is unambiguously detected in our data (Figure 5). While at earlier times, low-ionization UV line emission from SN 1987A has been attributed to the debris in the core (Jerkstrand et al., 2011), the core is enshrouded in dust (Matsuura et al., 2011) and is mostly opaque to UV radiation. Therefore, the reverse shock is the most likely formation site for high-velocity UV line photons observed towards SN 1987A. Following similar line-identification arguments as those for N V, we also detect reverse shock emission from N IV] 1486, C IV 1550, and He II 1640 for the first time. These features are marked in Figure 6.
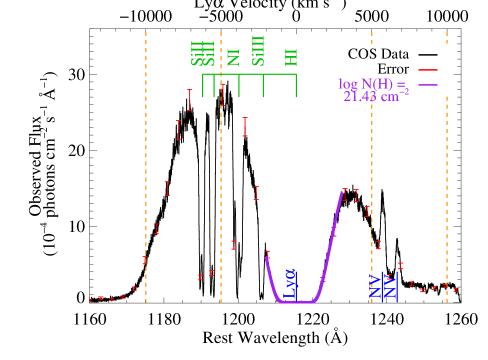
Figure 4 also shows an example of the broad and narrow interstellar absorption features imposed on the spectrum of SN 1987A. This figure shows Galactic and Magellanic Cloud absorption from Si II 1190, 1193, the N I 1200 multiplet, Si III 1206, and H I Ly. Other interstellar absorbers include S II 1250, 1253, Si II 1260, C II 1334, Si II 1526, Fe II 1608, and Al II 1670. We fit the interstellar neutral hydrogen absorption in the WNW spectrum as this provides the best measure of the foreground absorption, finding log10(N(H)) = 21.43 0.02 cm-2. For subsequent analysis of the Ly and N V emission, we divide the data by a model of this emission (shown in purple in Figure 4). This procedure renders unusable the inner 6 Å of the Ly line profile, which we remove from the data.
There are several estimates of the interstellar reddening towards the region of the LMC in which SN 1987A resides (Walker & Suntzeff, 1990; Fitzpatrick & Walborn, 1990; Scuderi et al., 1996; Michael et al., 2003). We adopt a Milky Way ( = 3.1) extinction curve (Cardelli et al., 1989) with = 0.19 as this curve approximates the average extinction correction favored by the studies cited above. This curve also closely approximates the far-UV properties of the average LMC curve presented by Gordon et al. (2003) for = 0.6. Assuming = 0.17 (Michael et al., 2003), would lower the fluxes derived in subsequent sections by 15%. Scuderi et al. (1996) present a comprehensive study of the extinction towards Star 2, and the use of this curve would result in fluxes 20 – 30% larger than those derived below. None of the possible extinction curves significantly alters the shape of the continuum (§4.1.1) or the far-UV line ratios (§4.3.3).
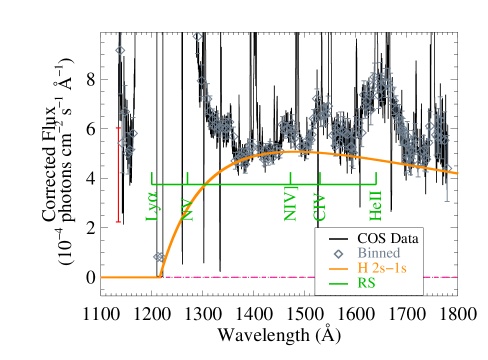
The bright continuum ((observed) 1 10-4 photons cm-2 s-1 Å-1) underlying the hotspot and reverse shock emission was suggested in coadded STIS G140L spectra from 2010, cospatial with the circumstellar ring. However, the significance of the detection was low. We propose that this continuum is mostly H I 2-photon emission (§4.1.1).
3.2. Binned Spectrum for Broad Line & Continuum Analysis
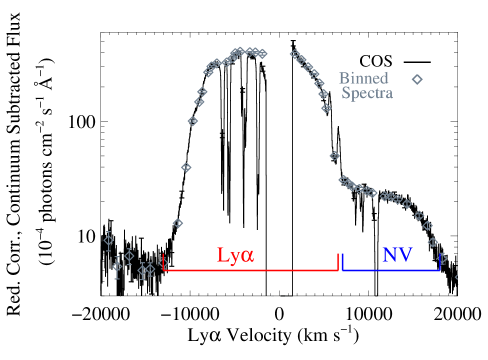
Narrow emission lines, as well as the narrow interstellar absorption components, complicate measurements of the continuum and broad emission from the reverse shock. In order to remove confusion from these narrow lines during the analysis of the broad spectral features, we created binned spectra of the WNW and ENE extractions. These binned spectra were centered on hand-chosen regions of the data at 1 – 5 Å intervals and were free of narrow features. The flux and error of these binned data points were taken to be the average flux and standard deviation of a 0.8 Å region centered on the selected wavelength. These binned data are shown as diamonds overplotted on the spectra in Figures 5 – 8.
We quantify the total reverse shock flux by integrating the binned spectra over wavelength intervals corresponding to the velocity ranges of interest for a given feature. The velocity ranges were chosen to cover the maximum extent of a given line without significantly overlapping with other reverse shock emission features. The inner approximately 3000 km s-1 were not included to avoid strong hotspot emission lines located at 0 km s-1. In most cases the hot spot lines are doublets, therefore a velocity interval larger than the nominal 300 km s-1 narrow line-width was excluded. We were unable to measure two reverse shock components due to velocity blending. The blue component of the N V line is lost under the Ly line, and the weak red wing of the N IV] emission is overwhelmed by the stronger blue C IV emission. The velocity and wavelength intervals are given in Table 2 with the summed line fluxes.
4. Results
4.1. Hydrogen: 2-photon Emission and Broad Ly
4.1.1 H I Continuum
Figure 3 shows that the emission and absorption lines are superposed upon a far-UV continuum with 10-4 photons cm-2 s-1 Å-1. This continuum was marginally detected in previous STIS G140L spectra, with the emission being concentrated in the ring plane. It is detected in our COS observations at high significance, ( / ) 8 per spectral resolution element from 1360 – 1540 Å.
We can rule out the possibility that this emission is uncorrected scattered light from Star 3. As described in Section 2, care was taken to isolate the emission from Star 3 at the bottom of the MCP detector (Figure 2). At the observed continuum levels, the scattered light from Star 3 would have to be over twice as bright outside of the stellar extraction region as within it, and relatively constant with angular separation from the stellar spectrum. Additionally, the observed continuum of Star 3 has a different spectral shape than the supernova continuum and there is no evidence for stellar features in the supernova spectrum (such as photospheric and wind absorption lines of C III 1175 and Si IV 1394, 1403; Pellerin et al. 2002). Therefore, we consider it unlikely that Star 3 contributes more than 10% to the supernova continuum at 1350 Å.
We propose that this continuum is predominantly H I 2-photon (2 – 1 ) emission. We fit the 1350 1720 Å spectrum with the analytic formula of Nussbaumer & Schmutz (1984),
| (1) |
where is the emissivity and is the H I column density in the state. This function rises sharply from 1216 Å to a maximum at 1420 Å, and then declines slowly to the red. The 2-photon spectral model is shown in orange in Figure 6. Based on our near-UV images, we estimate that the circumstellar ring fills approximately 30 20% of the inner 2″ of the COS aperture where the transmission is 0.6. Assuming this filling fraction, the continuum level determines the column density, and we find log10((H)) = 21.34 cm-2.
The total integrated (1216 Å – 6 m) H I 2-photon flux is 9.1 0.6 10-1 photons cm-2 s-1, and the observed ratio of Ly line emission to 2-photon is (Ly)/(2) = 1.96 0.23. Since this ratio is consistent with the 2/2 ratio of 2.1 (observed as (Ly)/(2)) expected for recombination at 104 K (Spitzer, 1978) and the (1 2)/(1 2) ratio of 2.05 – 2.10 expected for excitation by thermal electrons (Callaway, 1988), we infer that it is likely that the Ly and the 2-photon emission come from the same source.
An important constraint on the origin of the far-UV continuum is the density of the emitting region. H I 2-photon emission can be suppressed by a factor due to collisional depopulation of the 2 state, where the critical density is given by and is the density of protons. The (2 2) collision rate coefficient is = 5.31 10-4 cm3 s-1 (Seaton 1955; see also Dennison et al. 2005 for a discussion of 2 and 2 level populations in H II regions) and 8.23 s-1 for the 2-photon decay (Klarsfeld, 1969), therefore = 1.5 104 cm-3.
Based on the observed 2-photon flux, we can predict the total amount of associated H if this emission is predominantly recombination. In Case B recombination, the rate of population of the state is 3.3 times the rate of emission of H (Osterbrock & Ferland, 2006). The expected H in this scenario is 2.8 10-1 photons cm-2 s-1. We have made an estimate of the total H flux from the circumstellar ring by analyzing STIS G750M spectra obtained in 2009 October ( exposure IDs OB7I200A0 – OB7I200D0), making a correction for differential reddening between H and the 2-photon emission. The total H emission from the ring is 2.5 10-1 photons cm-2 s-1, very close to the value expected if the 2-photon emission was produced by recombination. However, Gröningsson et al. (2008b) find that the H flux from the ring is dominated by high-density ( 4 106 cm-3) shocked material around 5700 days after the explosion (October 2002). 2-photon emission could be highly suppressed from such gas, which has 300. 2-photon emission from lower density ( 5 103 cm-3; Matilla et al. 2010) gas in the unshocked ring would not be suppressed, but such gas can only account for 20% of the observed 2-photon emission.
Because we observe no comparable source of H emission, we conclude that the majority of the 2-photon emission is produced not by recombination, but by thermal ( 104 K) electron impact excitation of the state of neutral hydrogen atoms in the outer ejecta, near the reverse shock front. This low-density gas ( 100 cm3; Smith et al. 2005; Heng et al. 2006) is heated by X-rays emitted from the shocked gas near the hotspots. In particular, the energy deposition of the soft X-ray/EUV photons from the shocked hotspots will be concentrated in a layer near the reverse shock (Fransson et al. 2011). When the ionization fraction is 3 10-2, the majority of the X-ray energy heats the gas through Coulomb stopping of fast photoelectrons (Xu et al., 1992; Kozma & Fransson, 1992). The primary coolants for this gas are Ly and 2-photon emission.
Is it reasonable to expect this level of X-ray heating of gas near the reverse shock? We calculate the total X-ray flux from the circumstellar ring using the two-component model spectrum of Zhekov et al. (2006), scaled to the total 0.5 – 2.0 keV luminosity observed by near day 8000 ((0.5 – 2.0 keV) 1.5 1036 erg s-1; Racusin et al. 2009). The total 2-photon luminosity is (2) 2.2 1036 erg s-1, therefore the 0.5 – 2.0 keV X-ray flux is insufficient to power the far-UV continuum. However, the total shock luminosity is most likely dominated by emission in the soft X-ray/EUV band (0.01 – 0.5 keV) that is attenuated by the neutral hydrogen in the interstellar media of the Milky Way and LMC (Fransson et al. 2011). The luminosity in this band inferred from the model by Zhekov et al. is (0.01 – 0.5 keV) 3 1038 erg s-1. Assuming that roughly half of this emission intersects the outer ejecta, we find that approximately 1.4% of the soft X-ray/EUV luminosity from the shocked ring must be reprocessed into H I 2-photon emission.
4.1.2 H I Line Emission
Figures 4 and 5 show the broad emission from H I Ly. This emission was first observed in -STIS spectra 10.25 years after the SN 1987A explosion (Sonneborn et al., 1998). Subsequent studies have explored the reverse shock Ly and H emission in more detail (Michael et al., 1998, 2003), including its brightening and deceleration (Heng et al. 2006; see also Smith et al. 2005 and Fransson et al. 2011 for discussion of the H evolution). The combination of increased sensitivity and spectral resolution and low instrumental background of COS enable us to produce the highest-quality ultraviolet velocity profiles of the reverse shock emission to date. The velocity distribution of the neutral hydrogen emission extends from 13000 – +8000 km s-1 (Figure 5). The velocity maxima are much smaller than the initial observations by Sonneborn et al. (1998; 20000 km s-1) and are consistent with the decrease in maximum projected velocity observed from 2004 to 2010 (France et al., 2010). Using the limited angular resolution of COS, we confirm that emission at negative velocities is concentrated towards the northern side of the circumstellar ring while positive velocities are concentrated on the southern side of the ring. The total integrated (12000 – +8000 km s-1) Ly flux inferred from Figure 5 is 1.78 0.18 photons cm-2 s-1.
Previous work noted that the Ly/H ratios from the reverse shock exceed the 5:1 photon production ratio expected for a Balmer-dominated shock (Heng et al., 2006; Heng & McCray, 2007). France et al. (2010) found Ly/H ratios 30 from 8000 – 2500 km s-1 and 20 from +3000 – +7000 km s-1 for isolated cuts across the northern and southern sides of the reverse shock, respectively. They attributed the enhanced Ly emission to a second source of Ly photons. They argued that Ly photons from the hotspots are resonantly scattered by onrushing hydrogen with a distribution of velocities spanning a width 3000 – 9000 km s-1 (unlike Ly, H is not a resonance line and therefore hotspot H photons pass through the debris freely).
While the Ly enhancement at the largest negative velocities can likely be explained by this mechanism, our preceding discussion of the 2-photon continuum suggests that the majority of the lower velocity ( 7000 km s-1) Ly excess is attributable to the X-ray heating of the outer supernova debris. As described above, Ly is the primary coolant for mostly neutral hydrogen-rich gas excited by soft X-ray/EUV photoelectrons, and the agreement between the observed and theoretical (Ly)/(2) ratio therefore argues that thermal electron collisions dominate the production of Ly photons in the outer ejecta near the reverse shock front. Resonant scattering will cause the newly produced Ly photons to emerge preferentially in the outward direction, substantially favoring the blue-shifted wing as observed.
| Species | aa = 0 assumed to be the rest wavelength of the stronger lines of the N V and C IV doublets. | Line Flux | Flux Uncertainty | |
|---|---|---|---|---|
| (Å) | (km s-1) | (photons cm-2 s-1) | (photons cm-2 s-1) | |
| H IbbCorrected for interstellar neutral hydrogen absorption of log10(N(H)) = 21.43, however the inner 6 Å ( 1500 km s-1) cannot be reconstructed. All reverse shock fluxes have been corrected for interstellar dust extinction, assuming = 0.19 and = 3.1. | 1169.6 – 1208.0 | -12000 – -1500 | 1.1 100 | 5.9 10-3 |
| H I | 1222.8 – 1247.1 | 1500 – 8000 | 4.5 10-1 | 4.1 10-3 |
| N VccBlue N V flux is overwhelmed by reverse shock Ly emission and interstellar H I absorption. We assume the N V Blue/Red ratio is the same as the He II reverse shock emission ( 0.7). | 1197.9 – 1233.9 | -10000 – -1000 | 5.7 10-2 | 6.2 10-3 |
| N V | 1247.1 – 1285.5 | 2000 – 12000 | 8.0 10-2 | 8.7 10-4 |
| N IV] | 1428.3 – 1478.8 | -12000 – -1500 | 1.8 10-3 | 4.9 10-4 |
| N IV]ddRed N IV] flux is obscured by the stronger blue emission from C IV. | 1497.0 – 1523.8 | 1500 – 8000 | ||
| C IV | 1491.9 – 1539.4 | -12000 – -1500 | 4.6 10-3 | 5.4 10-4 |
| C IV | 1558.9 – 1584.6 | 1500 – 8000 | 2.1 10-3 | 4.8 10-4 |
| He II | 1590.4 – 1633.7 | -10000 – -1000 | 6.8 10-3 | 7.8 10-4 |
| He II | 1658.0 – 1705.0 | 2000 – 12000 | 9.6 10-3 | 8.1 10-4 |
4.2. He II 1640 Emission
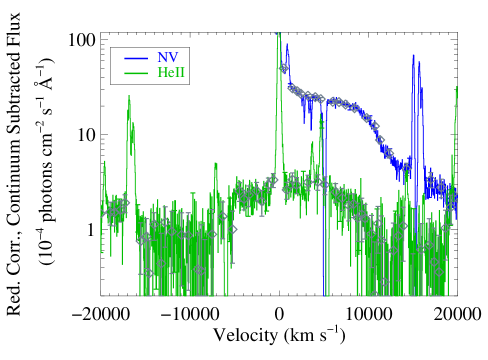
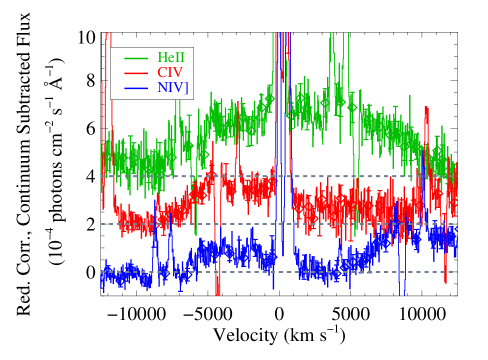
The broad emission feature that we attribute to He II 1640 from the reverse shock is easily visible above the 1600 – 1700 Å continuum in Figure 6. In Figure 7, we compare the He II velocity profile with the red side of the N V 1240 (§4.3.1) profile. As neutral or singly ionized helium crosses the reverse shock, collisions with thermal electrons (Laming et al., 1996) cause the helium to emit the analog to H. The velocity distribution of the ionized helium is expected to be quite different from that of neutral hydrogen because the He+ ions that have crossed the reverse shock will be deflected by turbulent magnetic fields in the shock isotropization zone (Michael et al., 1998). The broad He II displays a somewhat asymmetric line shape, spanning approximately 9000 – +11000 km s-1.
Interpolating the integrated red and blue reverse shock He II 1640 photon fluxes given in Table 2 through the narrow emission lines222The total emission from the reverse shock is interpolated through the central region lost to narrow-line emission. In the case of He II, = (1 + (3000/22000)) ( + )., we measure a total flux of 1.9 10-2 photons cm-2 s-1. Because this line is the hydrogenic analog to H, the (1640)/(H) ratio should give a direct measure of the relative abundance of helium (by number), assuming full hydrogen and helium ionization and that our line identification and continuum subtraction are correct. We compare our He II measurement with the H flux from the day 8000 VLT-UVES observations presented by Fransson et al. 2011, (H) 1.4 10-13 erg cm-2 s-1. We convert this value into a total reverse shock H by applying a factor of 1.86 slit correction, a factor of 1.45 reddening correction at H (Gröningsson et al., 2008a), and a factor of 24/22 to account for the relative time of observation after the explosion. The integrated H photon flux in 2011 is 0.14 photons cm-2 s-1. The He/H abundance ratio in the reverse shock is 0.14 0.06, in agreement with the He/H abundance ratio derived by Mattila et al. (2010) for the circumstellar ring. The fact that the He II 1640/H ratio reproduces the circumstellar ring He/H abundance ratio suggests that the neutral hydrogen pre-ionization predicted by Smith et al. (2005) is negligible 22 years after the explosion.
Borkowski et al. (1997) predicted the time evolution of the observable (accounting for attenuation due to interstellar reddening) reverse shock flux in several abundant ions, including He II. Their predictions only extend to 2007, but we can extrapolate their curves to 24 years after the explosion for comparison with the COS data. We estimate their prediction for the observed He II flux in 2011 to be 1 – 3 10-3 photons cm-2 s-1 from Figure 4 of Borkowski et al. (1997). Correcting these values by a factor of 4 to account for interstellar reddening, their prediction for the He II flux is 0.4 – 1.2 10-2 photons cm-2 s-1, only a factor of 2 below the He II flux observed by COS. Differences between the predicted and observed He II fluxes are likely due to assumed electron temperatures that are lower than suggested by the observations (see the next subsection).
4.3. Carbon and Nitrogen Emission Lines
4.3.1 N V 1240
Prior to the first STIS observations of SN 1987A, Borkowski et al. (1997) predicted that strong reverse shock emission from Li-like N V 1240 would be detectable. This emission was not apparent, however, in the first deep far-UV STIS spectra presented by Sonneborn et al. (1998) and Michael et al. (1998). In recent (January 2010) STIS observations, we tentatively detected broad, redshifted N V emission (Figure 3 of France et al. 2010), but low S/N precluded a detailed analysis. Now, in our COS observations, we unambiguously detect this emission. While the blue wing of the line is lost under the bright Ly emission, we observe the complete red wing of the N V 1240 velocity profile. In Figure 7, we compare the line profile of N V with that of He II, observing that the red wings of the two profiles are qualitatively similar. Both ions present a boxy line profile, with a flat top and fall off between +9000 – +10000 km s-1. The N V profile extends to at least +14000 km s-1, where the data are contaminated by the geocoronal O I triplet.
At the relevant energy scales of nonradiative supernova shocks, 103 km s-1, the excitation cross sections for Li-like species (e.g., C3+, N4+, O5+) by collisions with protons and heavier ions are considerably larger than the cross-section for ionization to their He-like stage (Laming et al., 1996; Borkowski et al., 1997). Therefore, these species may emit many (several hundred) line photons (predominantly C IV 1550, N V 1240, O VI 1032 for the ions listed above) for every atom that crosses the reverse shock front before becoming ionized. The total ratio of N V 1240 photons emitted to H is given by
| (2) |
where 0.2 is the number of H photons emitted per neutral hydrogen atom crossing the shock (Michael et al., 2003), is the nitrogen abundance ratio, is the rate of electron and ion impacts that result in N V emission, and is the rate of ionization to N5+. The relative nitrogen abundance in the circumstellar ring is 2.8 ( 1.1) 10-4 (Mattila et al., 2010). Given the similarity of the red side of the He II and N V profiles, we compute the total N V reverse shock photon flux by assuming that the relative red/blue contribution is the same as He II (Table 2) and interpolating through the narrow emission lines, as described above. Under these assumptions, the observed (N V)/(H) ratio is 1.15. Folding in the nitrogen abundance, we can therefore make a rough estimate of the ratio / 850 required to explain the observed line ratio.
can be evaluated analytically,
| (3) |
where the cross-sections, , are for excitation of N V 1240 by electrons, protons, and alpha particles, respectively. We simplify the averages over velocity distribution by evaluating the expression at a single shock velocity, = 104 km s-1. Cross-sections for the proton and alpha particle collisions are taken from Table 2 of Laming et al. (1996) for proton energies ( = 1/2 ) of 522 keV (we assume the 544 keV values) and alpha particle energies ( = 1/2 (4) of 2088 keV (we assume 1.2 times the 2720 keV values). The electron impact excitation cross-sections are not as well determined, but we expect them to be similar to those of the protons at high shock velocity. Therefore, we estimate = [4.31, 4.31, 14.4] 10-17 cm-2, respectively. Taking = 450 cm-3 (Borkowski et al., 1997), 100 cm-3 (Smith et al., 2005; Heng et al., 2006), and = 0.17 (Mattila et al., 2010), we compute a total N V excitation rate for = 104 km s-1; = 2.6 10-5 s-1.
Ionization rates by baryons are expected to be small compared to those by electrons due to the high energy of post-shock protons and heavier species (Laming et al., 1996), therefore we neglect their contribution to the N4+ ionization rates. Cross-sections for the direct ionization to N5+ by thermal electrons can be calculated as a function of electron energy from Equation 1 of Arnaud & Rothenflug (1985). Using coefficients for the Li-sequence (their Table 1), we calculate an electron ionization cross-section of = 1.5 10-18 cm-2 at = 107 eV333 = . The direct ionization rate, = = 1.5 10-7 s-1. This gives / 170, which is outside the range allowed by the observations.
If, on the other hand, there is partial equilibration between the electron and proton distributions (Cargill & Papadopoulos, 1988; Laming et al., 1996; Heng, 2010), then = , where
| (4) |
and is the equilibration factor, which has a maximum value of 1. is the mean particle weight, 0.55 (for = 0.85, = 0.14, and = 0.01). In this case = 1/2 (2 / ) = . Using this energy to calculate the ionization cross-sections, we find that for = 0.14 – 0.35 ( = 1.7 – 4.4 108 K), the electron ionization cross-sections = 9.7 – 4.2 10-20 cm2, and the ionization rates of = 4.3 – 1.9 10-8 s-1. This gives / 610 – 1380, approximately the range required to account for the observed (N V)/(H) ratio444We note that if we assume that the ionization cross-sections scale as in the high- limit, then the ion-electron equilibration factor could be a factor of 2 – 3 higher, approaching the limit of complete equilibration.. = 104 km s-1 is used as the fiducial velocity in our calculations, but the general conclusions hold for a range of possible shock velocities. Computing / for velocities (5 – 12) 103 km s-1, we find that decreases by 50% across this range, but 0.1 is required to explain the data for all velocities considered.
It seems clear that partial ion-electron equilibration is required to explain the observation of strong reverse shock N V emission from SN 1987A. However, values of = 0.14 – 0.35 are greater than those favored by Laming et al. (1996) from their non-radiative shock modeling of SN1006. Moreover, equilibration values of 0.1 for the high shock velocity ( 104 km s-1) in SN 1987A are inconsistent with some recent results on electron-ion equilibration in collisionless shocks. Ghavamian et al. (2007) discuss a sample of older ( 103 yr) supernova remnants whose electron-to-proton temperature ratio is inversely proportional to the square of the shock velocity, ; however, this relation has not been confirmed in subsequent work (Helder et al., 2011). Additionally, van Adelsberg et al. (2008) present evidence suggesting an increasing for 2000 km s-1. Finally, we note that very high electron temperatures ( 109 K) were inferred for the high velocity ejecta in SN 1993J (Fransson et al., 1996), suggesting that electron heating may be efficient in high velocity environments (see §5.3).
We also compare the observed N V flux with that predicted by Borkowski et al. (1997). Extrapolating their prediction to the time of our observations, we would have expected (1.5 – 2.0) 10-13 erg cm-2 s-1 in 2011, or 0.06 – 0.08 photons cm-2 s-1 after including a factor of 6.3 to account for interstellar reddening. We see that, similar to the prediction for He II, these values are a factor of 2 below their observed 2011 values ((N V) = 0.16 photons cm-2 s-1). Overall, we consider the prediction made 14 years prior to the observation to be remarkably good. The slight differences between the predicted and observed N V flux can most likely be attributed to their choice of a value for that is lower than we determine from the data. Lower electron energies increase the ionization cross-section and hence , thereby reducing the total number of N V photons emitted.
4.3.2 N IV] 1486
Figure 6 shows that there is considerable substructure on the continuum in addition to the strong reverse shock emission from H I, He II, and N V. The weakest of these features spans 1430 – 1500 Å. We attribute this emission to N IV] 1486 from the reverse shock. The N IV] emission is highly asymmetric about the rest velocity. The blue-shifted component extends to roughly 8000 km s-1, while the red side of the profile is at the noise level by +3000 km s-1. Additionally, the blue wing of the reverse shock C IV profile, discussed in the next section, overwhelms any additional red flux. Again making the assumption that the red/blue N V ratio is the same as that for He II, and assuming that the red side of the N IV] profile contributes an additional 20% to the total flux, we find that the total (N V)/(N IV]) ratio is 72 17.
4.3.3 C IV 1550
Figure 6 also shows C IV 1550 from the reverse shock covering 1500 – 1580 Å, with emission from 12000 – 1500 km s-1 having 2.2 times the total integrated photon flux as the +1500 – +8000 km s-1 interval (Table 2). The red side of the velocity profile is only marginally above the noise level at +3000 km s-1. We consider the relative fluxes of C IV and N V here, and in the next section we will discuss the relative velocity distributions of the reverse shock species.
Interpolating the spectrum through the narrow emission lines, we measure an integrated broad line photon flux (12000 – +8000 km s-1) of (C IV) = 7.7 10-3 photons cm-2 s-1. With the previously-noted assumptions about the N V flux in mind, we find a flux ratio of (N V)/(C IV) 20 3. The ratio of N V 1240/C IV 1550 is given by an expression similar to equation (2):
| (5) |
The ratio of the quantities in square brackets is very close to 0.9 for = (5 – 12) 103 km s-1 (the ratio is near unity because both are Li-like ions). That implies that the abundance ratio of nitrogen/carbon atoms crossing the reverse shock is / 22 3, greater than the ratio / 8.5 3.5 inferred from spectroscopic observations of the equatorial ring (Lundqvist & Fransson 1996; Mattila et al. 2010).
We note that while our estimate of the flux ratio N V 1240/C IV 1550 is somewhat uncertain because our choice of the blue side of the N V profile is speculative, the integrated flux in the red side of the N V profile alone is more than 10 times greater than the C IV flux. Therefore, we are confident that the N V/C IV ratio is enhanced well beyond what can be attributed to the circumstellar ring abundances of the two species. We return to this point in Section 5.4.
5. Discussion
5.1. Relative Velocity Distributions
In Sections 4.2 and 4.3, we describe the velocity distributions of He II, N V, N IV], and C IV. The red side of the N V velocity profile is compared with He II in Figure 7 and a comparison of the He II, N IV], and C IV velocity profiles is shown in Figure 8. We observe qualitatively different velocity profiles from He II, N IV], and C IV. He II displays a mildly asymmetric profile spanning 9000 – +11000 km s-1, while N IV] and C IV are strongly weighted towards the blue, spanning (9000 – 8000) – +3000 km s-1. Peculiar geometric projection of the velocity can be ruled out because all three ions were observed with the G160M instrument mode, with a constant spacecraft roll orientation.
In nonradiative shocks, He II is thought to be excited by collisions with electrons, while the Li-like species (N V and C IV) are excited by ion-collisions (Laming et al., 1996). As we have shown above, the electron and ion distributions have likely not equilibrated in the SN 1987A debris, therefore it may be that the relative distributions of the impacting species is reflected in the velocity profiles of the excited ions. One might also speculate that if ion collisions dominate the emission from metals, the preferentially blue N IV] and C IV profiles would reflect an asymmetric spatial distribution of the protons and ions. The N IV] and C IV profiles also show spatial variations between the WNW and ENE spectra. In contrast, the He II profile, which is primarily excited by electrons, is more spatially and spectrally symmetric. This may indicate a more uniform distribution of electrons. With these possibilities in mind, one is tempted to separate the metals from the helium, however we observe N V extending to red velocities as high as +10000 km s-1 before declining. Modeling of both the fluxes and velocity distributions of ions in the SN 1987A reverse shock would be very useful for our understanding of the observed velocity profiles.
5.2. Excess Emission at 1350 Å
The high throughput and low instrumental background of COS have allowed us to study the ultraviolet continuum of SN 1987A for the first time. Similarly, we have presented the first conclusive observation of elements heavier than hydrogen in the reverse shock. Figures 3 and 6 show that there is additional ultraviolet continuum at 1350 Å, above which we propose that hydrogen 2-photon emission can adequately explain the data. As we discuss in §4.1.2, the spectral contamination from Star 3 is inversely proportional to wavelength, as the cross-dispersion astigmatism height is largest at the shortest wavelengths. This could account for some, but probably not all, of the bluest continuum emission. Instead, we propose four speculative possibilities for this emission. He+ has a 2 1 Ly line at 304 Å, and will emit a 2 1 2-photon continuum which peaks at 355 Å, and declines to the red. We estimate that this emission contributes 10% of the 1150 Å continuum.
There may be an additional Ly component at very high velocities, although this would require 30 103 km s-1 ( 0.1 ) to account for the reddest observed emission. Another possibility is that low-ionization line emission from the core, as opposed to higher-ionization emission from atoms crossing the reverse shock, contributes to the 1350Å emission. Jerkstrand et al. (2011) describe 2-photon emission, scattered by low-ionization, high-opacity metal lines in the core, contributing to the observed spectrum at 8 years following the explosion. The observed excess begins at roughly the wavelength of the O I] 1356 Å emission line. If an appreciable amount of low-ionization metal emission escapes from the near side of the core , it may be responsible for a portion of the observed flux.
Perhaps the most likely scenario is one in which several minor reverse shock species contribute to the observed continuum between 1140 – 1350 Å. We have seen that reverse shock emission from Be-like ions (e.g. NIV] 1486) are present. Therefore, emission from lines of C III 1175 and O V 1371 may also contribute555O V is the next ionization stage down from the Li-like O VI 1032 line which we do not detect, but is presumably in the reverse shock spectrum at shorter wavelengths..
5.3. Partial Ion-Electron Equilibration in SN 1987A: Evidence for the Cross-Shock Potential?
In Section 4.3.1, we found that large ion-electron temperature equilibration ratios ( 0.14 – 0.35) are required to explain the high N V 1240 flux observed in the spectrum of SN 1987A. Ghavamian et al. (2007) predict equilibration ratios several times less than this for shock velocities observed in SN 1987A ( 104 km s-1). Therefore, we consider additional electron heating mechanisms that could explain the observed N V emission. One mechanism that has been proposed for collisionless shocks (usually assumed to be quasi-perpendicular) at low Alfvén mach numbers () is the cross-shock potential (e.g Balikhin et al., 1993). But the cross-shock potential is expected to become less important as increases because the plasma resistivity causes insufficient dissipation and the shock becomes unsteady (Edmiston & Kennel, 1984). Electrons undergoing drift across the shock front are not guaranteed to see the same cross-shock potential. They may lose energy as well as gain it, and this limits the electron heating.
However, it has also been suggested that at Alfven Mach numbers appropriate to shocks in supernova remnants, the shock transition becomes thin. The shock transition can develop a length scale less than the electron convective gyroradius, thus eliminating any drift within the shock. This onsets at = , and electron heating by the cross shock potential again becomes viable (Balikhin et al., 1993; Gedalin et al., 2008). Typical SNR shocks have much higher than this, neglecting any modification of the preshock medium. Yet the predicted heating is not observed. Most likely, at these shocks is much lower than expected due to amplification of the magnetic field by cosmic rays streaming ahead of the shock (Bell, 2004, 2005). Electron heating in these systems occurs via plasma waves excited upstream by shock reflected ions or cosmic rays. At higher velocity shocks, or for those likely to have weak upstream magnetic field due to their environment and/or insignificant cosmic ray populations, and the cross-shock potential may be capable of heating electrons to the required energy. Therefore the energetic environment of SN 1987A, especially at its reverse shock, may enable additional electron heating mechanisms that do not contribute in lower systems.
5.4. The N V/C IV Ratio
The final unresolved issue is the large N V/C IV ratio in the reverse shock emission. Carbon and nitrogen abundance ratios in the circumstellar ring suggest this number should be 8 (Lundqvist & Fransson, 1996; Mattila et al., 2010), however the observed flux ratios indicate N/C 22. It may be that the N/C abundance ratio in the outer envelope of the progenitor was stratified prior to the ejection of the circumstellar rings, and that we are now seeing the first observational evidence of that stratification. A second possibility to account for this discrepancy is that ongoing thermonuclear processing continued to convert C to N in the supernova progenitor following the circumstellar ring ejection. The CNO bi-cycle will enrich the 14N abundance at the expense of the abundances of 12C and 16O and, in equilibrium, will convert almost all of the primordial C and O into N (Caughlan & Fowler, 1962). CNO processing has been invoked to explain the fact that the observed nitrogen abundance in the circumstellar ring is elevated by a factor 10 over its value in the LMC (Fransson et al., 1989). Our observation that the He abundance does not change between the ring and reverse shock is qualitatively consistent with the 14E1 model presented by Shigeyama & Nomoto (1990). They show that the high-velocity material we observe crossing the reverse shock front is only a small fraction of the total ejected mass, and does not probe deep enough into the interior of the ejecta to observe significantly elevated He abundances.
If CNO processing continued near the stellar surface following the ejection of the circumstellar rings, it could have in principle converted most of the remaining C and O abundances seen in the equatorial ring into N. Heng et al. (2008) note reduced oxygen abundances, possibly related to the high N V/C IV ratio observed in our observations. For this explanation to be viable, the timescale to reach equilibrium in the CNO cycle must be 20,000 years, the interval since the ejection of the equatorial ring. This condition will be met if the temperature of the shell where CNO burning takes place is 3.5 107 K (Caughlan and Fowler 1962, Table 4). This effect could not only account for the high N/C ratio in the gas crossing the reverse shock, it could also increase the N/H ratio by an additional factor of 2. This would lower the required derived in §4.3.1.
6. Conclusions
We have presented an analysis of deep -COS spectroscopy of SN 1987A. Below, we summarize our primary results.
-
1.
We observe narrow lines from shocked gas in the circumstellar ring, broad emission lines from the reverse shock, and a strong detection of ultraviolet continuum emission. Several of the emission line species and the far-UV continuum are conclusively detected for the first time.
-
2.
The asymmetry in Ly profile and its enhancement relative to H suggests that most of the Ly emission is a result of the illumination of the outer supernova debris by soft ( 0.5 keV) X-rays emitted by the shocked circumstellar ring.
-
3.
The 1350 Å continuum may be described by hydrogen 2-photon emission originating in the outer ejecta, near the reverse shock front.
-
4.
We present resolved velocity profiles of He II, C IV, N IV], and N V from the reverse shock. A comparison of the velocity integrated He II and H velocity profile indicates a He/H abundance ratio of 0.14 0.06. In order to reproduce the observed (N V)/(H) line ratio, partial ion-electron equilibration is required, = , with 0.14 – 0.35. Large values of may be explained by additional electron heating by the cross-shock potential.
-
5.
The velocity profiles of C IV and N IV] are significantly different from that of He II, which may be related to the different excitation processes (ion vs. electron collisions) for the different species.
-
6.
We observe additional continuum emission at 1350 Å that is not readily explained. We favor a scenario where several weaker emission lines contribute, but spectral overlap with the much stronger Ly and N V emission profiles prevents an unambiguous interpretation.
-
7.
Finally, we observe that the C IV reverse shock emission is weaker than would be expected assuming circumstellar ring abundances. This may be explained by chemical stratification in the outer envelope of the progenitor, and may indicate additional CNO processing between the period of circumstellar ring ejection and the supernova explosion.
1 – Center for Astrophysics and Space Astronomy, University of Colorado, 389 UCB, Boulder, CO 80309; kevin.france@colorado.edu
2 – JILA, University of Colorado and NIST, 440 UCB, Boulder, CO 80309
3 – Harvard-Smithsonian Center for Astrophysics, 60 Garden Street, MS-78, Cambridge, MA 02138, USA
4 – Naval Research Laboratory, Code 7674L, Washington, DC 20375, USA
5 – Service d’Astrophysique DSM/IRFU/SAp CEA - Saclay, Orme des Merisiers, FR 91191 Gif-sur-Yvette, France
6 – Department of Astronomy, University of Virginia, P.O. Box 400325, Charlottesville, VA 22904-4325, USA
7 – Department of Astronomy, The Oskar Klein Centre, Stockholm University, 106 91 Stockholm, Sweden
8 – 225 Nieuwland Science, University of Notre Dame, Notre Dame, IN 46556-5670, USA
9 – ETH Zürich, Institute for Astronomy, Wolfgang-Pauli-Strasse 27, CH-8093, Zürich, Switzerland
10 – Department of Physics and Astronomy, Hofstra University, Hempstead, NY 11549, USA
11 – Space Telescope Science Institute, 3700 San Martin Drive, Baltimore, MD 21218, USA
12 – INAF/CT, Osservatorio Astrofisico di Catania, Via S. Sofia 78, I-95123 Catania, Italy
13 – Supernova Ltd, OYV #131, Northsound Road, Virgin Gorda, British Virgin Islands
14 – Department of Physics, University of Hong Kong, Pok Fu Lam Road, Hong Kong, China
15 – Steward Observatory, University of Arizona, 933 North Cherry Avenue, Tucson, AZ 85721, USA
16 – NASA Goddard Space Flight Center, Code 665, Greenbelt, MD 20771, USA
17 – Department of Physics and Astronomy, Goucher College, 1021 Dulaney Valley Road, Baltimore, MD 21204, USA
18 – Department of Astronomy, University of Texas, Austin, TX 78712-0259, USA
References
- Arnaud & Rothenflug (1985) Arnaud, M. & Rothenflug, R. 1985, A&AS, 60, 425
- Balikhin et al. (1993) Balikhin, M., Gedalin, M., & Petrukovich, A. 1993, Physical Review Letters, 70, 1259
- Bell (2004) Bell, A. R. 2004, MNRAS, 353, 550
- Bell (2005) —. 2005, MNRAS, 358, 181
- Borkowski et al. (1997) Borkowski, K. J., Blondin, J. M., & McCray, R. 1997, ApJ, 476, L31+
- Callaway (1988) Callaway, J. 1988, Phys. Rev. A, 37, 3692
- Cardelli et al. (1989) Cardelli, J. A., Clayton, G. C., & Mathis, J. S. 1989, ApJ, 345, 245
- Cargill & Papadopoulos (1988) Cargill, P. J. & Papadopoulos, K. 1988, ApJ, 329, L29
- Caughlan & Fowler (1962) Caughlan, G. R. & Fowler, W. A. 1962, ApJ, 136, 453
- Danforth et al. (2010) Danforth, C. W., Keeney, B. A., Stocke, J. T., Shull, J. M., & Yao, Y. 2010, ApJ, 720, 976
- Dennison et al. (2005) Dennison, B., Turner, B. E., & Minter, A. H. 2005, ApJ, 633, 309
- Edmiston & Kennel (1984) Edmiston, J. P. & Kennel, C. F. 1984, Journal of Plasma Physics, 32, 429
- Fitzpatrick & Walborn (1990) Fitzpatrick, E. L. & Walborn, N. R. 1990, AJ, 99, 1483
- France et al. (2009) France, K., Beasley, M., Keeney, B. A., Danforth, C. W., Froning, C. S., Green, J. C., & Shull, J. M. 2009, ApJ, 707, L27
- France et al. (2010) France, K., McCray, R., Heng, K., Kirshner, R. P., Challis, P., Bouchet, P., Crotts, A., Dwek, E., Fransson, C., Garnavich, P. M., Larsson, J., Lawrence, S. S., Lundqvist, P., Panagia, N., Pun, C. S. J., Smith, N., Sollerman, J., Sonneborn, G., Stocke, J. T., Wang, L., & Wheeler, J. C. 2010, Science, 329, 1624
- Fransson & al. (2011) Fransson, C. & al., e. 2011, A&A, 1
- Fransson et al. (1989) Fransson, C., Cassatella, A., Gilmozzi, R., Kirshner, R. P., Panagia, N., Sonneborn, G., & Wamsteker, W. 1989, ApJ, 336, 429
- Fransson et al. (1996) Fransson, C., Lundqvist, P., & Chevalier, R. A. 1996, ApJ, 461, 993
- Gedalin et al. (2008) Gedalin, M., Balikhin, M. A., & Eichler, D. 2008, Phys. Rev. E, 77, 026403
- Ghavamian et al. (2007) Ghavamian, P., Laming, J. M., & Rakowski, C. E. 2007, ApJ, 654, L69
- Gilmozzi et al. (1987) Gilmozzi, R., Cassatella, A., Clavel, J., Fransson, C., Gonzalez, R., Gry, C., Panagia, N., Talavera, A., & Wamsteker, W. 1987, Nature, 328, 318
- Gordon et al. (2003) Gordon, K. D., Clayton, G. C., Misselt, K. A., Landolt, A. U., & Wolff, M. J. 2003, ApJ, 594, 279
- Gröningsson et al. (2008a) Gröningsson, P., Fransson, C., Leibundgut, B., Lundqvist, P., Challis, P., Chevalier, R. A., & Spyromilio, J. 2008a, A&A, 492, 481
- Gröningsson et al. (2008b) Gröningsson, P., Fransson, C., Lundqvist, P., Lundqvist, N., Leibundgut, B., Spyromilio, J., Chevalier, R. A., Gilmozzi, R., Kjær, K., Mattila, S., & Sollerman, J. 2008b, A&A, 479, 761
- Helder et al. (2011) Helder, E. A., Vink, J., & Bassa, C. G. 2011, ApJ, 737, 85
- Heng (2010) Heng, K. 2010, PASA, 27, 23
- Heng et al. (2008) Heng, K., Haberl, F., Aschenbach, B., & Hasinger, G. 2008, ApJ, 676, 361
- Heng & McCray (2007) Heng, K. & McCray, R. 2007, ApJ, 654, 923
- Heng et al. (2006) Heng, K., McCray, R., Zhekov, S. A., Challis, P. M., Chevalier, R. A., Crotts, A. P. S., Fransson, C., Garnavich, P., Kirshner, R. P., Lawrence, S. S., Lundqvist, P., Panagia, N., Pun, C. S. J., Smith, N., Sollerman, J., & Wang, L. 2006, ApJ, 644, 959
- Jerkstrand et al. (2011) Jerkstrand, A., Fransson, C., & Kozma, C. 2011, A&A, 530, A45+
- Klarsfeld (1969) Klarsfeld, S. 1969, Physics Letters A, 30, 382
- Kozma & Fransson (1992) Kozma, C. & Fransson, C. 1992, ApJ, 390, 602
- Laming et al. (1996) Laming, J. M., Raymond, J. C., McLaughlin, B. M., & Blair, W. P. 1996, ApJ, 472, 267
- Larsson et al. (2011) Larsson, J., Fransson, C., Östlin, G., Gröningsson, P., Jerkstrand, A., Kozma, C., Sollerman, J., Challis, P., Kirshner, R. P., Chevalier, R. A., Heng, K., McCray, R., Suntzeff, N. B., Bouchet, P., Crotts, A., Danziger, J., Dwek, E., France, K., Garnavich, P. M., Lawrence, S. S., Leibundgut, B., Lundqvist, P., Panagia, N., Pun, C. S. J., Smith, N., Sonneborn, G., Wang, L., & Wheeler, J. C. 2011, Nature, 474, 484
- Lawrence et al. (2000) Lawrence, S. S., Sugerman, B. E., Bouchet, P., Crotts, A. P. S., Uglesich, R., & Heathcote, S. 2000, ApJ, 537, L123
- Lundqvist & Fransson (1996) Lundqvist, P. & Fransson, C. 1996, ApJ, 464, 924
- Matsuura et al. (2011) Matsuura, M., Dwek, E., Meixner, M., Otsuka, M., Babler, B., Barlow, M. J., Roman-Duval, J., Engelbracht, C., Sandstrom, K., Lakićević, M., van Loon, J. T., Sonneborn, G., Clayton, G. C., Long, K. S., Lundqvist, P., Nozawa, T., Gordon, K. D., Hony, S., Panuzzo, P., Okumura, K., Misselt, K. A., Montiel, E., & Sauvage, M. 2011, Science, 333, 1258
- Mattila et al. (2010) Mattila, S., Lundqvist, P., Gröningsson, P., Meikle, P., Stathakis, R., Fransson, C., & Cannon, R. 2010, ApJ, 717, 1140
- Michael et al. (1998) Michael, E., McCray, R., Borkowski, K. J., Pun, C. S. J., & Sonneborn, G. 1998, ApJ, 492, L143+
- Michael et al. (2003) Michael, E., McCray, R., Chevalier, R., Filippenko, A. V., Lundqvist, P., Challis, P., Sugerman, B., Lawrence, S., Pun, C. S. J., Garnavich, P., Kirshner, R., Crotts, A., Fransson, C., Li, W., Panagia, N., Phillips, M., Schmidt, B., Sonneborn, G., Suntzeff, N., Wang, L., & Wheeler, J. C. 2003, ApJ, 593, 809
- Nussbaumer & Schmutz (1984) Nussbaumer, H. & Schmutz, W. 1984, A&A, 138, 495
- Osterbrock & Ferland (2006) Osterbrock, D. E. & Ferland, G. J. 2006, Astrophysics of gaseous nebulae and active galactic nuclei
- Osterman et al. (2011) Osterman, S., Green, J., Froning, C., Béland, S., Burgh, E., France, K., Penton, S., Delker, T., Ebbets, D., Sahnow, D., Bacinski, J., Kimble, R., Andrews, J., Wilkinson, E., McPhate, J., Siegmund, O., Ake, T., Aloisi, A., Biagetti, C., Diaz, R., Dixon, W., Friedman, S., Ghavamian, P., Goudfrooij, P., Hartig, G., Keyes, C., Lennon, D., Massa, D., Niemi, S., Oliveira, C., Osten, R., Proffitt, C., Smith, T., & Soderblom, D. 2011, Ap&SS, 157
- Park et al. (2011) Park, S., Zhekov, S. A., Burrows, D. N., Racusin, J. L., Dewey, D., & McCray, R. 2011, ApJ, 733, L35+
- Pellerin et al. (2002) Pellerin, A., Fullerton, A. W., Robert, C., Howk, J. C., Hutchings, J. B., Walborn, N. R., Bianchi, L., Crowther, P. A., & Sonneborn, G. 2002, ApJS, 143, 159
- Racusin et al. (2009) Racusin, J. L., Park, S., Zhekov, S., Burrows, D. N., Garmire, G. P., & McCray, R. 2009, ApJ, 703, 1752
- Scuderi et al. (1996) Scuderi, S., Panagia, N., Gilmozzi, R., Challis, P. M., & Kirshner, R. P. 1996, ApJ, 465, 956
- Seaton (1955) Seaton, M. J. 1955, Proceedings of the Physical Society A, 68, 457
- Shigeyama & Nomoto (1990) Shigeyama, T. & Nomoto, K. 1990, ApJ, 360, 242
- Shull et al. (2010) Shull, J. M., France, K., Danforth, C. W., Smith, B., & Tumlinson, J. 2010, ApJ, 722, 1312
- Smith et al. (2005) Smith, N., Zhekov, S. A., Heng, K., McCray, R., Morse, J. A., & Gladders, M. 2005, ApJ, 635, L41
- Sonneborn et al. (1998) Sonneborn, G., Pun, C. S. J., Kimble, R. A., Gull, T. R., Lundqvist, P., McCray, R., Plait, P., Boggess, A., Bowers, C. W., Danks, A. C., Grady, J., Heap, S. R., Kraemer, S., Lindler, D., Loiacono, J., Maran, S. P., Moos, H. W., & Woodgate, B. E. 1998, ApJ, 492, L139+
- Spitzer (1978) Spitzer, L. 1978, Physical processes in the interstellar medium
- van Adelsberg et al. (2008) van Adelsberg, M., Heng, K., McCray, R., & Raymond, J. C. 2008, ApJ, 689, 1089
- Walborn et al. (1993) Walborn, N. R., Phillips, M. M., Walker, A. R., & Elias, J. H. 1993, PASP, 105, 1240
- Walker & Suntzeff (1990) Walker, A. R. & Suntzeff, N. B. 1990, PASP, 102, 131
- Xu et al. (1992) Xu, Y., McCray, R., Oliva, E., & Randich, S. 1992, ApJ, 386, 181
- Zhekov et al. (2006) Zhekov, S. A., McCray, R., Borkowski, K. J., Burrows, D. N., & Park, S. 2006, ApJ, 645, 293