Evolution and Nucleosynthesis of AGB stars in Three Magellanic Cloud Clusters
Abstract
We present stellar evolutionary sequences for asymptotic giant branch (AGB) stars in the Magellanic Cloud clusters NGC 1978, NGC 1846 and NGC 419. The new stellar models for the three clusters match the observed effective temperatures on the giant branches, the oxygen-rich to carbon-rich transition luminosities, and the AGB-tip luminosities. A major finding is that a large amount of convective overshoot (up to 3 pressure scale heights) is required at the base of the convective envelope during third dredge-up in order to get the correct oxygen-rich to carbon-rich transition luminosity. The stellar evolution sequences are used as input for detailed nucleosynthesis calculations. For NGC 1978 and NGC 1846 we compare our model results to the observationally derived abundances of carbon and oxygen. We find that additional mixing processes (extra-mixing) are required to explain the observed abundance patterns. For NGC 1846 we conclude that non-convective extra-mixing processes are required on both the RGB and the AGB, in agreement with previous studies. For NGC 1978 it is possible to explain the C/O and / abundances of both the O-rich and the C-rich AGB stars by assuming that the material in the intershell region contains high abundances of both C and O. This may occur during a thermal pulse when convective overshoot at the inner edge of the flash-driven convective pocket dredges C and O from the core to the intershell. For NGC 419 we provide our predicted model abundance values although there are currently no published observed abundance studies for the AGB stars in this cluster.
1 Introduction
Asymptotic Giant Branch (AGB) stars are evolved, low to intermediate mass stars (1 Mi/ 8). They are characterized by a degenerate inert C-O core surrounded by helium and hydrogen nuclear burning shells, burning alternatively, forming a double-shell configuration. An intershell region rich in helium and carbon exists between the He and H nuclear shells. A deep H-rich convective envelope surrounds the double-shell configuration (e.g., see the review by Herwig, 2005). During the thermally-pulsing AGB (TP-AGB) phase, the He-shell becomes unstable, igniting every 105 years or so, with the resulting thermal pulses (TPs) lasting for 102 years. Following TPs mixing episodes can occur. The mixing brings the products of nuclear burning of H and He (mostly e and ) from the interior of the star to the stellar surface (Iben, 1975). These are referred to as third dredge-up (TDU) events. Through the action of repeated TDUs, AGB stars evolve from having an oxygen-rich composition (O-rich stars) where C/O 1 to a carbon-rich composition (C-rich stars) where C/O 1. The TDU can also result in AGB stars with enhanced s-process elements in their spectra (see Busso et al., 1999). Thus, thermal pulses lead to changes in the surface abundances of AGB stars, making them chemically very different compared to their less evolved counterparts. The end of the AGB phase is reached when the superwind mass loss (up to 10-4 yr-1) reduces the hydrogen-rich envelope to small values (10-3), with the ejected matter diffusing into the inter-stellar medium (Blöcker, 2001).
Star clusters are ideal sites to test theories of stellar evolution. They contain stars of similar age and metallicity. Star clusters in the Magellanic Clouds (MCs) prove very valuable in comparison to the star clusters in our Galaxy as they span a wide range of age, which enables us to study the evolution of stars of various masses (e.g. Girardi et al., 2009; Mackey et al., 2008; Milone et al., 2009; Mucciarelli et al., 2006, etc). The MCs house a large population of rich, intermediate age clusters which are useful for studying the the short-lived later stages of stellar evolution, especially for stars with masses around 1.5 to 2.5 (Girardi et al., 1995; Wood, 1994). Since we know the distance to the MCs accurately, the luminosities of AGB stars can be determined, in contrast to AGB stars in the Galaxy which occur mostly in field populations. Further, the intermediate-age clusters in the MCs demonstrate the TDU brilliantly (Bessell et al., 1983; Frogel et al., 1990) and are useful probes to study the details of the TDU in O-rich stars and C-rich stars.
The objective of our work is to study the evolution and nucleosynthesis of AGB stars in the two Large Magellanic Cloud (LMC) clusters, NGC 1978 and NGC 1846, and in the Small Magellanic Cloud (SMC) cluster NGC 419. These three clusters are ideal test beds for evolution and nucleosynthesis studies owing to the availability of accurate estimates of AGB structural parameters such as pulsation masses, effective temperatures (), and luminosity (Kamath et al. 2010 for NGC 1978 and NGC 419, and Lebzelter & Wood 2007 for NGC 1846). Abundance studies and attempts to explain the observed C and O abundances for NGC 1978 and the C, O, and F abundances for NGC 1846 have been carried out by Lederer et al. (2009) and Lebzelter et al. (2008), respectively. It was found that the derived C/O and / ratios for the two clusters showed very different results considering that the two clusters have similar AGB masses and metallicities. For NGC 1978, no theoretical scheme was established that could satisfactorily reproduce the derived chemical abundance pattern. Further, it was found that the M-stars in NGC 1846 showed a very rapid increase in the observed [F/Fe] versus C/O ratios compared to the predictions (Lebzelter et al., 2008). For NGC 419, no detailed observational information on abundances exist.
In our study, we compute new evolution models with updated opacities for the AGB stars in these clusters. We constrain our models based on the accurate observational parameters. This allows us to reproduce observables such as the giant branch temperatures, the oxygen to carbon transition luminosity (where C/O 1), and the AGB-tip luminosity. We then use these stellar evolutionary sequences in a post-processing code to study detailed nucleosynthesis and try to reproduce the observed abundances of the AGB stars in our target clusters. We estimate the effects of extra-mixing processes on the surface abundances, similar to those attempted in previous studies by Lebzelter et al. (2008), Lederer et al. (2009), and Karakas et al. (2010). We also simulate the effects of an intershell enhanced in both and to explain the unusual abundances of the cluster AGB stars.
The outline of this paper is as follows. In Section 2 we introduce the three target clusters and supply existing abundance information for them. In Section 3 we present a general overview on the numerical method involved in the stellar evolution and nucleosynthesis models that we use in our work. Here we also discuss the uncertainties in stellar models and details on the updated stellar evolution code. In Section 4 we present details of the individual models for each cluster and we discuss our results. Finally, in Section 5 we summarize our work and provide some concluding remarks.
2 Target Clusters
2.1 NGC 1978
The rich intermediate-age cluster NGC 1978 is an interesting candidate in the LMC. This cluster houses both M-type and C-type stars (Lloyd Evans, 1980; Lederer et al., 2009; Kamath et al., 2010). From pulsation analysis, the cluster is found to have red variables early on the AGB with a mass of 1.55 0.1 (Kamath et al., 2010). This study also showed that the highly evolved AGB stars have had a substantial amount of mass loss. NGC 1978 is the only cluster in the LMC with a known mid-IR source (Tanabé et al., 1998) which has a large infra-red excess, indicative of a very large mass-loss rate.
The properties of the cluster are given in Kamath et al. (2010). The metallicity estimates are mostly in the range [Fe/H] = 0.37 dex to 0.42 dex with no evidence for any -enhancement (Mucciarelli et al., 2008) and the age is estimated to be Gyr. The age and metallicity estimates lead to an initial mass for the current AGB stars of 1.54 to 1.62 , consistent with the direct pulsation mass determinations for early-AGB stars of 1.55 0.1 .
Lederer et al. (2009) derived C/O and / ratios for nine AGB stars in this cluster. They found that, for the M-stars in their sample, the C/O ratio ranges from 0.13 to 0.18 with a typical uncertainty of 0.05. The / ratio values range between 9 and 16 with an uncertainty of up to 4. They attributed these low C/O and / ratios for the M-stars in the cluster to the fact that the M-stars have not undergone any TDU. Based on a sample of four C-stars, for which reliable abundances could be established for only two, they found that the C/O ratio was around 1.35 with an uncertainty of up to 0.10 and the corresponding isotopic carbon ratio was about 150 to 175 with significantly larger errors ( to ).
2.2 NGC 1846
NGC 1846 is a rich intermediate-age LMC cluster known to have a very interesting CMD. Using HST observations, Mackey & Broby Nielsen (2007) identified the presence of two distinct main-sequence turn-offs that are clearly associated with the cluster. They are the result of the presence of two separate stellar populations with the same metallicities but different ages of = 1.5 Gyr for the upper turn-off and = 1.8 Gyr for the lower turn-off. Recent work by Goudfrooij et al. (2009) using HST data confirmed the double main sequence turn-off feature as well as identified the presence of a RGB bump, a feature that is also found in NGC 1978. They found that age values of 1.7 Gyr and 2.0 Gyr for the upper and lower turn-off’s respectively, AGB star masses between 1.70 and 1.77 , and best-fit abundances of [Fe/H] = 0.50 with [/Fe] = 0.20. Lebzelter & Wood (2007) derived pulsation masses for the AGB stars in NGC 1846 of 1.8, which corresponds to a cluster age of 1.9 Gyr.
Lloyd Evans (1980) identified a large number of M-stars, C-stars, and S-stars in NGC 1846. The cluster AGB stars do not show significant mass loss along the AGB (Lebzelter & Wood, 2007). Further, no stars with a high mid-IR excess have been found in NGC 1846 (Tanabé et al., 1998). Lebzelter et al. (2008) determined the C/O, / and the [F/Fe] ratios for a small sample of AGB stars in this cluster. For the M stars, they determined C/O ratios between 0.2 and 0.65 with an uncertainty of up to 0.1 dex. Carbon isotopic ratios varying between 12 and 60 were found for the sample of M-stars. For the C-stars in the sample, they derived a C/O value of around 1.8 and an isotopic carbon ratio of about 60. For the M-stars in their sample, they also measured the change of fluorine abundance along the AGB using the blended HF line and found a clear increase in the F abundance with luminosity with the [F/Fe] values ranging between 0.71 to 0.40.
2.3 NGC 419
NGC 419 is a populous intermediate-age cluster in the SMC. This cluster houses a large population of AGB stars, many of which are C-stars (Frogel et al., 1990; Mucciarelli et al., 2008; Kamath et al., 2010). The properties of this cluster are given in Kamath et al. (2010). The metallicity is estimated to be around [Fe/H] = 0.7 dex and the age estimates are mostly in the range 1.2 to 1.6 Gyr. Using the variability of stars in this cluster, Kamath et al. (2010) derived pulsation masses of 1.87 0.1 early on the AGB. The AGB stars in this cluster show significant mass loss along the AGB which agrees well with the existence of a mid-IR source detected by the ISOCAM survey (Tanabé et al., 1998).
3 The Numerical Method
We calculate the stellar evolution and nucleosynthesis in two steps. First, we use the stellar evolution code to follow the evolution of the stellar structure and abundances important for stellar evolution (H, e, e, , , and ) from the zero-aged main sequence (ZAMS) to the end of the TP-AGB phase (see Section 3.1). Then we perform detailed nucleosynthesis calculations (see Section 3.2). The numerical method and the procedure used to compute the models have been previously described in detail by Karakas et al. (2002), Lugaro et al. (2004), Karakas (2010), and references therein. Here, we summarize the essential details relevant to our study.
3.1 Stellar Evolution models
The stellar evolution is calculated using an updated version of the Mount Stromlo Stellar Evolution Code (Wood & Zarro, 1981; Lattanzio, 1986; Frost & Lattanzio, 1996; Karakas & Lattanzio, 2007). The masses and compositions of the stars evolved are listed in Section 4. Low-mass stellar models are affected by many uncertainties, the most important of which are listed below. With our improved models we aim to constrain these uncertainties.
3.1.1 Mass-loss
Dealing with the extent and temporal distribution of mass-loss in AGB stars is a major uncertainty in stellar modeling. Model calculations use simple parametrized formulae which are supposed to be an average of what is observed. In the existing stellar evolution code, the Reimers (1975) mass-loss prescription is used on the RGB with , and the Vassiliadis & Wood (1993) mass-loss prescription is used on the AGB. We note that the latter prescription was derived from a sample containing both O-rich and C-rich stars so that it should be valid for our modeling. Furthermore, at higher mass-loss rates, direct measurements of the mass-loss rates for MC AGB stars agrees reasonably well with the Vassiliadis & Wood (1993) mass-loss rate (Wood et al., 2007). In our study to reproduce the AGB-tip luminosity, we found that the Vassiliadis & Wood (1993) mass-loss prescription produced AGB-tip luminosities that were about 0.2 mag too faint. As a simple correction for this, we modify the Vassiliadis & Wood (1993) mass-loss prescription and invoke the super-wind phase at a later stage during the AGB evolution. This is done by effectively increasing the pulsation period at which the super-wind starts from 500 days (as found in Vassiliadis & Wood 1993) to days (specifically, the term ’’ in Equation 2 of Vassiliadis & Wood (1993) is replaced by ’ 210’ and ’ 290’, respectively, depending on the mass and metallicity combination). The period values at which the superwind mass-loss rate begins (i.e., where the mass-loss rate given by Equation 1 of Vassiliadis & Wood (1993) matches the value given by the modified Equation 2) for each structure model is listed in Table 1.
It is worth commenting on the need to increase the period for the onset of the superwind. The basic reason for this is that in these models with new C-rich opacities, the AGB stars become considerably cooler when C/O exceeds unity. This means that the radius and hence computed pulsation period increases significantly causing the superwind to occur at lower luminosities than in O-rich stars or in past models without C-rich opacities. Observationally, as noted above, the O-rich and C-rich stars in the sample of Vassiliadis & Wood (1993) seem to fall on the same curve of rising mass loss with pulsation period. Also, it appears that the and relations are indistinguishable, at least while the stars are optically visible (Feast et al., 1989). There seems to be an inconsistency between the observed relation and that predicted by the stellar models with the new C-rich opacities. Our adjustment of the onset period for the superwind is one way to bring the model mass loss rates and periods back to those that seem to apply observationally. Perhaps new pulsation models with C-rich opacities will resolve this problem.
3.1.2 Convection
One of the biggest uncertainties in stellar models is the treatment of convection. We use the mixing length (MLT) theory for convective regions and we set the mixing length parameter in the models by matching the observed RGB and E-AGB , taking observed values from Kamath et al. (2010). We then keep the mixing length parameter a constant.
Previous studies by Straniero et al. (1997), Karakas et al. (2002), Stancliffe et al. (2004), and Karakas et al. (2010) show that different stellar evolution codes predict different TDU efficiencies, with some codes predicting no TDU if overshoot is not included (e.g., Mowlavi, 1999). Furthermore, low-mass (M 2 ) AGB models show little or no TDU (Karakas et al., 2002). In our models, to alter the extent of TDU, we include convective overshoot by extending the position of the base of the convective envelope downward by pressure scale heights (Karakas et al., 2010). We include convective overshoot at the base of the envelope at all times during the AGB. By changing we alter the amount of carbon that is dredged-up to the outer layers of the star such that the M/C transition takes place near the observed (Lebzelter & Wood, 2007; Kamath et al., 2010). We note that we define the M/C transition luminosity as the luminosity of the brightest M-star as there is an overlap in the luminosity of M and C-stars due to luminosity variations over a thermal pulse cycle. The values of and that we use for the models of the cluster AGB stars are listed in Table 1.
During thermal pulses, adding convective overshoot to the base of the intershell convection will cause this convection to penetrate further into the C-O core, resulting in intershell abundances that are different from models with no overshoot (e.g., Herwig, 2000). The subclass of PG1159 post-AGB stars are H-deficient and show He-intershell material at their surface (Werner et al., 2009). In these stars, C abundances vary from 15–60% (by mass) and O from 2–20%. These abundances are in direct contrast to standard intershell compositions that give 25% C and % O (e.g., Boothroyd & Sackmann, 1988). The theoretical models of Herwig (2000) include the effect of diffusive convective overshoot into the C-O core during a TP. This increases the C and O intershell abundances well above the value found in standard models but consistent with PG 1159 star abundances. Though we do not include this in our evolution models, in our nucleosynthesis study for AGB stars in NGC 1978 (refer Section 4.1), we synthetically estimate the effects of a non-standard intershell which is enhanced in both and . We employ methods similar to those described in Karakas et al. (2010).
3.1.3 Opacities
The outer layers of AGB stars become cool, allowing molecules to form. Therefore an accurate treatment of molecular opacities is needed. In our version of the stellar evolution code we have utilized new opacity tables. At low temperatures we have used the Rosseland mean opacities computed using AESOPUS (Marigo & Aringer, 2009) with Lodders (2003) solar abundances as the reference solar composition. Using AESOPUS we have the option of incorporating scaled-solar, -enhanced, and carbon-depleted opacity tables. We have generated tables based on the initial composition we require for each of the clusters. We also utilize the OPAL radiative opacity tables of Iglesias & Rogers (1996) updated to use a Lodders (2003) solar abundance distribution of elements from C to Fe. To maintain consistency between the abundances of the low-temperature tables and the high-temperature OPAL tables we use OPAL tables appropriate for each of the compositions (scaled-solar, -enhanced, and carbon-depleted).
3.2 The nucleosynthesis models
The evolution code only includes the species (H, e, e, , , and ) that are relevant to the major energy generating reactions and this forms the basis for the structure of the model star. In order to try and explain the elemental and isotopic abundance patterns observed in stars we need to include more nuclear species. We use a post-processing nucleosynthesis code for this purpose. This code needs as input from the stellar evolution code variables such as temperature, density, and convective boundaries as a function of time and mass fraction. The code then re-calculates the abundance changes as a function of mass and time using a nuclear network which contains 77 species (from hydrogen to sulphur, along with a small group of iron-peak elements) and time dependant diffusive mixing for all convective zones (Cannon, 1993). The overshoot regions at the bottom of the convective envelope in the evolution code are not treated as convective in the nucleosynthesis code, i.e., convection and mixing are assumed to stop at the Schwarzschild boundary. The code also requires input physics such as reaction rates and initial abundances. Most of the 589 reaction rates are taken from the JINA REACLIB data base (Cyburt et al., 2010). Details on the updated reaction rates that we use can be found in Karakas (2010). For the three clusters, we assume the initial abundances based on the existing observational information on their abundances. Details on the input abundances used for each model are discussed in Section 4. We take our reference solar composition from Lodders (2003).
An additional feature of the post-processing nucleosynthesis code which is not in the evolution code is that we can estimate the effect of extra-mixing. Observations of low-mass red giant stars ( near the RGB-tip) reveal / ratios of and C/N (Gilroy, 1989). These ratios are lower than predicted by standard stellar evolution models, which give / and / . (e.g. Charbonnel, 1994). These trends are also seen in globular clusters where there is an anti-correlation of C abundance with luminosity (e.g., in M3; Smith, 2002). Together these observations indicate the occurrence of non-convective mixing processes on the giant branch. Mechanisms proposed to account for this extra-mixing (see Herwig et al., 2006) include rotational mixing (Charbonnel et al., 1998), gravity waves (Denissenkov & Tout, 2000), thermohaline mixing (Eggleton et al., 2008; Charbonnel & Zahn, 2007; Stancliffe et al., 2009; Stancliffe, 2010), and magnetic fields (Nordhaus et al., 2008; Busso et al., 2007; Palmerini et al., 2009). To simulate the effect of extra-mixing on the RGB, we take the envelope composition at the tip of the giant branch from the nucleosynthesis calculations and alter it such that the / ratio equals the observed M-star / ratio. This is done by decreasing the abundance, and increasing the abundances of and in the entire convective envelope according to changes expected for CN cycling, i.e., the total number of , , and nuclei are conserved. The modified models are subsequently evolved through core-helium burning and on the AGB. An extensive explanation on this procedure can be found in Karakas et al. (2010).
4 Models and Results
In this section we present the stellar evolution and nucleosynthesis models for the AGB stars in our target clusters. The parameters used to construct the stellar models are listed in Table 1. These include the initial mass and metallicity, the initial abundance pattern, the for the M-stars on the AGB at ( ), the mixing-length parameter () used to fit the giant branch , the mass on the early AGB (), the amount of convective overshoot required to fit the M/C transition luminosity (), the bolometric luminosity of the model star at the M/C transition (), the pulsation period () where the superwind mass-loss rate begins, and the predicted bolometric luminosity at the tip of the AGB ().
We use starting compositions with a variety of C/O ratios in our evolution calculations. These C/O ratios were chosen to broadly match the C/O ratios observed for the cluster M-stars which lie on the early-AGB. For NGC 419 we construct models using a scaled-solar abundance pattern as there are no observed C/O ratios. However for NGC 1978 and NGC 1846 we experiment with three different initial compositions as there are observed C/O ratios: a scaled-solar composition; a carbon-depleted composition where [C/Fe] = 0.25 dex with scaled-solar values for the other elements (hereafter, the carbon depleted model); and an -enhanced composition where [/Fe] = 0.20 dex while for all the other elements we assume scaled-solar values (hereafter, the -enhanced model). For all the above mixtures we use the Lodders (2003) reference solar composition.
In Table 2 we present some of the details of the stellar structure models. The first row for each cluster gives the initial mass and metallicity. Then we include for each model the number of TPs computed, the H-exhausted core mass (hereafter core mass) at which the TDU begins (), the maximum TDU efficiency (, where = /, being the amount by which the core mass has grown between the present and previous TPs), and the average value for the TDU efficiency (). We also include the total amount of mass dredged into the envelope during the AGB lifetime (), the maximum He-shell temperature () which is usually taken from the final TP, the core mass and the total mass at the final (the last computed) timestep ((f) and (f), respectively), and the final interpulse period ((f)).
4.1 Evolution and Nucleosynthesis model results for NGC 1978
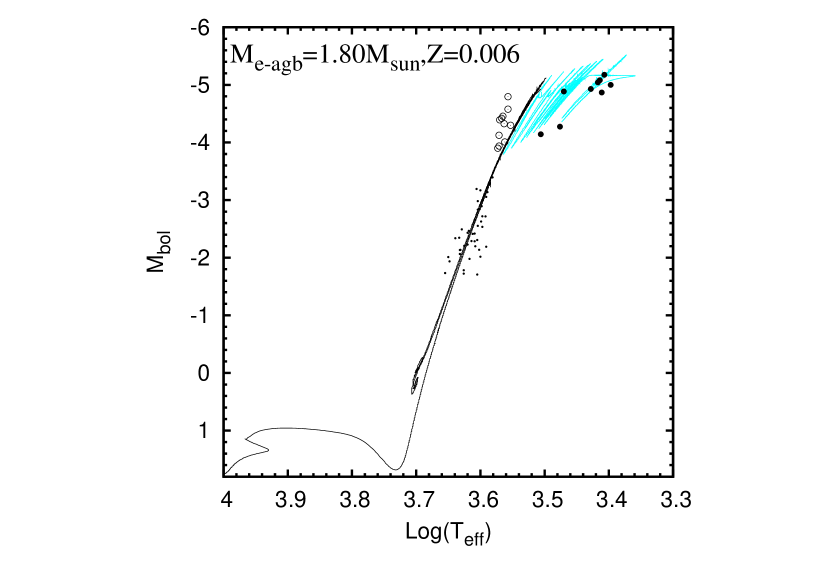
Based on the estimated AGB pulsation mass of 1.55 for the cluster AGB stars (see Section 2.1) we construct evolutionary sequences starting from the ZAMS having an initial mass of 1.63 with = 0.006 (similar to the observed global metallicity for this cluster, [Fe/H] ) and = 0.25. We construct stellar evolution models based on three initial compositions: scaled-solar, carbon-depleted, and -enhanced. To match the composition of the lowest M-star C/O ratio, we assume that the -enhanced model also has a slight carbon depletion of [C/Fe] = 0.05 dex. Figure 1 shows the theoretical Hertzsprung-Russell (HR) diagram for the carbon-depleted model as an example. We also overplot the AGB variables and the non-variable red-giants in NGC 1978 (Kamath et al., 2010). We find that the evolutionary track is in good agreement with the observed star positions. The other models corresponding to the other two initial compositions have similar evolutionary tracks. The values for the mixing length parameter ) are the same for all three compositions at 1.90. However the amount of overshoot varies slightly ( 2.45 3.00), with the -enhanced model requiring the most overshoot and the carbon-depleted model requiring slightly less overshoot than the scaled-solar model (refer to Table 1). The amount of overshoot used in each model series results in predicted M/C transition values that give a good match to the observed M/C transition bolometric luminosity of (Kamath et al., 2010). Observations from Kamath et al. (2010) also indicate that the most luminous cluster AGB star has an . To match this luminosity, the super-wind phase for the three models start at a pulsation period of 790 days.

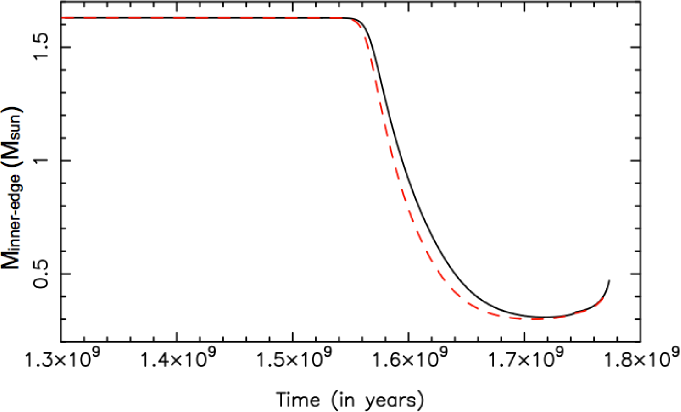
One interesting feature of NGC 1978’s CMD is the presence of the RGB bump. This is because the RGB bump luminosity can be used as an extra observational constraint on the stellar structure models. The RGB bump is caused by the H-shell erasing the abundance discontinuity left by the retreating convective envelope during the first dredge-up (FDU). In Fig. 2 we show the location (in mass) of the inner edge of the convective envelope during the FDU. The black solid-line shows the scaled-solar model, and this model has a slightly higher RGB bump bolometric luminosity of = 0.53 when compared to the observed 0.31, calculated from the position of the RGB bump at V555 = 19.10 0.10 (Mucciarelli et al., 2007). To match the observed RGB bump luminosity we can apply convective overshoot in a similar way as done for the AGB. The red dashed-line in Fig. 2 shows the result of one such model with a = 0.30. The figure shows that the depth of the FDU is not significantly altered, although the FDU begins at an earlier time and this lowers the RGB bump bolometric luminosity to better match the observed values. The structural details (e.g., surface luminosity, core mass, effective temperature, etc) were essentially the same at the tip of the RGB and on the E-AGB in the model with slight overshoot compared to the model without. For this reason we will ignore overshoot on the RGB for the rest of this study.
From Table 2 we find that all the three models in NGC 1978 experience 15 TPs. To reproduce the observed M/C transition luminosity we require very extended TDU with . This results in of 0.72 0.82 (see Fig. 3) and an average of 0.58 0.65 for all TPs. When convergence difficulties terminated the evolution calculations (at an envelope mass of the order of 0.05 to 0.20 for the different models computed), the mass-loss rates were so high that we would not expect any further TPs or TDU events to occur on the AGB.
We now discuss the results of the post-processing nucleosynthesis calculations. In Table 3 we include C, O, and F surface abundance information for all the stellar models. We provide the initial, post-FDU, and final computed C/O ratios (C/Oi, C/Opost-FDU, and C/Of, respectively), where all abundance ratios are number fractions. Furthermore we list the initial, post-FDU, and final computed / ratios (/i, /post-FDU, and /f, respectively). In the last column we provide the [F/Fe] ratio at the tip of the AGB where we use the standard notation [X/Y] = (X/Y)(X/Y)⊙.
From Table 3 we see that the scaled-solar model gives a post-FDU C/O = 0.33, significantly higher than the highest M-star C/O ratio of 0.18. On the other hand the carbon-depleted models all yield a C/O ratio of 0.18, within the range of the M-star observations (C/O = 0.13 to 0.18). However, the predicted post-FDU / ratio does not match the observed range of / = 9 to 16 for all carbon depleted models. In order to obtain a match, we assume extra-mixing has taken place on the RGB (as explained in Section 3.2). We alter the envelope composition at the tip of the RGB such that / = 13, which agrees well with the observed average M-star / value of 13. We designate AGB evolutionary sequences in which the abundance change has been made as extra-mixing sequences.
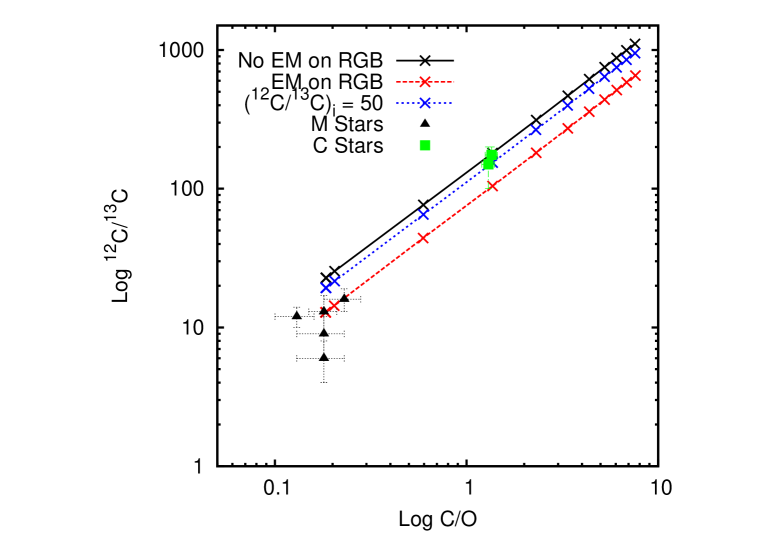
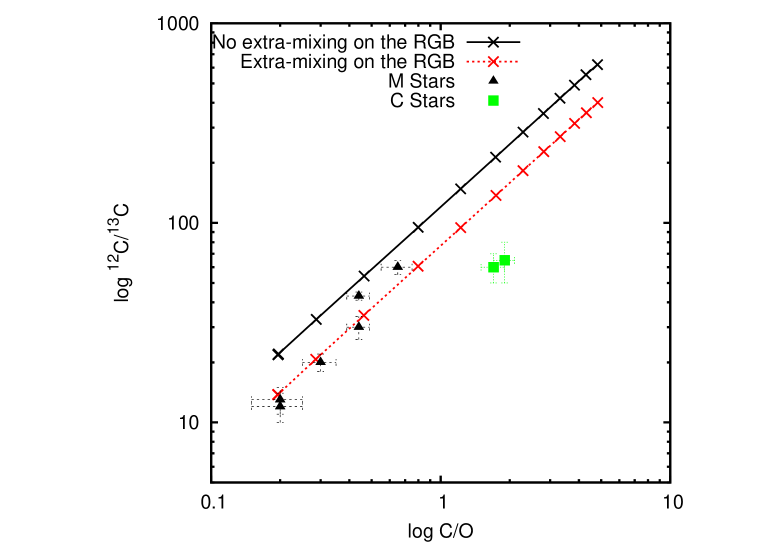
In Fig. 4 we show the evolution of the C/O versus / ratios for the carbon-depleted models on a logarithmic scale. Included on the plot are the observed values for the M and C-type stars in NGC 1978 from Lederer et al. (2009). The black solid-line represents the carbon-depleted model without extra-mixing on the RGB and the red dashed-line represents the carbon-depleted model with extra-mixing on the RGB. Furthermore, we also perform one nucleosynthesis calculation with a lower initial / = 50 compared to the solar value of 89 (from LMC HII regions, see discussion in Wang et al., 2009). From Fig. 4 we see that both the models with no extra-mixing, i.e., either with a solar / (black solid-line) or with an initial / = 50 (blue dotted-line), have a post-FDU abundance of / which is higher than the observed M-star value. However, the model with extra-mixing (red dashed-line) has a post-FDU abundance of / = 12.8 which by construct agrees well with the observed average M-star / value of 13.
We also experiment with two -enhanced models, one without extra-mixing on the RGB and one with extra-mixing on the RGB (see Table 3), which result in post-FDU C/O and / ratios similar to the carbon-depleted case. However, NGC 1978 shows no evidence for an initial -enhancement (Mucciarelli et al., 2008). Thus, we favour a model with a carbon-depleted initial composition coupled with extra-mixing on the RGB since it accurately reproduces the observed average C and O composition of the cluster M-stars. However, this scenario does not adequately explain the cluster C-stars. Previously, Lederer et al. (2009) attempted to reproduce the observed carbon and oxygen abundances for the cluster AGB stars using models with an E-AGB mass = 1.55 and Z = 0.006 along with moderate extra-mixing on the RGB coupled with an [O/Fe] = 0.2 dex. These models were able to match the observed average C/O and / for the M-stars but they were unable to reproduce C/O and / for the C-stars.
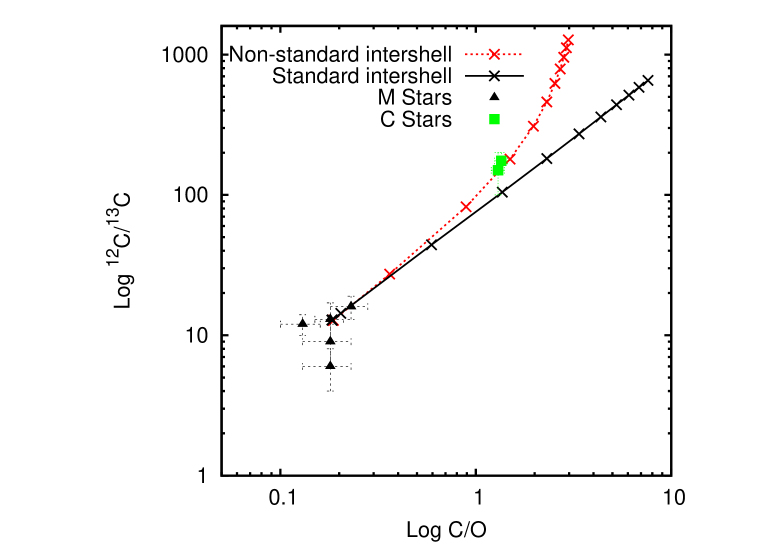
The C-stars in NGC 1978 have large observed carbon isotopic ratios indicating a strong contribution of from the He-intershell mixed into the envelope by TDU. We note that the models show a slope very close to 1 implying that essentially only increases with time: any substantial change in slope would require an additional change to either or O. One possible way to do this would be to have an intershell abundance with more than that predicted by standard models as discussed in Section 3.1.2. In Figure 5 we show a synthetic AGB model prediction (red dashed-line) that results from increasing the C content to 40% and the O content of the intershell to 15% (by mass). The standard values for this model are 15% for C and 0.35% for O (by mass). The artificially enhanced numbers are within the range of C and O abundances observed for PG 1159 stars (Werner & Herwig, 2006). With the enhanced intershell C and O values, the total elemental C and O surface abundances increase as a result of such mixing by factors of 177 and 10, respectively, in comparison to a model with a standard intershell which results in an increase by factors of 86 and 1.05 in the surface composition. From Figure 5 we see that in NGC 1978 such a model fits the data for both the M-stars and the C-stars very well. Note that the final C/O ratio (C/O 3.00) is much lower than the final C/O ratio of the model with a standard intershell composition (C/O 7.60). This implies that some AGB stars may have intershells with higher abundances of and than those predicted by standard models.
4.2 Evolution and Nucleosynthesis model results for NGC 1846
For the AGB stars in NGC 1846 we construct evolutionary sequences starting from the ZAMS having an initial mass of 1.86 with Z = 0.006 and Y = 0.25. This results in a predicted E-AGB mass of 1.80 which is similar to the estimated pulsation mass of 1.80 for the cluster AGB stars (Lebzelter & Wood, 2007). We compute stellar evolution sequences with three initial compositions: scaled-solar, carbon-depleted, and -enhanced. Figure 6 shows the theoretical HR diagram for the -enhanced model as well as the AGB variables and the non-variable red-giants in the cluster (Lebzelter & Wood, 2007). We find that the observations generally match the theoretical evolutionary track well although the most luminous M-stars are bluer than predicted by the evolutionary tracks. The HR diagrams for the models corresponding to the other two abundances mixes are similar. In Table 1 we list the input parameters required for the three sequences. We find that the value for is the same for all three compositions at 1.74. Overshoot parameters of 1.05 are needed to reproduce the observed M/C transition luminosity of (Lebzelter & Wood, 2007) for the scaled-solar and the carbon-depleted model while the -enhanced model requires slightly more overshoot ( 1.41). The AGB-tip bolometric luminosity for NGC 1846 is (Lebzelter & Wood, 2007). To match this luminosity the superwind phase had to start at a pulsation period of days.
The models for NGC 1846 experience around 16 TPs (see Table 2). The NGC 1846 models have slightly less efficient TDU () when the observed M/C transition luminosity is reproduced, when compared to the NGC 1978 models () consistent with the smaller amount of overshoot ( 1.05 1.41 compared to 2.54 3.00 in NGC 1978). For the NGC 1846 model sequences, the final envelope masses when convergence difficulties terminate the evolution calculations range between 0.075 to 0.20. We would not expect any further TPs or TDU episodes.
Observations indicate that NGC 1846 shows a mild -enhancement (Mucciarelli et al., 2008). Thus we choose the -enhanced model as our favored model. Post-processing nucleosynthesis calculations for the -enhanced model start with an initial surface value of C/O = 0.31 and / = 89, and yield post-FDU values of C/O = 0.19 and / = 22. We then alter the envelope / composition such that / = 14 at the tip of the RGB, in a similar manner as for NGC 1978 (Table 3). The M-stars in the cluster show a spread in C/O ratios ranging from 0.20 to 0.65 and / ratios between 12 and 60. In Figure 7 we show results from the -enhanced models with extra-mixing on the RGB (red dotted-line) and without (black solid-line). From Figure 7 it is clear that an -enhancement combined with extra-mixing on the RGB gives a good match to both the C/O and / ratios of the cluster M-stars. However, the subsequent AGB evolution from the M-stars does not explain the observed abundances for the cluster’s C-stars.
Stellar evolution calculations by Lebzelter et al. (2008) show that by assuming extra-mixing on the RGB along with an initial [O/Fe] = 0.20 dex, the predicted carbon and oxygen abundances match the observed M-star compositions. This result agrees well with our conclusions. Similar results were also presented by Karakas et al. (2010) for the cluster’s M-stars. In order to match the carbon and oxygen abundances in the C-stars, Lebzelter et al. (2008) estimated the effects of extra-mixing on the RGB as well as a moderate extra-mixing in the late part of the AGB when the stars become C-rich. The theoretical models match both the observed M and C-star compositions as a result of the extra brought to the surface by extra-mixing on the AGB. However it is unclear as to why extra-mixing starts on the AGB only when C/O 1. Nevertheless we also conclude that extra-mixing may be required on the AGB to explain the compositions of the C-stars. It is possible that this extra-mixing on the AGB is weak hot-bottom burning where the base of the convective envelope extends into the upper regions of the H-shell and some CN-cycling occurs. Since hot-bottom burning increases with stellar mass, and the AGB stars in NGC 1846 are more massive than the AGB stars in NGC 1978, this could explain why this effect is seen in NGC 1846 and not NGC 1978.
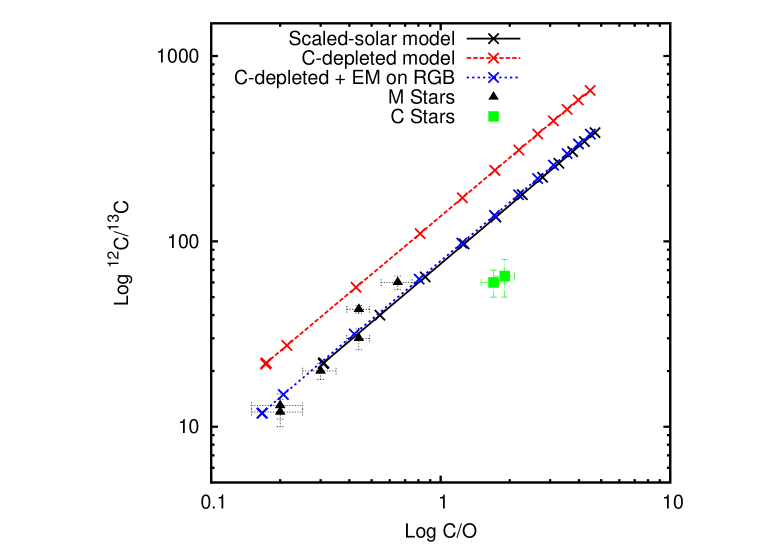
In Figure 8 we show the results for the C/O versus / ratios for several additional model sequences. The scaled-solar model (black solid-line) does not match the C/O and the / ratios of the M-stars with the lowest C/O ratios. These stars show no C-enrichment and probably have a composition similar to (or that of) stars at the tip of the RGB. We find that the scaled-solar model matches the C/O and the / ratios of the other M-stars that show an enrichment of carbon caused by TDU, although their C/O 1. However, we find that this model does not reproduce the / of the C-stars. For the carbon-depleted model without extra-mixing (red dashed-line) we find that though the predicted C/O ratios lie in the range of the observed C/O ratios for the M and the C-stars, we cannot match the / ratio of the M-stars, where the post-FDU / ratio for this model is 22. Furthermore, the / ratio predicted for the C-stars is very far from the observed value. The carbon-depleted model with extra-mixing fits the observed C/O and the / ratios of the M-stars in the cluster (with a predicted post-FDU / = 12, refer Table 3). However, as for the previous models, this model also fails to reproduce the observational / ratio of the cluster’s C-stars.
4.2.1 Fluorine Abundances in NGC 1846
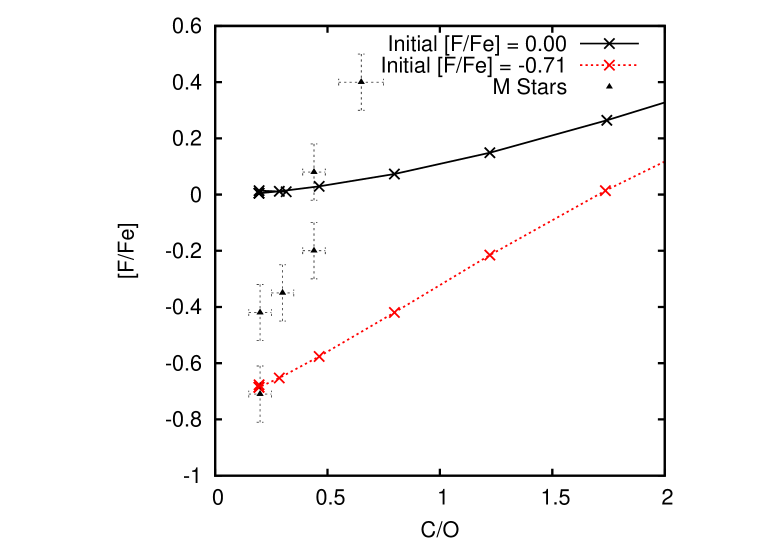
An additional observational constraint in NGC 1846 is the [F/Fe] ratio (Lebzelter et al., 2008). Observations from Lebzelter et al. (2008) show a steep increase in the estimated fluorine abundance with the C/O ratio. The black solid-line in Figure 9 shows the predicted [F/Fe] versus C/O ratios using our best fit model (the -enhanced model with extra-mixing) for the AGB stars in NGC 1846. We also compute another model using the lowest observed [F/Fe] abundances (Lebzelter et al., 2008) as a starting point, where the initial [F/Fe] = 0.71 (denoted using red dotted-lines in Figure 9). We find that the increase in the predicted abundance of fluorine with the C/O ratio from both the theoretical models is shallower than the increase in the observed fluorine abundance for a given C/O ratio. Theoretical models by Lebzelter et al. (2008) also show a similar trend in the [F/Fe] versus C/O ratios.
Flourine production in AGB stars is quite complicated: F is synthesized during thermal pulses via a combination of neutron, proton, and alpha capture reactions. The most likely path for the production of fluorine is via () ()(p,)() reactions (Forestini et al., 1992; Mowlavi et al., 1996). The required can be synthesized by the (p,) reaction owing to the presence of and protons in the He intershell. is produced by the -capture on where is found in the ashes of CNO cycling from the preceding H-burning stage. Further, the (n,p) reaction has a high cross section and can produce and free protons. production is enhanced by the inclusion of a pocket via the release of free neutrons which come from the (,n) reaction. At the end of each TDU episode, the convective envelope penetrates into the stable radiative intershell zone and a -rich region can form in the top layers of the He-intershell as a result of the partial mixing of protons. The neutrons from the (,n) reaction not only produce the s-process elements but also get captured by species such as and l; both of which are strong neutron absorbers and are produced by the H shell. Neutron captures on then help increase the production during a thermal pulse (see, e.g., Lugaro et al., 2004).
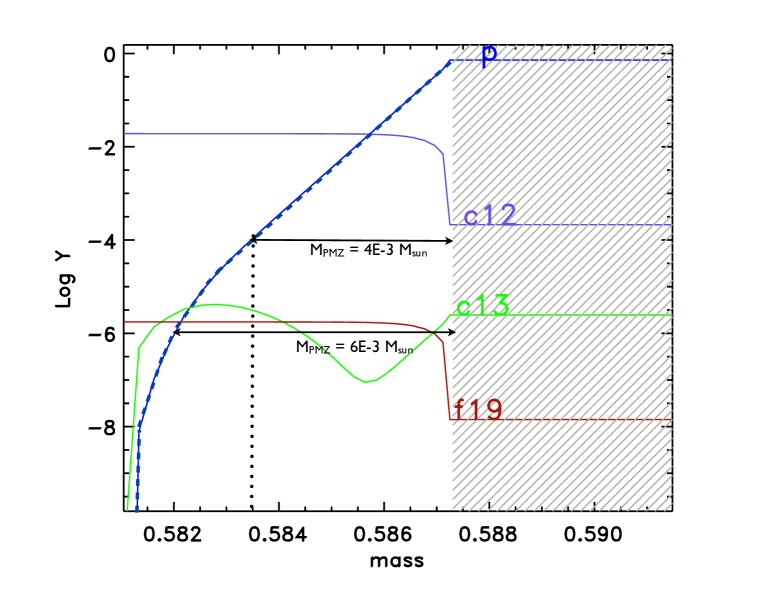
In our best-fit model for the AGB stars in NGC 1846, we artificially include a partial mixing zone at deepest extent of each TDU episode in the nucleosynthesis code using the same procedure as that explained in Lugaro et al. (2004) and Karakas (2010), which is based on the method used by Goriely & Mowlavi (2000). We insert the partial mixing zone at the deepest extent of the TDU because this is when a sharp discontinuity is produced between the convective envelope and the radiative intershell, which is a favourable condition for the occurrence of mixing. The partial mixing zone can be defined in terms of the proton profile. It is defined as the region where the abundance of protons drops exponentially from the envelope value to a fixed lower value (Xp). We experiment with two values of X 110-4 and X 110-6. For the size of the partial mixing zone we consider three values of M10-3 (i.e., 1/6 of the mass of the intershell at the deepest extent of TDU) and M 610-3 (i.e., 1/4 of the mass of the intershell at the deepest extent of TDU), and M10-2 (i.e., most of the mass of the intershell during the last few TP’s). Figure 10 shows MPMZ, Xp, and the proton profile in two cases. Note that MPMZ stays constant with evolution along the AGB.
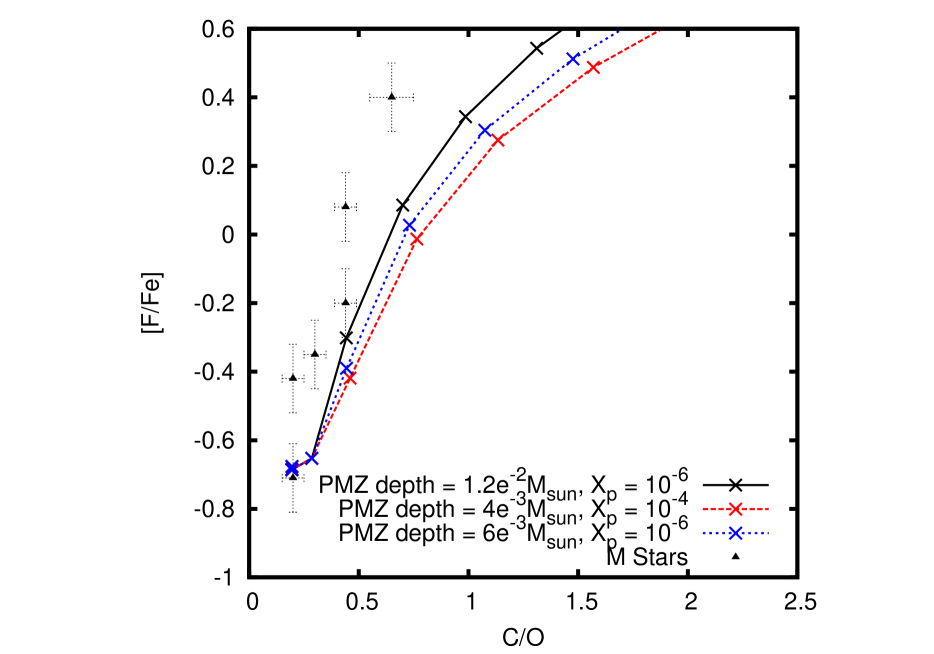
Figure 11 shows the predicted [F/Fe] versus C/O ratios for our best fit model for NGC 1846 after the inclusion of partial mixing zones starting with an initial [F/Fe] 0.71. The red dashed-line represents the model where the partial mixing zone has a depth of MPMZ = 410-3 and a proton abundance limit, X 110-4. This model does not reproduce the observations. We experiment by extending the depth of the partial mixing zone to MPMZ = 610-3 and X 110-6 denoted by the blue dotted-line in Figure 11. The model shows that a little more F is produced at a given C/O ratio than the previous case, however, the fluorine abundance does not match the observations. The black solid-line in Figure 11 represents the best-fit model of NGC 1846 with a MPMZ = 1.210-2 and X 110-6. This model reproduces the observed F abundances fairly well. This implies that a MPMZ = 1.210-2 or higher would be required to reproduce the observations: note that the total model intershell mass is reduced to 1.510-2 at the tip of the AGB. However, this situation is rather speculative as -process models require smaller 13C pockets in order to match observations (Gallino et al., 1998; Bonačić Marinović et al., 2007).
We conclude that our models can reproduce the observations but only with partial mixing zones that are likely to be larger than those required for -process studies, making this a speculative result. We also note that the observed abundances were estimated based on the single blended HF line for the M-stars which also adds to the uncertainity in the observed F abundance.
4.3 Evolution and Nucleosynthesis model results for NGC 419
The last cluster in our study is the SMC cluster NGC 419. In Figure 12 we show the theoretical evolutionary track of the scaled-solar model and the positions of the AGB variables and the non-variable red-giants in NGC 419 (Kamath et al., 2010). The AGB evolutionary track is clearly in good agreement with the observed star positions. Here we only consider a scaled solar initial composition owing to the lack of information on the abundances for stars in this cluster. We use a ZAMS model with an initial mass of 1.91, , and . This results in an E-AGB mass of 1.85 which agrees well with the estimated pulsation mass for the AGB variables in this cluster (Kamath et al., 2010). We find that an of 1.74 is required to reproduce the giant branch temperatures: this is similar to that for NGC 1846 which is of a similar initial mass (Table 1). An overshoot of = 2.10 is required on the AGB to reproduce the observed M/C transition luminosity (). To match the observed AGB-tip luminosity, the super-wind mass-loss rate needs to begin at a pulsation period of 790 days. Owing to a lower metallicity and a higher mass, the AGB stars experience more TPs (19) compared to the two other cluster AGB stars ( 15 each). The greater number of TPs leads to a large amount of He-shell burning material being mixed into the envelope and this is demonstrated by the high final C/O and / ratios (Table 3). The envelope mass when convergence failed is 0.29which implies that the models star is unlikely to experience any further TPs or TDU episodes since the mass-loss rate at this stage is 9.4010-6/year, and the interpulse period is 1105 years.

4.4 The effect of C/O ratio on of AGB stars
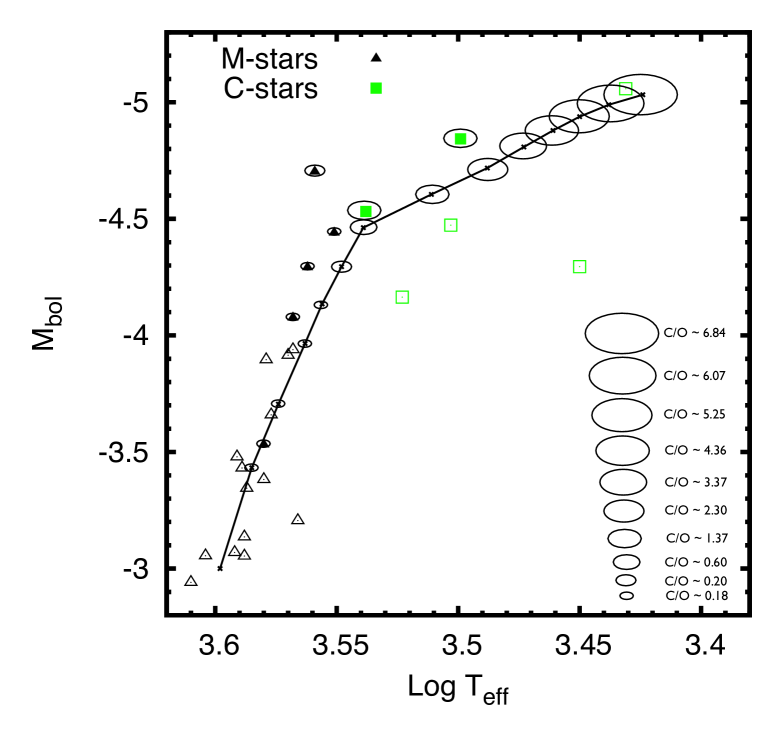
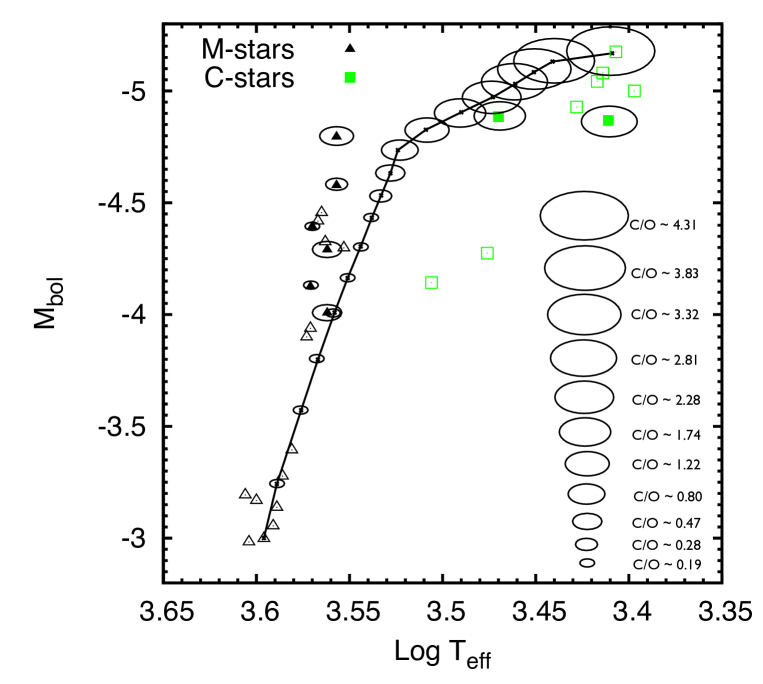
Figure 13 and Figure 14 show the variation of with measured at the interpulse luminosity maximum for each of the TP’s for the two LMC clusters NGC 1978 and NGC 1846 (black solid-lines). The size of the ellipses on the solid lines denotes the C/O ratio after each TDU episode, as indicated in the grid on the bottom-right corner of the figures. Also shown are the AGB variables that have observational C/O estimates (Lederer et al. 2009 for NGC 1978, and Lebzelter et al. 2008 for NGC 1846), with the M-stars depicted as black filled triangles and C-stars as green filled squares. The size of the ellipse around each of the filled symbols indicates the observational C/O ratio of the star. The AGB variables without any abundance information are denoted as open symbols (M-stars as black open triangles and C-stars as green open squares). For most of the observational data, the and the is taken from Kamath et al. (2010) for NGC 1978 and Lebzelter & Wood (2007) for NGC 1846 and for those stars not in these studies, the and the is taken from Lederer et al. (2009) for NGC 1978 and Lebzelter et al. (2008) for NGC 1846.
Figures 13 and 14 shows that for the M stars with luminosities , of the models matches the observed values of well. This is because the mixing length was adjusted to provide a match between model and observed values at these luminosities. At more luminous , the model is slightly cooler than the observations. This can be attributed to the effect of the constant mixing length that we use in our models. Previous studies (e.g. Lebzelter & Wood, 2007) have shown that at high luminosities the mixing length needs to be increased slowly with luminosity in order to reproduce the correct slope for the theoretical giant branch.
Once the M/C transition luminosity is reached, it can be seen that the AGB slope of the models suddenly decreases and the stars become increasingly cooler with increasing C/O ratio. The few C-stars with observed C/O ratios generally show the same movement to lower values as seen in the models, although the correspondence between and C/O ratio is not clear. The larger sample of C stars that do not have C/O measurements also lie cooler than the sequence of O-rich AGB stars or its extrapolation to higher luminosities. However, these stars do not necessarily lie directly on the sequences shown in Figures 13 and 14 for models at the interpulse luminosity maximum because of the variation of luminosity over the thermal pulse cycle. This is best seen in Figures 1, 6 and 12. In summary, the increase in C/O ratio above unity causes to decrease but it is hard to determine from the current observational data whether the magnitude of this effect is reproduced accurately by the models.
5 Discussion and Conclusions
In this paper we have presented new stellar models for AGB stars in NGC 1978, NGC 1846, and NGC 419. These are three clusters whose well-defined observational characteristics provide strong constraints on evolution models. The stellar evolution models are constrained to reflect the observed AGB pulsation mass, cluster metallicity, giant branch effective temperature, M/C transition luminosity and the AGB-tip luminosity.
Stellar models are affected by major uncertainties including mass loss, convection (e.g., mixing length), depth and efficiency of TDU, and non-convective mixing. In our study we try to constrain these uncertainties. In order to produce the correct AGB-tip luminosities, the Vassiliadis & Wood (1993) mass-loss prescription had to be modified so that the super-wind mass-loss rate commences at a period of 710 790 days as opposed to the 500 days period employed by Vassiliadis & Wood (1993). The mixing length parameter () required to fit the observed giant branch temperature for each of the three clusters shows values similar to the ’s found when calculating a standard solar model (e.g., Piersanti et al., 2007, although our values are slightly lower than their ).
Overshoot at the base of the convective envelope of 1 3 pressure scale heights was required to obtain the observed luminosity of the M/C transition. This results in higher final C/O ratios of about 7.5 8.0 for the LMC cluster NGC 1978, 3.7 4.8 for the LMC cluster NGC 1846, and 11.9 for the SMC cluster NGC 419. The C/O ratios of planetary nebulae (PNe) put upper limits on the C/O ratios for the LMC and SMC. In the LMC, Stanghellini et al. (2005) found that a C/O of 2 is typical for non-bipolar PN and in the SMC a C/O = 4 is typical for non-bipolar PN (Stanghellini et al., 2009). This indicates that the models show a higher level of C-enrichment when compared to the observations. It is worth mentioning that the model with an enhanced C and O intershell composition, computed to reproduce the observational C and O abundances of the M and C-stars in the LMC cluster NGC 1978 (refer Section 4.1), has a final surface C/O ratio of C/O 3.00, in good agreement with the LMC PN data.
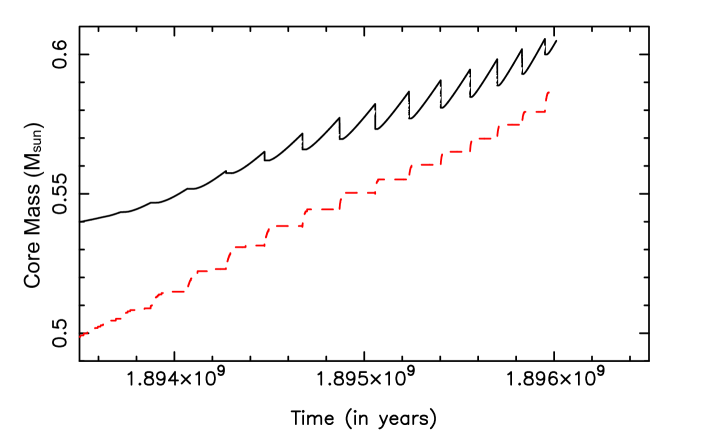
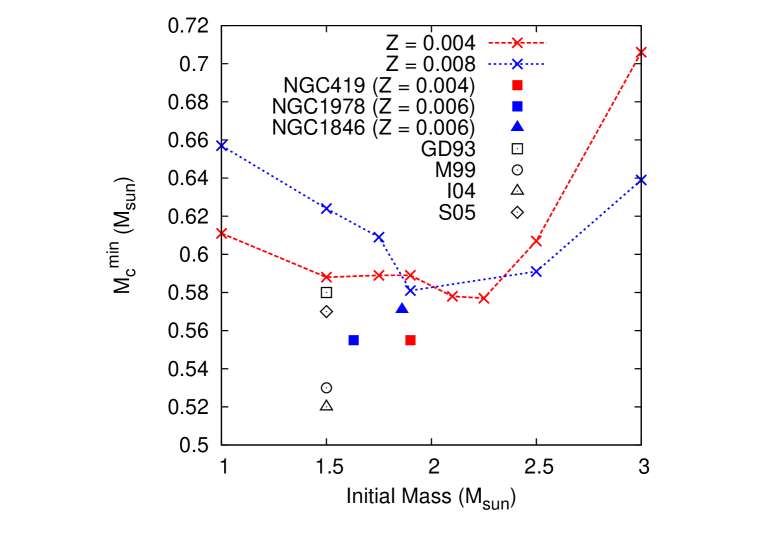
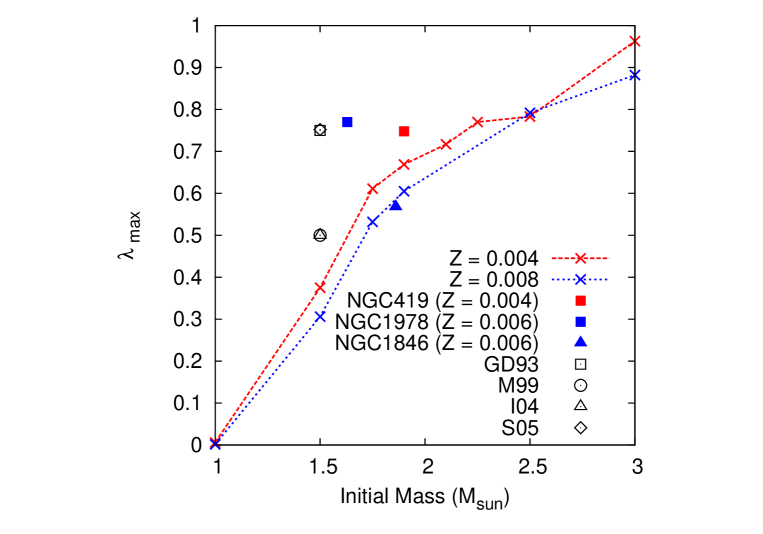
Another consequence of the overshoot employed in our models is that the average values from our full AGB evolution calculations lie in the range 0.40 to 0.70 for our best fitting models. The first dredge-up episodes occur for core masses of . Our values can be compared with evolution calculations that do not use any overshoot at the base of the convective envelope. For direct comparison we use the models of Karakas et al. (2002). Figure 15 and Figure 16 compares our predicted and (from Table 2) as a function of the initial mass and metallicty to the and model values from Karakas et al. (2002). We find that, as expected, our models find TDU at smaller core masses than the models of Karakas et al. (2002) without overshoot. Similarly, our values are higher.
The C-star luminosity function (CSLFs) in the MCs have been used to calibrate the onset and efficiency of the TDU in synthetic AGB evolution calculations (Groenewegen & de Jong, 1993; Marigo et al., 1999; Izzard et al., 2004; Stancliffe et al., 2005). The values derived in these four studies are also shown in Figure 15 and Figure 16. The values span a wide range downward from the values found by Karakas et al. (2002) and they bracket our values. The Izzard et al. (2004) and Marigo et al. (1999) value seem too small to be consistent with our results. In the synthetic calculations by Groenewegen & de Jong (1993) and Marigo et al. (1999), is a constant parameter that is altered to fit the CSLFs but varies in the models of Izzard et al. (2004) and Stancliffe et al. (2005). Given the range of masses and metallicities involved in the models and observations, it is difficult to use our derived values to make precise comments on the validity of the values usined in the synthetic models. Observations from clusters with a wider range of initial masses would be useful for constraining these parameters as a function of mass and metallicity.
In Table 2 we give the final core and total masses for the stellar models. Given that we expect no further TPs, the final core masses are approximately the final masses, and these can be compared to white dwarf masses. Our predicted final masses are , right at the peak of the distribution of white dwarf masses in the Milky Way Galaxy (Ferrario et al., 2005; Liebert et al., 2005). Even though these white dwarf masses are derived from a different stellar population (notably one more metal rich), there is a strong consistency between our predicted masses and the peak of the observed range.
The main focus of our study is to establish a theoretical explanation for the observed C, O, and F abundances (F abundances only for NGC 1846) in the three clusters. Lederer et al. (2009) had difficulties finding a theoretical explanation for the NGC 1978 M and C-type AGB stars. Our scenario uses a carbon-depleted model with extra-mixing on the RGB along with an intershell enhanced in both and to explain the composition of the stars in NGC 1978. This scenario is somewhat speculative because it is not clear if AGB stars experience convective overshoot between the flash-driven convective region and C-O core, even though this mixing likely occurs in post-AGB stars to produce the PG 1159 stars. For NGC 1846 we find that an -enhanced initial composition coupled with extra-mixing on the RGB followed by standard thermally pulsing AGB evolution reproduces the observed abundance patters of the cluster M-stars. We find that extra-mixing , perhaps the beginning of hot-bottom burning, is also required on the AGB in order to fit the observational data for the C-stars though we do not model this in our study. This conclusion was also reached by Lebzelter et al. (2008). For the M-stars in NGC 1846 we insert partial mixing zones which turn into the pocket in our post-processing nucleosynthesis models in order to try and re-produce the observed F abundances. We find that a partial mixing zone that is a similar size (in mass) to the intershell region at the end of the TP-AGB will reproduce the observed F abundance variation with C/O. This result is in contradiction to -process studies that require smaller 13C pocket masses to reproduce the observed -process abundance distribution (Gallino et al., 1998; Bonačić Marinović et al., 2007).
For NGC 419 we have predicted C and O abundances based on a scaled-solar model and these results can be compared to the observational abundances once they have been derived.
| Model Type | Z | ||||||||
| () | () | (Hp) | (days) | ||||||
| NGC 1978 | |||||||||
| Scaled-Solar | 1.63 | 0.006 | 3.564 | 1.90 | 1.56 | 2.54 | 4.51 | 790 | 5.08 |
| C-Depleted | 1.63 | 0.006 | 3.563 | 1.90 | 1.56 | 2.75 | 4.47 | 790 | 5.06 |
| -Enhanced | 1.63 | 0.006 | 3.564 | 1.90 | 1.56 | 3.00 | 4.50 | 790 | 5.05 |
| NGC 1846 | |||||||||
| Scaled-Solar | 1.86 | 0.006 | 3.560 | 1.74 | 1.80 | 1.05 | 4.73 | 710 | 5.18 |
| C-Depleted | 1.86 | 0.006 | 3.558 | 1.74 | 1.80 | 1.05 | 4.77 | 710 | 5.18 |
| -Enhanced | 1.86 | 0.006 | 3.559 | 1.74 | 1.80 | 1.41 | 4.78 | 710 | 5.17 |
| NGC 419 | |||||||||
| Scaled-Solar | 1.90 | 0.004 | 3.574 | 1.74 | 1.85 | 2.10 | 4.49 | 790 | 5.23 |
| ††footnotetext: Note: is the computed for the M-stars on the AGB at , denotes the overshoot parameter in pressure scale heights, Hp (see Section 3.1.2). denotes the computed bolometric luminosity at the M/C transition. is the pulsation period where the superwind mass-loss rate is reached. denotes the computed AGB-tip bolometric luminosity. | |||||||||
| Model Type | TPs | (f) | (f) | ip(f) | |||||
| () | () | (106K) | () | () | (105years) | ||||
| NGC 1978 - = 1.63, Z = 0.006 | |||||||||
| Scaled-Solar | 15 | 0.558 | 0.720 | 0.588 | 0.079 | 273 | 0.605 | 0.655 | 1.209 |
| C-Depleted | 13 | 0.555 | 0.773 | 0.653 | 0.085 | 272 | 0.599 | 0.856 | 1.398 |
| Enhanced | 13 | 0.552 | 0.817 | 0.655 | 0.097 | 272 | 0.594 | 0.647 | 1.392 |
| NGC 1846 - = 1.86, Z = 0.006 | |||||||||
| Scaled-Solar | 16 | 0.569 | 0.551 | 0.429 | 0.051 | 279 | 0.635 | 0.933 | 1.021 |
| C-Depleted | 18 | 0.573 | 0.545 | 0.433 | 0.051 | 280 | 0.636 | 0.749 | 0.978 |
| Enhanced | 17 | 0.571 | 0.609 | 0.487 | 0.060 | 279 | 0.630 | 0.705 | 1.056 |
| NGC 419 - = 1.90, Z = 0.004 | |||||||||
| Scaled-Solar | 19 | 0.555 | 0.748 | 0.608 | 0.118 | 279 | 0.625 | 0.914 | 0.997 |
| Model Type | EMaaThis indicates if extra-mixing is assumed to occur on the RGB. | C/OibbThe notations ’i’, ’P-FDU’, and ’f’ denote the initial, post-FDU, and final abundance values, respectively. | C/OP-FDUbbThe notations ’i’, ’P-FDU’, and ’f’ denote the initial, post-FDU, and final abundance values, respectively. | C/OfbbThe notations ’i’, ’P-FDU’, and ’f’ denote the initial, post-FDU, and final abundance values, respectively. | /i | /P-FDU | /f | [F/Fe]f |
|---|---|---|---|---|---|---|---|---|
| NGC 1978 | ||||||||
| Scaled-Solar | No | 0.501 | 0.333 | 8.258 | 89.4 | 23.4 | 691.2 | 1.147 |
| C-Depleted | No | 0.282 | 0.185 | 7.561 | 89.4 | 22.7 | 1106.2 | 1.078 |
| C-Depleted | Yes | 0.282 | 0.184 | 7.601 | 89.4 | 12.8 | 654.0 | 1.080 |
| C-Depletedc | No | 0.281 | 0.184 | 7.566 | 50.0 | 19.3 | 948.4 | 1.078 |
| Enhanced | No | 0.282 | 0.184 | 8.038 | 89.4 | 22.7 | 1175.3 | 1.369 |
| Enhanced | Yes | 0.282 | 0.186 | 8.079 | 89.4 | 12.8 | 684.4 | 1.371 |
| NGC 1846 | ||||||||
| Scaled-Solar | No | 0.501 | 0.309 | 4.700 | 89.4 | 21.9 | 386.2 | 0.740 |
| C-Depleted | No | 0.282 | 0.173 | 4.480 | 89.4 | 21.8 | 651.5 | 0.741 |
| C-Depleted | Yes | 0.282 | 0.167 | 4.489 | 89.4 | 11.8 | 378.6 | 0.743 |
| Enhanced | No | 0.316 | 0.196 | 4.821 | 89.4 | 21.8 | 621.1 | 0.996 |
| Enhanced | Yes | 0.316 | 0.195 | 4.832 | 89.4 | 13.8 | 400.8 | 0.998 |
| NGC 419 | ||||||||
| Scaled-Solar | No | 0.501 | 0.299 | 11.954 | 89.4 | 21.6 | 1101.7 | 1.393 |
| ccfootnotetext: This represents the carbon-depleted model with an initial / = 50 (see Section 4.1 for details). | ||||||||
References
- Bessell et al. (1983) Bessell, M. S., Wood, P. R., & Evans, T. L. 1983, MNRAS, 202, 59
- Blöcker (2001) Blöcker, T. 2001, Ap&SS, 275, 1
- Bonačić Marinović et al. (2007) Bonačić Marinović, A., Lugaro, M., Reyniers, M., & van Winckel, H. 2007, A&A, 472, L1
- Boothroyd & Sackmann (1988) Boothroyd, A. I. & Sackmann, I.-J. 1988, ApJ, 328, 653
- Busso et al. (1999) Busso, M., Gallino, R., & Wasserburg, G. J. 1999, ARA&A, 37, 239
- Busso et al. (2007) Busso, M., Wasserburg, G. J., Nollett, K. M., & Calandra, A. 2007, ApJ, 671, 802
- Cannon (1993) Cannon, R. C. 1993, MNRAS, 263, 817
- Charbonnel (1994) Charbonnel, C. 1994, A&A, 282, 811
- Charbonnel et al. (1998) Charbonnel, C., Brown, J. A., & Wallerstein, G. 1998, A&A, 332, 204
- Charbonnel & Zahn (2007) Charbonnel, C. & Zahn, J.-P. 2007, A&A, 467, L15
- Cyburt et al. (2010) Cyburt, R. H., Amthor, A. M., Ferguson, R., Meisel, Z., Smith, K., Warren, S., Heger, A., Hoffman, R. D., Rauscher, T., Sakharuk, A., Schatz, H., Thielemann, F. K., & Wiescher, M. 2010, ApJS, 189, 240
- Denissenkov & Tout (2000) Denissenkov, P. A. & Tout, C. A. 2000, MNRAS, 316, 395
- Eggleton et al. (2008) Eggleton, P. P., Dearborn, D. S. P., & Lattanzio, J. C. 2008, ApJ, 677, 581
- Feast et al. (1989) Feast, M. W., Glass, I. S., Whitelock, P. A., & Catchpole, R. M. 1989, MNRAS, 241
- Ferrario et al. (2005) Ferrario, L., Wickramasinghe, D., Liebert, J., & Williams, K. A. 2005, MNRAS, 361, 1131
- Forestini et al. (1992) Forestini, M., Goriely, S., Jorissen, A., & Arnould, M. 1992, A&A, 261, 157
- Frogel et al. (1990) Frogel, J. A., Mould, J., & Blanco, V. M. 1990, ApJ, 352, 96
- Frost & Lattanzio (1996) Frost, C. A. & Lattanzio, J. C. 1996, ApJ, 473, 383
- Gallino et al. (1998) Gallino, R., Arlandini, C., Busso, M., Lugaro, M., Travaglio, C., Straniero, O., Chieffi, A., & Limongi, M. 1998, ApJ, 497, 388
- Gilroy (1989) Gilroy, K. K. 1989, ApJ, 347, 835
- Girardi et al. (1995) Girardi, L., Chiosi, C., Bertelli, G., & Bressan, A. 1995, A&A, 298
- Girardi et al. (2009) Girardi, L., Rubele, S., & Kerber, L. 2009, MNRAS, 394, L74
- Goriely & Mowlavi (2000) Goriely, S. & Mowlavi, N. 2000, A&A, 362, 599
- Goudfrooij et al. (2009) Goudfrooij, P., Puzia, T. H., Kozhurina-Platais, V., & Chandar, R. 2009, AJ, 137, 4988
- Groenewegen & de Jong (1993) Groenewegen, M. A. T. & de Jong, T. 1993, A&A, 267, 410
- Herwig (2000) Herwig, F. 2000, A&A, 360, 952
- Herwig (2005) —. 2005, ARA&A, 43, 435
- Herwig et al. (2006) Herwig, F., Freytag, B., Hueckstaedt, R. M., & Timmes, F. X. 2006, ApJ, 642, 1057
- Iben (1975) Iben, Jr., I. 1975, ApJ, 196, 525
- Iglesias & Rogers (1996) Iglesias, C. A. & Rogers, F. J. 1996, ApJ, 464, 943
- Izzard et al. (2004) Izzard, R. G., Tout, C. A., Karakas, A. I., & Pols, O. R. 2004, MNRAS, 350, 407
- Kamath et al. (2010) Kamath, D., Wood, P. R., Soszyński, I., & Lebzelter, T. 2010, MNRAS, 408, 522
- Karakas (2010) Karakas, A. I. 2010, MNRAS, 403, 1413
- Karakas et al. (2010) Karakas, A. I., Campbell, S. W., & Stancliffe, R. J. 2010, ApJ, 713, 374
- Karakas & Lattanzio (2007) Karakas, A. I. & Lattanzio, J. C. 2007, PASA, 24, 103
- Karakas et al. (2002) Karakas, A. I., Lattanzio, J. C., & Pols, O. R. 2002, PASA, 19, 515
- Lattanzio (1986) Lattanzio, J. C. 1986, ApJ, 311, 708
- Lebzelter et al. (2008) Lebzelter, T., Lederer, M. T., Cristallo, S., Hinkle, K. H., Straniero, O., & Aringer, B. 2008, A&A, 486, 511
- Lebzelter & Wood (2007) Lebzelter, T. & Wood, P. R. 2007, A&A, 475, 643
- Lederer et al. (2009) Lederer, M. T., Lebzelter, T., Cristallo, S., Straniero, O., Hinkle, K. H., & Aringer, B. 2009, A&A, 502, 913
- Liebert et al. (2005) Liebert, J., Bergeron, P., & Holberg, J. B. 2005, ApJS, 156, 47
- Lloyd Evans (1980) Lloyd Evans, T. 1980, MNRAS, 193, 87
- Lodders (2003) Lodders, K. 2003, ApJ, 591, 1220
- Lugaro et al. (2004) Lugaro, M., Ugalde, C., Karakas, A. I., Görres, J., Wiescher, M., Lattanzio, J. C., & Cannon, R. C. 2004, ApJ, 615, 934
- Mackey & Broby Nielsen (2007) Mackey, A. D. & Broby Nielsen, P. 2007, MNRAS, 379, 151
- Mackey et al. (2008) Mackey, A. D., Broby Nielsen, P., Ferguson, A. M. N., & Richardson, J. C. 2008, ApJ, 681, L17
- Marigo & Aringer (2009) Marigo, P. & Aringer, B. 2009, A&A, 508, 1539
- Marigo et al. (1999) Marigo, P., Girardi, L., & Bressan, A. 1999, A&A, 344, 123
- Milone et al. (2009) Milone, A. P., Bedin, L. R., Piotto, G., & Anderson, J. 2009, A&A, 497, 755
- Mowlavi (1999) Mowlavi, N. 1999, A&A, 344, 617
- Mowlavi et al. (1996) Mowlavi, N., Jorissen, A., & Arnould, M. 1996, A&A, 311, 803
- Mucciarelli et al. (2008) Mucciarelli, A., Carretta, E., Origlia, L., & Ferraro, F. R. 2008, AJ, 136, 375
- Mucciarelli et al. (2007) Mucciarelli, A., Ferraro, F. R., Origlia, L., & Fusi Pecci, F. 2007, AJ, 133, 2053
- Mucciarelli et al. (2006) Mucciarelli, A., Origlia, L., Ferraro, F. R., Maraston, C., & Testa, V. 2006, ApJ, 646, 939
- Nordhaus et al. (2008) Nordhaus, J., Busso, M., Wasserburg, G. J., Blackman, E. G., & Palmerini, S. 2008, ApJ, 684, L29
- Palmerini et al. (2009) Palmerini, S., Busso, M., Maiorca, E., & Guandalini, R. 2009, Publications of the Astronomical Society of Australia, 26, 161
- Piersanti et al. (2007) Piersanti, L., Straniero, O., & Cristallo, S. 2007, A&A, 462, 1051
- Reimers (1975) Reimers, D. 1975, Circumstellar envelopes and mass loss of red giant stars (Problems in stellar atmospheres and envelopes.), 229–256
- Smith (2002) Smith, G. H. 2002, Publ. Astron. Soc. Pac., 114, 1097
- Stancliffe (2010) Stancliffe, R. J. 2010, MNRAS, 403, 505
- Stancliffe et al. (2009) Stancliffe, R. J., Church, R. P., Angelou, G. C., & Lattanzio, J. C. 2009, MNRAS, 396, 2313
- Stancliffe et al. (2005) Stancliffe, R. J., Izzard, R. G., & Tout, C. A. 2005, MNRAS, 356, L1
- Stancliffe et al. (2004) Stancliffe, R. J., Tout, C. A., & Pols, O. R. 2004, MNRAS, 352, 984
- Stanghellini et al. (2009) Stanghellini, L., Lee, T.-H., Shaw, R. A., Balick, B., & Villaver, E. 2009, ApJ, 702, 733
- Stanghellini et al. (2005) Stanghellini, L., Shaw, R. A., & Gilmore, D. 2005, ApJ, 622, 294
- Straniero et al. (1997) Straniero, O., Chieffi, A., Limongi, M., Busso, M., Gallino, R., & Arlandini, C. 1997, ApJ, 478, 332
- Tanabé et al. (1998) Tanabé, T., Nishida, S., Nakada, Y., Onaka, T., Glass, I. S., & Sauvage, M. 1998, Ap&SS, 255, 407
- Vassiliadis & Wood (1993) Vassiliadis, E. & Wood, P. R. 1993, ApJ, 413, 641
- Wang et al. (2009) Wang, M., Chin, Y., Henkel, C., Whiteoak, J. B., & Cunningham, M. 2009, ApJ, 690, 580
- Werner & Herwig (2006) Werner, K. & Herwig, F. 2006, Publ. Astron. Soc. Pac., 118, 183
- Werner et al. (2009) Werner, K., Rauch, T., Reiff, E., & Kruk, J. W. 2009, Ap&SS, 320, 159
- Wood et al. (2007) Wood, P., Groenewegen, M. A. T., Sloan, G. C., Blommaert, J. A. D. L., Cioni, M.-R. L., Feast, M. W., Habing, H. J., Hony, S., Lagadec, E., Loup, C., Matsuura, M., Menzies, J. W., Olivier, E. A., Vanhollebeke, E., van Loon, J. T., Waters, L. B. F. M., Whitelock, P. A., & Zijlstra, A. A. 2007, in Astronomical Society of the Pacific Conference Series, Vol. 378, Why Galaxies Care About AGB Stars: Their Importance as Actors and Probes, 251–+
- Wood (1994) Wood, P. R. 1994, Ap&SS, 217, 121
- Wood & Zarro (1981) Wood, P. R. & Zarro, D. M. 1981, ApJ, 247, 247