Constraining the formation of inner bars.
Photometry, kinematics and stellar
populations in NGC 357††thanks: Based on observations carried out at the European Southern
Observatory (ESO 70.B-0338)..
Abstract
Double-barred galaxies are common in the local Universe, with approximately one third of barred spirals hosting an smaller, inner bar. Nested bars have been proposed as a mechanism for transporting gas to the very central regions of the galaxy, trigger star formation and contribute to the growth of the bulge. To test this idea, we perform for the first time a detailed analysis of the photometry, kinematics and stellar populations of a double-barred galaxy: NGC 357. We find that this galaxy is either hosting a pseudobulge or a classical bulge together with an inner disc. We compare the relative mean luminosity-weighted age, metallicity and -enhancement between the (pseudo)bulge, inner bar and outer bar, finding that the three structures are nearly coeval and old. Moreover, the bulge and inner bar present the same metallicity and overabundance, whereas the outer bar tends to be less metal-rich and more -enhanced. These results point out that, rather than the classical secular scenario in which gas and star formation play a major role, the redistribution of the existing stars is driving the formation of the inner structures.
keywords:
galaxies: individual: NGC 357 — galaxies: photometry — galaxies: kinematics and dynamics — galaxies: bulges — galaxies: structure — galaxies: evolution.1 Introduction
The structural evolution of disc galaxies and its timescale remain as open questions nowadays. In fact, it is still not clear if the formation of bulges is mostly driven by external processes, such as interactions or mergers, or by the internal secular evolution due to inflow of gas from the galactic disc to the central regions, where it may trigger star formation (see Kormendy & Kennicutt, 2004, for a review). This second scenario implies a slow process that takes place when non-axysimmetric components (particularly bars) redistribute the angular momentum of the galaxy. Given the large number of barred galaxies found in the local Universe (Knapen et al., 2000; Eskridge et al., 2000; Marinova & Jogee, 2007; Menéndez-Delmestre et al., 2007; Aguerri et al., 2009), and that the bar fraction remains significant till z1 (although its evolution with redshift is still a matter of debate, see e.g. Elmegreen et al., 2004; Jogee et al., 2004; Sheth et al., 2008; Cameron et al., 2010), it seems that internal secular processes might actually be an important driver of the evolution in spirals. If this is the case, the resulting kinematical and morphological changes could also lead to an evolution along the Hubble sequence from later to earlier types, as suggested by Friedli & Martinet (1993).
It has been theoretically demonstrated that the flow of gas through a single bar stops before reaching the galactic centre; however, a system of nested bars may efficiently transport the material to the nuclear regions, where it even would help to fuel nuclear activity. This idea was first proposed by Shlosman et al. (1989, 1990), and resulted in an increasing interest in galaxies hosting two or more bars.
Double-barred galaxies are common objects in the local Universe; at least one third of barred galaxies show an additional inner bar (Moiseev, 2001; Erwin & Sparke, 2002; Laine et al., 2002; Erwin, 2004) and nested bars have been found till z0.15 (Lisker et al., 2006). Photometric studies have shown that the two bars are randomly oriented relative to each other (Friedli & Martinet, 1993; Wozniak et al., 1995), suggesting that they rotate independently, as predicted by numerical simulations (Shlosman & Heller, 2002; Debattista & Shen, 2007) and confirmed by observations (Corsini et al., 2003). Moreover, it seems there is no correlation between the presence of an inner bar and the Hubble type of the host galaxy or its main bar properties. Erwin & Sparke (2002) find that inner bars extend to 12% of the outer bar size, and that have in general smaller ellipticities, but may be larger since the inner bar might be embedded in the light of the bulge.
Maciejewski & Sparke (1997); Maciejewski & Sparke (2000) study the dynamics of double-barred objects and develop a simple formalism to study the orbits of their stars based on the loop concept. Single bars are characterized by two fundamental frequencies (one for the bar and one for the free oscillations), allowing the existence of closed and periodic orbits. In fact, two orbital families stand out for a single-barred potential: the x1 orbits, elongated along the bar major axis, and the x2 orbits, perpendicular to it (Contopoulos & Papayannopoulos, 1980). A double-barred potential needs an additional frequency to be described, meaning that closed orbits are not possible. A loop is a family of orbits whose populating particles return to the same curve when the two bars recover the relative position between them, although each individual particle is not in its initial position. This means that only the global shape of the orbit is preserved.
The challenge of building long-lived double bars led to many numerical simulations, most of them getting galaxies where the outer bar appears first, the gas flows along it and then it is captured by the x2 orbits of the main bar, subsequently forming the inner bar. In this scenario the dissipative component plays a major role (Friedli & Martinet, 1993; Heller et al., 2001; Shlosman & Heller, 2002; Rautiainen et al., 2002; Englmaier & Shlosman, 2004). However, some authors get double-barred systems without such a dissipational process. This is the case of Debattista & Shen (2007), who perform collisionless N-body simulations and obtain purely stellar inner bars. These inner bars form before the apparition of the outer bars. Finally, Heller et al. (2007) generate for the first time a two bar system from a dark matter halo. In this case, both bars are gas-rich and transport material to the central regions, supporting the hypothesis of Shlosman et al. (1989, 1990).
With these pieces of evidence, it is clear that double-barred galaxies are the perfect benchmark to constrain the role of secular processes within galaxy nuclei. One way to proceed is to perform a detailed stellar population analysis of these systems: if double bars are playing a major role in galaxy evolution, this fact will be reflected in the properties (star formation, age, and metallicity) of the galaxy components (bulge, inner bar, outer bar, and disc), resulting in a gradient of ages and metallicities between them. However, this is difficult to achieve due to the structural complexity of galaxies with nested bars, as illustrated by the photometric properties mentioned above. To date, there are few stellar population studies involving double bars, all of them being projects devoted to the analysis of samples of barred galaxies in general, which include only some double-barred objects. For this reason, these works focus only on the main bar and they do not account for the inner bar. This is the case in the set of papers by Pérez et al. (2007); Pérez et al. (2009), Pérez & Sánchez-Blázquez (2011), and Sánchez-Blázquez et al. (2011), who study the stellar populations of bars and bulges. They find positive, negative, and even null metallicity gradients along the bars independently of the age distribution. The bulges hosted in barred galaxies tend to be more metal-rich than those in unbarred galaxies at a similar velocity dispersion. However, the implications of these results within evolutionary scenarios is still unclear.
Other works study double-barred objects from a purely kinematical point of view (Emsellem et al., 2001; Moiseev, Valdés, & Chavushyan, 2004; de Lorenzo-Cáceres et al., 2008). de Lorenzo-Cáceres et al. (2008) present the 2D stellar velocity and velocity dispersion maps for a sample of four double-barred galaxies, based on observations with the SAURON integral field spectrograph. The analysis of high quality velocity dispersion maps revealed two local minima, located exactly at the ends of the inner bar of each galaxy. By means of numerical simulations, de Lorenzo-Cáceres et al. (2008) conclude that these -hollows appear because of the strong contrast between the velocity dispersions of the bulge and the inner bar. This result indicates that bars are dynamically cold components, with velocity dispersion values significantly lower than those of the hot, classical bulge. Moreover, the -hollows are the kinematical signature of the presence of an inner bar.
In this paper, we present the first detailed morphological, kinematical and stellar population analysis of the different structures that comprise a double-barred galaxy: bulge, inner bar and outer bar. We focus on the case of NGC 357. The work is organised as follows: in Section 2 we list the relevant properties of NGC 357 from the literature, while in Section 3 we summarise the observations and the data reduction procedure. Then, we describe the morphology and kinematical profiles in Sections 4.1 and 4.2, respectively. Section 4.3 details the stellar population analysis, from the emission lines correction of the spectra to the detailed study of the bulge region and the comparison between structural components. A discussion of the implications of these results for the structure and possible formation scenarios of NGC 357 can be found in Section 5. Finally, Section 6 sets out the main conclusions of this work.
2 Main properties of NGC 357
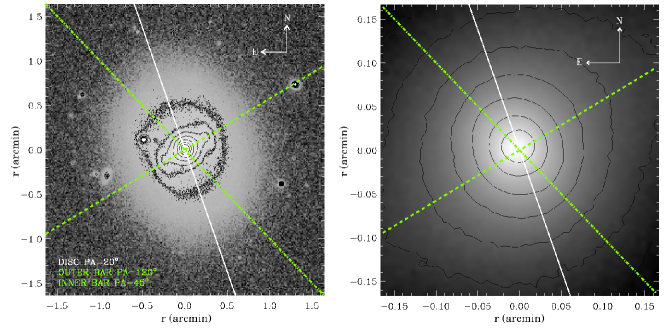
NGC 357 is classified as SB(r)0/a by de Vaucouleurs et al. (1991) and as SBa by Sandage & Tammann (1981). This galaxy appears in the catalogue of double-barred galaxies of Erwin (2004), who provides information about the properties of the main and the inner bar of NGC 357, based on the analysis of infrared images from the Hubble Space Telescope. The two bars of NGC 357 are almost perpendicular, with the inner one almost parallel to the major axis of the galaxy, as seen in Figure 1. We have specifically chosen this early-type spiral in order to avoid the presence of complex structural components and dust, which can make the stellar population analysis very tricky. The galaxy distance is 31.6 Mpc (Erwin, 2004), which corresponds to 150 pc arcsec-1. The relevant properties of NGC 357 are shown in Table 1.
| NGC 357 | ||||
| Inclination | PA | Semi-major axis | ||
| (1) | (2) | (3) | (4) | |
| Inner bar | - | 45∘ | 3.1 arcsec | 0.16 |
| Outer bar | - | 120∘ | 21 arcsec | 0.44 |
| Disc | 36∘ | 20∘ | - | - |
(1) galaxy inclination (Aguerri et
al., 2005);
(2) position angle (hereafter PA) of the major axis of the galaxy (disc; Aguerri et
al., 2005)
and the two bars (Erwin, 2004);
(3) bar lengths, estimated as the semi-major axes of maximum isophotal ellipticity (Erwin, 2004), and
(4) maximum isophotal ellipticity of the bars (), from Erwin (2004).
Although some studies claim this galaxy is isolated (e.g., Gadotti et al., 2007), van den Bergh (2002) finds it belongs to a group with at least six other members. However, it shows no signatures of interaction with its closer companions. NGC 357 is classified as a LINER (Gadotti et al., 2007).
The structural properties of NGC 357 have been studied photometrically by several authors. In this way, Aguerri et al. (2005) perform a photometric decomposition of an I-band image of this galaxy along its outer bar major axis, getting the main photometric parameters of its structural components, namely bulge, outer bar and disc; they do not take into account the inner bar since its contribution to the radial surface brightness along the main bar is negligible. Their main conclusion is that the bulge of NGC 357 follows the same fundamental plane than the ellipticals and other bulges of S0 galaxies.
3 Observations and data reduction
The spectroscopic observations of NGC 357 were carried out with the 3.5-m New Technology Telescope (NTT) at the European Southern Observatory (ESO) in La Silla (Chile) on 5-13 October 2002. The ESO Multi-Mode Instrument (EMMI) was operated both in blue (BLMD) and red medium-dispersion spectroscopic (REMD) mode.
The NTT mounted EMMI in BLMD using the grating No. 3 blazed at 3800 Å with 1200 grooves mm-1 in first order in combination with a 1.3 arcsec 5.5 arcmin slit. The detector was the No. 31 Tektronix TK1024 EB CCD with pixels of m2. It yielded a wavelength coverage between about 3990 Å and 4440 Å with a reciprocal dispersion of 0.45 Å pixel-1. The spatial scale was 0.37 arcsec pixel-1. The instrumental resolution was 1.3 Å (FWHM) corresponding to km s-1.
Six spectra of 45 min each were taken aligning the slit with the major axis of the inner bar (). Two more spectra of 45 min each were obtained aligning the slit with the major axis of the outer bar (). All the spectra were obtained using the guiding TV camera to center the slit on the galaxy nucleus.
The NTT mounted EMMI in REMD using the grating No. 6 blazed at 5200 Å with 1200 grooves mm-1 in first order. A 1.0 arcsec 5.5 arcmin slit was adopted. The mosaiced MIT/LL CCDs No. 62 and 63 with pixels of m2 covered the wavelength range between about 4800 Å and 5460 Å. The on-chip pixel binning provided a reciprocal dispersion and spatial scale of 0.40 Å pixel-1 and 0.332 arcsec pixel-1. The instrumental resolution was 1.6 Å (FWHM) corresponding to km s-1.
After centering the slit on the galaxy nucleus, two spectra of 30 min each were obtained along the disc major axis ().
The range of the seeing FWHM during the observing runs was 0.6-1.4 arcsec as measured by the ESO Differential Image Motion Monitor. A comparison lamp exposure was obtained after each object integration to allow accurate wavelength calibration. Quartz lamp and twilight sky flatfields were used to remove pixel-to-pixel variations and large-scale illumination patterns. Several G and K stars and spectrophotometric standard stars were observed with the same set-up to serve as templates in measuring the stellar kinematics and in flux calibration, respectively.
All the spectra were overscan and bias subtracted, flatfield corrected, corrected for bad pixels and columns, and wavelength calibrated using standard IRAF111Imaging Reduction and Analysis Facilities (IRAF) is distributed by the National Optical Astronomy Observatories which are operated by the Association of Universities for Research in Astronomy (AURA) under cooperative agreement with the National Science Foundation. routines. The cosmic ray removal is a critical step since any residual might affect the spectral lines measured to derive the properties of the stellar populations. It was performed with the REDUCEME package (Cardiel, 1999), that assures a careful and accurate inspection and interpolation of the spectra. We checked that the wavelength rebinning was done properly by computing the difference between the measured and predicted wavelengths (Osterbrock et al., 1996) for the brightest night-sky emission lines in the observed spectral ranges. The resulting accuracy in the wavelength calibration is better than 5 km s-1. The spectra taken along the same axis were co-added using the centre of the stellar continuum as reference. The contribution of the sky was determined from the outermost regions at the two edges of the resulting spectra, where the galaxy light was negligible, and then subtracted, giving a sky subtraction better than 1%. A one-dimensional sky-subtracted spectrum was obtained for each kinematical template star. The sky-subtracted spectra were flux calibrated using the observed spectrophotometric stars as a reference. Neither extinction nor dust corrections were applied for the blue spectra since the wavelength coverage is short and we are not interested in colour measurements.
Finally, the galaxy spectra were binned along the spatial direction in order to assure a minimum signal-to-noise ratio (S/N hereafter) of Å-1, sufficient to our kinematic analysis. Such a minimum S/N is reached only in the outermost radial bins, it increases at smaller radii reaching a maximum S/N Å-1 in the radial bin corresponding to the galaxy centre. The spatial binning procedure was carefully carried out in order to assure the separation of the different structural components of NGC 357 (i.e., the bulge, inner, and outer bar).
4 Analysis and results
4.1 Photometry
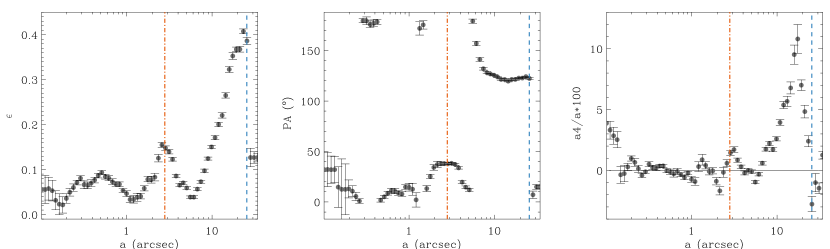
As a first approach to disentangling the morphology of NGC 357, we perform an ellipse fitting over a NICMOS2 F160W image taken from the Hubble Legacy Archive (Prog. Id. 7330, PI John Mulchaey). For this purpose we use the IRAF task ELLIPSE, which follows the procedure outlined by Jedrzejewski (1987). Figure 2 shows the resulting profiles of ellipticity, , position angle, PA, and the fourth cosine Fourier coefficient, . The presence of the bars causes two sharp changes in the ellipticity and PA parameters: one peak at 3 arcsec related to the inner bar, and a discontinuity at 25 arcsec due to the outer bar. These two values are in agreement with the bar lengths estimated by Erwin (2004). The profile also shows two peaks at the locations of the two bars. is a measurement of the deviation of the isophotes from pure ellipses, so positive values correspond to discy isophotes whereas negative values to boxy isophotes (Jedrzejewski, 1987; Kormendy et al., 2009). Therefore, the two bars of NGC 357 present discy isophotes.
We get a maximum isophotal ellipticity of 0.15 and 0.4 for the inner and outer bars, respectively, and a PA40∘ for the inner bar, PA120∘ for the outer bar, and PA15∘ for the disc. These measurements are also consistent with the estimates of Erwin (2004) and Aguerri et al. (2005).
4.2 Kinematics
4.2.1 Measuring the line-of-sight velocity and velocity dispersion
Two different techniques were used to derive the velocity and velocity dispersion profiles of NGC 357: a cross-correlation in the Fourier domain and a full spectrum fitting in wavelength space. The cross-correlation procedure (e.g., Tonry & Davis, 1979) is as follows: among the observed velocity standards, we select those that are spectroscopically most similar to the galaxy. After correcting them to rest frame, we combine the stellar spectra to create an artificial velocity standard star spectrum that will be used as a template for the cross-correlation. This standard spectrum is then broadened to several velocity dispersions and the results are correlated with the original star, obtaining for each case a cross-correlation peak with its full width half maximum (FWHM). Thus, we create a calibration table that provides the FWHM we expect if a spectrum with a given velocity dispersion is cross-correlated with our stellar template, so we can get the dispersion of the galaxy spectra by correlating them with the star. The line-of-sight velocity is a direct product of the correlation since the template is at rest.
For the full spectrum fitting we have made use of the penalized pixel fitting (hereafter pPXF) routine developed by Cappellari & Emsellem (2004). The spectral regions which are potentially affected by emission lines are previously masked on each galaxy absorption spectrum, which is then fitted with a linear combination of a well-selected subsample of the single stellar population models (hereafter SSPs) of Vazdekis et al. (2010), previously convolved with a line-of-sight velocity distribution (hereafter LOSVD). This LOSVD is parametrized by an expansion in Gauss-Hermite functions (Gerhard, 1993; van der Marel & Franx, 1993); since the S/N requirements for this procedure get more demanding as the order of the desired LOSVD moments increases, we decided to focus only on the velocity and velocity dispersion to avoid the loss of spatial resolution caused by a wider radial binning.
The two methods used for deriving the kinematics of NGC 357 are completely independent and even work in different parameter spaces. In order to enhance the differences between both techniques, we explore two different ways that offer complementary advantages: whereas the SSPs help to alleviate the template mismatch problem (Falcón-Barroso et al., 2003), the artificial template was obtained by stellar spectra, which were observed and reduced exactly in the same way as the galaxy spectra, thus minimizing the possibility of introducing instrumental effects.
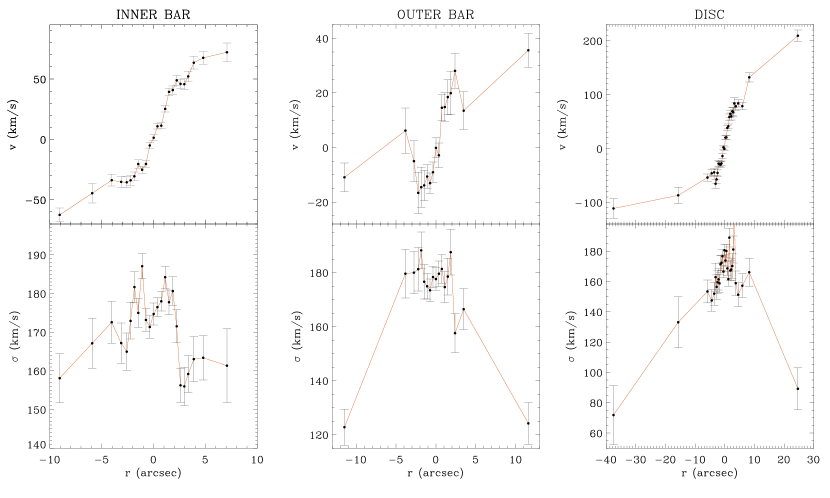
The results obtained from both methods are fully consistent, with differences smaller than the corresponding error bars. These differences range from few km s-1 in the central regions to a maximum of 10 km s-1 in the farthest observed radii. Figure 3 shows the final line-of-sight velocity (after subtracting the systemic velocity) and velocity dispersion profiles obtained with pPXF along the major axis of the inner bar, outer bar, and disc.
4.2.2 Revealing the inner and outer bars
The presence of the inner bar is clearly unveiled by the shape of the rotation curve (Figure 3, left panels), that follows the same characteristic S- or double-hump profile previously observed for inner bars by Emsellem et al. (2001). This profile is characterized by an inner steep slope so the rotation reaches a local maximum, it slightly drops to a local minimum and then it raises again slowly further out. Since the two bars of NGC 357 are almost perpendicular, with the inner one almost parallel to the major axis of the galaxy, we can conclude that the double-hump profile in Figure 3 is completely due to the presence of the inner bar. This kind of rotation curve was theoretically derived by Chung & Bureau (2004) and Bureau & Athanassoula (2005) by means of N-body simulations of single-barred galaxies; in this last work, the authors show that the double-hump structure is more enhanced in galaxies with strong bars seen end-on, whereas the effect is weakened for larger viewing angles or weaker bars. Although the double-hump rotation curve is clearly visible in the case of the inner bar of NGC 357, suggesting the bar is strong, the maximum isophotal ellipticity is only 0.15, which indicates that it is actually a very weak bar. Indeed, the maximum ellipticity of the isophotes in a bar region correlates well with the bar strength (Laurikainen et al., 2002).
The velocity dispersion profile along the inner bar shows three local minima: a central drop corresponding to the so-called -drop of Emsellem et al. (2001), and two symmetric decreases exactly at the edges of the bar (4 arcsec) that can be identified as the -hollows (de Lorenzo-Cáceres et al., 2008), known to be signatures of an inner bar. These hollows have an amplitude of 20 km s-1, consistent with the findings of de Lorenzo-Cáceres et al. (2008), who found amplitudes ranging from 10 to 40 km s-1. Further discussion on these features and their different origins is found in Section 5. As expected, the velocity dispersion decreases outwards.
The outer bar of NGC 357 (Figure 3, middle panels) is almost perpendicular to the major axis of the galaxy, which we assume to be the kinematical line of nodes. This means that the line-of-sight velocity values along the outer bar are expected to be very low, as it is shown in Figure 3. However, a clear kinematical decoupled profile appears in the central region. This structure rotates faster than its surroundings and extends 2 arcsec, which corresponds to the radial region of the -drop observed in the velocity dispersion profile. A closer inspection to the inner bar velocity profile reveals the same decoupling, since two steep humps appear inside the double-hump profile, exactly at 2 arcsec. Unfortunately, the low S/N level of the spectra along the direction of the outer bar of NGC 357 only allows us to analyse the kinematics in the inner 10 arcsec, so we cannot explore the whole main bar to see if other signatures, as for example the -hollows or the double-hump profile, are present.
The kinematics along the major axis of the disc is shown in Figure 3 (right panels). In this case, we find as expected the maximum line-of-sight velocity values and the same central signatures found for the other directions: the decoupling in the velocity profile and the -drop. In Section 5 we discuss the possible structures that might be causing these signatures.
4.3 Stellar populations
The aim of this stellar population analysis is to recover the relative ages, metallicities, and formation timescales of the different structural components of NGC 357: bulge, inner bar, and outer bar. Unfortunately, the quality of the data, although very high, still is not sufficient to analyse the disc, which requires spectra taken with 10 m-class telescopes. To perform this detail study, we have summed up the individual spectra, previously corrected for their kinematics (velocity and velocity dispersion), to reach the desired S/N within each structural component. For this purpose, we only add those spectra corresponding to the regions where a given component is clearly dominating the total luminosity: the inner 1 arcsec for the bulge, from 2 arcsec to 4 arcsec for the inner bar, and from 4 arcsec to 15 arcsec (limited in this case by S/N requirements) for the outer bar. Since the spectra along the major axes of the two bars and the disc always cover the central region, we have two spectra for the bulge in the blue and red spectral range, respectively. However, the bars were observed only in the blue spectral range.
Again, we have chosen two methods to analyse the stellar populations: the line-strength indices and a full spectrum-fitting approach. Unlike using the Lick/IDS system, we have chosen to perform our line-strength analysis on the system imposed by the kinematics of the galaxy, as done in Vazdekis et al. (2001) and Yamada et al. (2006). For the second approach, we use the cross-correlation technique employed by Vazdekis (1999) and Vazdekis & Arimoto (1999).
In both cases, comparisons with stellar population synthesis models are needed; as for the kinematics, we have used the empirical models of Vazdekis et al. (2010), built from the MILES stellar library (Sánchez-Blázquez et al., 2006). These models have a wide wavelength coverage (from 3525 to 7500 Å) and a resolution of 2.5 Å (FWHM), constant over the whole spectral range (Beifiori et al., 2011; Falcón-Barroso et al., 2011).
4.3.1 Emission line correction
The ionized gas present in the galaxy leads to emission lines that contaminate the spectrum and fill in the absorption lines. Therefore, it is crucial to correct for this emission to get the properties of the stellar populations from the spectra. Indeed, if a proper separation of both contributions (the stellar absorptions and gaseous emissions) is not performed before the analysis, the measured ages will be artificially older. In our particular case, we need to clean up the three Balmer lines included in our spectral range (H, H and H), and the Fe5015 and Mgb indices, which can be affected by the [OIII]4959,5007 and [NII]5198,5200 lines, respectively.
The common procedure for this correction is to mask the spectral region possibly contaminated by emission lines and fit the obtained spectrum with a set of stellar population models. For this purpose we use the ULySS222Available at http://ulyss.univ-lyon1.fr/. package (Koleva et al., 2009), which minimizes the between the observed spectrum and a model spectrum consisting of a linear combination of non-linear parameters (age and metallicity), corrected for the kinematics and multiplied by a polynomial to avoid flux calibration problems. We subtract the ULySS best fit spectrum to the original one in order to get the residuals plus the contribution of the emission lines. We then approximate each emission line with a Gaussian, considering only those features with an amplitude larger than three times the standard deviation of the residuals.
Given the sensitivity of the emission correction, we double-check it by repeating it with the GANDALF package (Sarzi et al., 2006). The advantage of GANDALF is that it fits simultaneously the stellar and the gaseous contributions, by including emission lines as Gaussians in the set of stellar population models used as templates. Although GANDALF is also based on minimization, it differs from ULySS in that it fits the stellar contribution with a linear combination of models, while ULySS interpolates the grid of templates to look for the most appropriate single stellar population model.
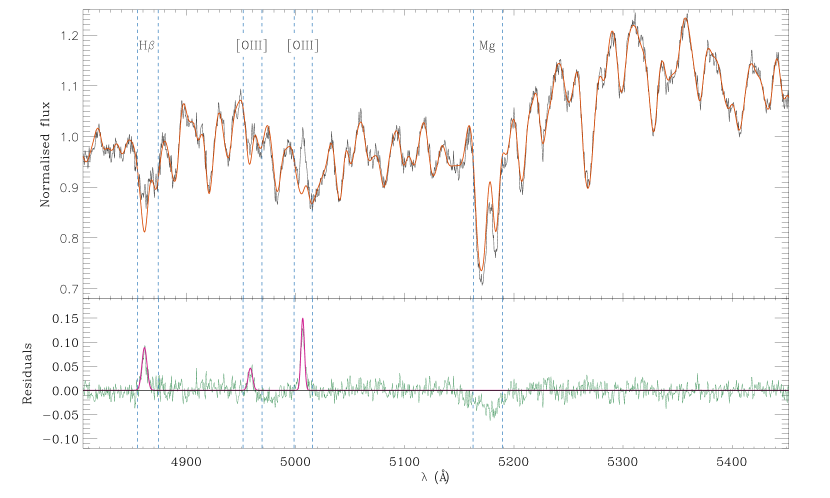
There are many details to take care of when fitting the full spectrum, such as the initial guesses and the number and range of the masked regions. For example, in the case of the blue spectra of NGC 357, we are forced to mask the CN band as we find evidences of its -enhancement (not included in the scaled-solar models of Vazdekis et al., 2010). When the amount of emission derived from the two routines is in agreement, we subtract it from the observed spectra and use the results for the analysis of the stellar populations. Figure 4 presents an example of the fitting performed with ULySS for the bulge red spectrum because it shows H and [OIII]5007, which are the most prominent emission lines we observed.
4.3.2 Line-strength indices
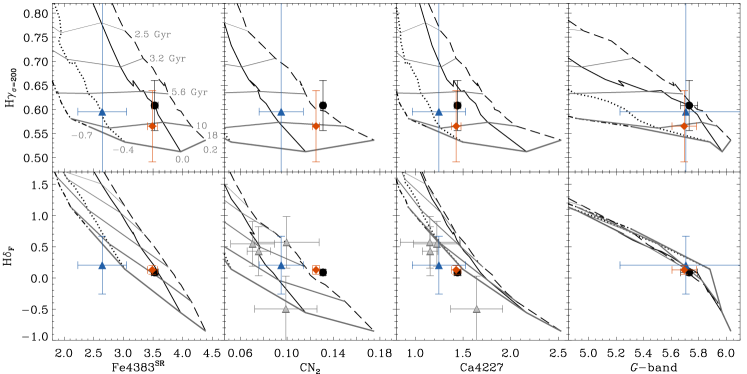
A set of suitable absorption line-strength indices are measured over the emission-cleaned spectra of the bulge, inner bar, and outer bar, as well as over the Vazdekis et al. (2010) models. In order to compare the results of the three components, the galaxy spectra and the SSPs are first degraded to their maximum resolution, given by the higher value of the velocity dispersion profile (180 km s-1). All the measurements are performed in the same system, i.e., the one defined by the kinematics of the galaxy in a consistent way. We plot the values obtained for an age indicator versus those of a metallicity indicator for the SSP models, in order to obtain model grids such as those shown in Figures 5 and 6. These grids are not perfectly orthogonal due to the age-metallicity degeneracy. The mean luminosity-weighted ages and metallicities of each structural component of NGC 357 can then be derived by simply overplotting the observed indices on these grids.
In particular, we computed all the Lick indices included in our spectral range, following the definitions given by Trager et al. (1998). Note that although the index definitions are similar, our model measurements are not in the Lick/IDS resolution and IDS instrumental system, but at constant and flux-calibration response curve. Since the red pseudo-continuum of the Fe4383 index falls partially out of our blue spectral range, we have defined a new Fe4383SR index (named after Short Red, see Appendix A for details). Table 2 presents the definitions of the new Fe4383SR and the original Lick/IDS Fe4383 index.
| Index | Blue pseudo-continuum | Main bandpass | Red pseudo-continuum | Source |
|---|---|---|---|---|
| (Å) | (Å) | (Å) | ||
| Fe4383SR | 4359.125-4370.375 | 4369.125-4398.087 | 4419.328-4432.389 | this paper |
| Fe4383 | 4359.125-4370.375 | 4369.125-4420.375 | 4442.875-4455.375 | Trager et al. (1998) |
For the bulge red spectrum, we compute the combined Iron-index and total metallicity indicator [MgFe]333 (González, 1993). We avoid the use of the Fe5015 index, since it is highly contaminated by the prominent [OIII]5007 emission line.
In addition to the Lick age index-definitions for the Balmer lines (H, H and H), we also measure the more powerful H (Cervantes & Vazdekis, 2009) and H (Vazdekis & Arimoto, 1999) indices, which show great abilities to disentangle ages. The use of indices with enhanced sensitivity to the age or metallicity represents an advantage to lift the degeneracy between these parameters.

4.3.3 Cross-correlation analysis
The alternative technique we use to analyse the stellar populations of NGC 357 is to cross-correlate the galaxy spectrum with each SSP spectrum from the Vazdekis et al. (2010) model library. For this purpose the model spectra are previously prepared to match the spectral range, velocity dispersion, and spectral resolution of the data. Moreover, the galaxy and model spectra are rebinned logarithmically and normalized to remove the continua.
In order to optimize the cross-correlation method for disentangling different stellar populations, it is necessary to adequately filter the spectra and multiply them by a cosine-bell-like function (Tonry & Davis, 1979). The importance of choosing a suitable filter lies in the possibility of getting rid of the noise in the spectrum; this purpose can be achieved by simply removing the largest wavenumbers, where the information about the shortest wavelength ranges is included. Therefore, the limit is imposed by the resolution of the data. On the other hand, shorter wavenumbers contain information about wider spectral ranges, so possible residuals of the continuum removal due to errors in the flux calibration might also be filtered. The drawback of this procedure is that it implies a power loss of the final cross-correlation function, specially when filtering short wavenumbers where most of the signal is included.
Apart from the filtering, it might be required to mask some regions in the original spectra, as is usually done in the full-spectrum fitting technique in the wavelength space. We tested different masks trying to avoid those features that are not well reproduced by the models due to mismatched abundance ratios: the CN in the blue spectral range and the Mg and H features in the red spectral range. Again, these features contain most of the signal of the power spectrum so the choice of the masks has to be done very carefully in order to not lose most of the information.
Finally, the peak height obtained for each correlation function is plotted against the model age and metallicity. Since the cross-correlation profile reaches a higher value when object and template are more similar (getting a maximum value of 1 if they are exactly the same and no filtering is applied), the maximum value in the final peak heights plot indicates which template best resembles the galaxy spectrum. This method takes advantage of the full information contained in the spectrum, instead of being constrained to certain features as in the case of the line-strength indices. This type of full-spectrum fitting technique works in the Fourier space and, as an additional advantage, it does not need for a previous emission correction of the data. The application of this technique to the derivation of the stellar populations was already introduced by Vazdekis (1999) and Vazdekis & Arimoto (1999) and in this work it is adopted to double-check the results obtained from the analysis of the line-strength indices.
To compute the errors for the cross-correlation method we perform a set of 100 Monte Carlo simulations by randomly adding Gaussian noise to the data, keeping the original S/N ratio. The 1- regions are then overplotted to the cross-correlation peak height curves. In order to test the requirements of this method we run some simulations with the Vazdekis et al. (2010) models by artificially changing the different parameters involved: spectral resolution, spectral range, and S/N ratio, taking as a reference the values measured for our observed spectra. We find that the S/N of the data obtained for the outer bar is not enough to disentangle its age and metallicity, since the error bars for this case are too large (see Appendix B). This prevents us from providing a more constrained solution for the outer bar through the cross-correlation analysis. We have to note that the results obtained here are aimed to be complementary to those from the line-strength analysis. Therefore, we restrict the application of the cross-correlation to the bulge and inner bar. These results are shown in Figures 7 and 8, and will be analysed in Sections 4.3.4 and 4.3.5, respectively.


4.3.4 Stellar populations of the bulge
Figure 5 shows the analysis of the line-strength indices of the bulge of NGC 357. Four age indicators are plotted against several well selected metallicity indicators and the G-band, using features from both the red and blue spectral ranges available for this component. Balmer lines might be affected by emission line contamination, although the amplitude of this emission decays from the top (H and H) to the bottom (H) indices of Figure 5. In fact, we find no emission in the H feature for the bulge. For the case of H and H, where the emission contamination is larger, we find some disagreements in the resulting ages with respect to those derived from H and H. Although the emission correction has been performed very carefully (see Section 4.3.1), these inconsistencies are probably due to an underestimation of the emission affecting the H feature within the noise level. As an attempt to take this effect into account, the H and H error bars are obtained by computing the maximum and minimum (but no null) 1- emission correction.
Moreover, we find subtle differences between the ages obtained with the H and H indices. These differences might be attributed to either the emission correction, that affects the two definitions in a different manner, or to the greater sensitivity of H to the -enhancement in comparison to that of H (Cervantes & Vazdekis, 2009). Indeed, these differences are more evident in the -enhanced indicators (Mgb and CN2), whereas the results from Fe or Ca 4227 are almost identical. Taking into account the error bars and the results from all the plots in Figure 5, we derive a mean luminosity-weighted age of 8 Gyr for the bulge of NGC 357.
From the first column in Figure 5, where the total metallicity indicator [MgFe] is plotted, we derive a supersolar metallicity 0.2 dex for the bulge of NGC 357. For this component we also measure the Fe, Mgb, and CN2 indices, so that it is possible to estimate the [ZMg/Z⟨Fe⟩] and [Z/Z⟨Fe⟩] ratios, which are calculated as the relative metallicity difference obtained when plotting the various metallicity indicators versus the Mg (Vazdekis et al., 2001). [ZMg/Z⟨Fe⟩] and [Z/Z⟨Fe⟩] are shown to be good proxies for the [Mg/Fe] and [CN/Fe] abundance ratios. In fact, [ZMgb/Z⟨Fe⟩] and [Mg/Fe] follow a linear relation, as shown in Vazdekis et al. (2010). These overabundances are important because they can be used to constrain the timescale for the formation of the bulk of their stellar populations: Mg (as well as other elements) is the product of type II supernovae, which explode soon after the star formation; on the contrary, the Iron-peak elements are ejected by type Ia supernovae, on longer timescales of around 1 Gyr. In the meantime between those two cases, the low- and intermediate-mass stars enrich the interstellar medium with C and N. Therefore, the [ZMgb/Z⟨Fe⟩] and [Z/Z⟨Fe⟩] values might help to put constraints on the assembly history of a galaxy. In the case of NGC 357, we find [ZMgb/Z⟨Fe⟩]=0.3-0.4 dex, which is the value expected for an E/S0 galaxy of 180 km s-1 according to the well-known correlation between [ZMg/Z⟨Fe⟩] and for early-type objects (e.g., Jørgensen, 1999; Trager et al., 2000; Kuntschner, 2000; Vazdekis et al., 2004; Carretero et al., 2004). Note that an extrapolation of the grid is necessary to estimate the [Mg/H] abundance, since the models do not extend beyond [Z/H]=0.2 dex. We also find a supersolar [Z/Z⟨Fe⟩] ratio for the bulge of NGC 357, that reaches 0.2 dex.
Note that the bulge of NGC 357 shows subsolar values for the Ca 4227 index. This is the expected behaviour for galaxies of similar central velocity dispersion. In fact, rather than resembling other elements as the Mg, Ca tends to get subsolar values (Vazdekis et al., 1997).
In order to find out if the formation of the bulge of NGC 357 has followed a distinguished process due to the presence of the inner bar, we compare our results with those obtained for various elliptical galaxies and other spiral bulges. Thus, we have overplotted the index values for two Virgo ellipticals with a central 180 km s-1, taken from the sample of Yamada et al. (2006). These measurements appear as two open circles in Figure 5. Moreover, we have selected a subsample of four early-type barred galaxies from the works by Pérez et al. (2007); Pérez et al. (2009) and Pérez & Sánchez-Blázquez (2011) with central velocity dispersions similar to that of NGC 357. Two galaxies host a single bar (NGC 1169 and NGC 1358), and two are double-barred systems (NGC 2859 and NGC 2962). For these objects, we have measured the mean line-strength indices inside the bulge region from the values at a resolution of 180 km s-1. The results, when possible, are also shown in Figure 5 as grey filled circles. In general, the age, metallicity and -enhancement obtained for NGC 357 resemble very closey those of the comparison bulges. The age and metallicity of the Virgo ellipticals are also in agreement with NGC 357, although they show a larger [Z/Z⟨Fe⟩] enhancement, with a mean value above 0.3 dex.
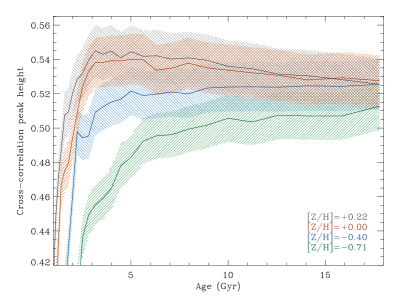
The results for NGC 357 from the line-strength analysis are also verified by the cross-correlation method. Figure 7 shows the peak heights resulting from cross-correlating the bulge spectra with SSPs of different ages and metallicities, following the methodology described in Section 4.3.3. From both spectral ranges, we obtain a supersolar value ([Z/H]0.2 dex) for the mean luminosity-weighted metallicity, and a final age of 7-8 Gyr (although the error regions span a wider range). So far, the cross-correlation method alone is not able to clearly distinguish a mean luminosity-weighted stellar population above 5 Gyr, due to the flattening of the cross-correlation peak heights versus age profiles and the amplitude of the error bars. For younger ages, Figure 7 shows that the curves are steeper, allowing to disentangle between different populations very efficiently. However, the fact that the results obtained from this procedure directly agree with the line-strength analysis, points out the potential power of this method. Note that the age-metallicity degeneracy is evident in Figure 7: the shoulder of each metallicity curve (i.e., the point where there is a clear transition in the slope) occurs at older ages for lower metallicities.
4.3.5 Stellar populations of the inner and outer bars
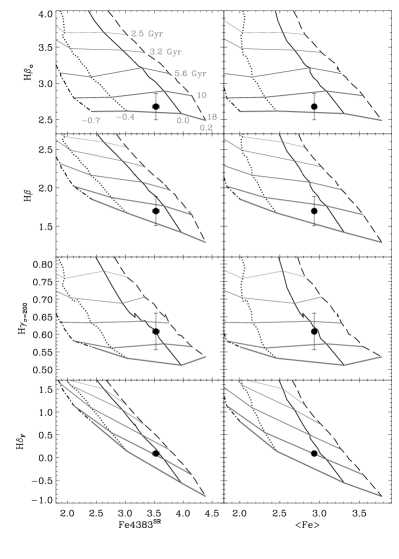
The relative ages and metallicities between bulge, inner bar and outer bar of NGC 357 are shown in Figure 6, where the age indicators H and H are plotted against various metallicity indicators (including the new Fe4383SR definition) and the G-band. In this case we are limited to indices in the blue range, since it is the only spectral range available for the two bars.
In the first panel of Figure 6 we plot H against Fe4383SR, which provide the most orthogonal grid thanks to the age-disentangling power of H. We find that the bulge and inner bar show approximately the same mean luminosity-weighted age (8 Gyr) and solar metallicity. The outer bar also presents a similar age as the inner structures, but it tends to be less metal-rich ([Fe/H]-0.4 dex). However, the error bars are large due to the S/N requirements of the H index. For this reason it is necessary to complement these results with those from the less orthogonal H versus Fe4383SR grid, which confirms the previous estimations for the bulge and inner bar. The trend towards lower metallicites for the outer bar is also verified. In fact, the only difference we find between the two plots is that the outer bar seems to be slightly older when looking at the H versus Fe4383SR grid. However, taking into account the error bars and the results from the rest of the plots (particularly H versus CN2 and H versus Ca 4227), we must conclude that the three structural components of NGC 357 are nearly coeval.
Since we have measurements for the Fe4383SR and CN2 indices, we can use the [Z/Z] ratio as a proxy for the [CN/Fe] abundance, as we did in Section 4.3.4 with [Z/Z⟨Fe⟩]. We find that, whereas the bulge and inner bar present an overabundance of [Z/Z]0.2 dex, the outer bar has a more enhanced value above 0.4 dex.
To make a comparison with the age and metallicity of other main bars, we take into account the same galaxies we adopted as a reference in Figure 5. We compute the mean values of the line-strength indices along the main bar at a resolution of 180 km s-1 from the data of Pérez et al. (2009). These comparison values are shown in Figure 6 and the plotted errors take into account the variation of the line-strength indices along the main bar. Like for the bulge case, the outer bar of NGC 357 shows no particular features when compared to the other main bars. Indeed, its age and metallicity are within the ranges defined by the control sample.
We apply the cross-correlation method only to the inner bar spectrum since that of the outer bar has too low S/N. The mean luminosity-weighted age and metallicity are consistent with those derived from the analysis of the line-strength indices. Figure 8 shows that although the maximum of the cross-correlation peak heights is obtained for 4.5 Gyr, the solution spans over a wider range (from about 4 to 10 Gyr) when taking into account the error regions. The resulting metallicity, despite the partial overlapping between the solar and supersolar curves, is [Z/H]0.2 dex.
5 Discussion
The various pieces of evidence provided by this work lead to two main questions: which is the real structure of NGC 357, and how this galaxy has been formed. The analysis of the photometry and kinematic constrains the structural composition of NGC 357, which reveals itself as a really complex galaxy. On the other hand, the study of the stellar populations provides surprisingly homogeneus results and sheds light on the most probable assembly process for our galaxy. For the sake of clarity, we split the Discussion in two Sections, devoted to each of these questions.
5.1 Structural components of NGC 357
Photometrical studies have confirmed that NGC 357 is composed of, at least, four structures, namely bulge, inner bar, outer bar and disc (Erwin, 2004; Aguerri et al., 2005). The presence of the inner bar is also supported by the photometrical and kinematical analysis performed in this work. In fact, the ellipticity and PA profiles presented in Figure 2, and the velocity and velocity dispersion profiles along the inner bar direction presented in Figure 3, show clear signatures of this small, secondary bar, as explained in Sections 4.1 and 4.2.
Interestingly, the analysis of the kinematics also shows evidence of an additional, inner component: a kinematically decoupled structure appears at the centre of NGC 357, rotating faster than its surroundings. This decoupling spans approximately 2 arcsec and matches in size with the observed central -drop. The different structures that shape NGC 357 have to account for all the signatures present in the kinematical profiles. In this Section we state the two possibilities that match with the results obtained in this work.
5.1.1 An inner disc and a classical bulge
The presence of a central velocity dispersion minimum in a spiral galaxy was first reported by Bottema (1989). Since then, the number of galaxies showing a -drop has increased significantly. In fact, Falcón-Barroso et al. (2006) find this signature in at least 46% of a sample of 48 early-type spirals, although other cases have been noticed in smaller samples (e.g., Márquez et al., 2003), particularly in barred galaxies and even including late-type spirals (Ganda et al., 2006) and double-barred objects (Emsellem et al., 2001). The most accepted explanation for the formation of -drops in disc galaxies is the star formation at their central regions: the new stars acquire the kinematical properties of the gas they are formed from; the dissipative nature of that gas is more efficient in the central regions because of the higher density and converts the gas into a cold stellar component, such as an inner disc, with a lower velocity dispersion than the surroundings. This scenario is in agreement with the N-body simulations of Wozniak et al. (2003) and Wozniak & Champavert (2006), who made use of bars to transport gas to the central regions.
The case of NGC 357 seems to support that hypothesis since the central decoupling in velocity might be due to an inner disc whose low velocity dispersion would be the cause of the -drop. Therefore, NGC 357 is composed of at least five structures: bulge, inner disc, inner bar, outer bar and disc.
The -drop means a local minimum in the velocity dispersion with respect to the corresponding value for the bulge, which reaches 180 km s-1 or higher (the velocity dispersion profile should peak at the centre, where the -drop masks the velocity dispersion of the bulge). This high velocity dispersion value for the bulge implies it is pressure supported and classical. This result is supported by the work of Aguerri et al. (2005), who find that the bulge of NGC 357 follows the same fundamental plane as the ellipticals or classical bulges of other early-type objects.
Within this context, the appearance of the -hollows at the edges of the inner bar in the velocity dispersion profile is also well understood. The -hollows were first seen in a sample of four double-barred galaxies analysed through integral-field spectroscopy (de Lorenzo-Cáceres et al., 2008). By means of N-body simulations, they tested the possible scenarios that might give rise to these hollows, showing that their size and amplitude depend on two parameters: the relative contribution of the flux of the bulge to the total luminosity and the difference in the velocity dispersion of the two components. Therefore, a galaxy hosting a classical bulge with a high velocity dispersion and a colder, inner bar which dominates the total luminosity at its ends (where the light profile of the bulge has already decayed) will clearly show the two -hollows at the bar edges, as for the case of NGC 357. In this scenario, the bulge is the hottest structural component of NGC 357 and the velocity dispersion decreases for the outer structures. Table 3 indicate the velocity dispersion values for each component. It is important to note that the actual velocity dispersion of the inner disc is probably lower than the value given in Table 3, since the measured value includes the contribution of the bulge within the inner disc region.
There are two important drawbacks for this possible structural composition of NGC 357. First, the signature of the inner disc should be detected in the photometrical analysis presented in Section 4.1. This is the case of the nuclear stellar discs observed in the centre of ellipticals and bulges (Morelli et al., 2010, and references therein). A careful inspection to the inner 2 arcsec in Figure 2 shows no evidence of discy isophotes. Second, the formation of the inner disc is usually related to a recent star formation in the centre, but the analysis of the stellar populations for NGC 357 shows old ages for the central components; a significant young population such as that of an inner disc should be noticed when studying the mean luminosity-weighted age, even if it is mixed with an older, more massive component. Therefore, although this hypothesis seems promising, it does not explain all the properties found in this work.
| Scenario | (Pseudo)bulge | Inner disc | Inner bar | Outer bar | Disc | |
|---|---|---|---|---|---|---|
| (1) | 180 | 170 | 165 | 145 | 105 | |
| (km s-1) | (2) | 170 | - | 180 | 145 | 105 |
(1) Classical bulge + inner disc + inner bar + outer bar + disc;
(2) Pseudobulge + inner bar + outer bar + disc.
5.1.2 A pseudobulge
The second possibility for the structure of NGC 357 is that there is no inner disc. If this is the case, the central kinematical decoupling and the -drop have to be caused by the bulge itself, which therefore shows disc-like properties that indicate it is a pseudobulge rather than a classical one. This hypothesis is strongly supported by the Sérsic index (Sersic, 1968) measured for the bulge of NGC 357 by Aguerri et al. (2005); they performed a photometric decomposition of an I-band image and obtained n=1.400.08, which is compatible with a pseudobulge. Indeed, Fisher & Drory (2008) study a sample of 77 galaxies and find that 90% of pseudobulges have n2, whereas classical bulges have n2.
Within this new context, the -drop is not actually a drop with respect to the higher velocity dispersion of the bulge, but the maximum velocity dispersion of the pseudobulge itself. Of course, the pseudobulge presents a not so high velocity dispersion, since it is rotationally supported, and therefore it can be colder than the inner bar. In this case, the two peaks of the velocity dispersion values at either sides of the centre have to be understood as signatures of the relatively hotter inner bar where this component dominates the total luminosity. The -hollows appear where the bar ends and the light of the pseudobulge is the main contribution to the total flux. The surrounding structure, i.e., the outer bar, is also hotter than the outer parts of the pseudobulge and for that reason the velocity dispersion values increase again beyond the -hollows. The characteristic velocity dispersions for each structure is indicated in Table 3. This scenario is completely different from that of the galaxies shown in de Lorenzo-Cáceres et al. (2008). However, the main conclusion on the origin of the -hollows remains as it is attributed to the contrast of velocity dispersions between components.
This hypothesis also explains the results from the analysis of the morphology of NGC 357: the ellipticity profile acquires approximately the same value at either sides of the peak due to the inner bar, suggesting that the centre and the surrounding regions are dominated by the same structure. Concerning the dynamical support of the bulge, we estimate 0.23 and 0.1 in the bulge region; therefore, the bulge is consistent with an oblate spheroid flattened by rotation (Kormendy & Kennicutt, 2004). Nevertheless, the interpretration of the relation has to be done carefully, since a complex kinematical structure of the galaxy might conduct to misleading results, as it is shown in Emsellem et al. (2011).
5.2 Formation of NGC 357
The analysis of the stellar populations of NGC 357 is focused on three single regions: bulge, inner bar and outer bar. The striking result obtained in this work is that the bulge and inner bar show very similar stellar population properties, indicating that they were formed in the same process or, at least, from the same source of stars. Moreover, the outer bar is also nearly coeval to the inner structures, although it presents a lower metallicity and a larger -enhancement. This result points towards a faster assembly of the outer bar with respect to the bulge and inner bar. Finally, we compare the bulge and outer bar of NGC 357 with other bulges and main bars of single- and double-barred galaxies with similar central values (Pérez et al., 2009; Pérez & Sánchez-Blázquez, 2011), finding no significant differences among them.
The results obtained here for NGC 357 indicate that theories claiming that inner bars play a major role in the secular evolution might not be suitable for this galaxy. If inner bars were key to transport gas to the central regions and trigger star formation there, a gradient in age and metallicity from outer to inner structures would be expected, presenting a younger population in the galaxy centre. Although our galaxy has gas content and probably some star formation is taking place in it, the stellar population analysis indicates that this is not the main mechanism driving the evolution of NGC 357. Therefore, these results lead to the question on how NGC 357 formed.
Numerical simulations have predicted different scenarios for the formation of nested bars systems, most of them requiring the presence of a dissipative component that is dynamically disturbed and generates the secondary bar (e.g., Friedli & Martinet, 1993; Heller et al., 2001; Shlosman & Heller, 2002; Englmaier & Shlosman, 2004). Within this scenario, the inner bar should be younger than the outer bar. However, the two bars of NGC 357 have similar population properties, so they were formed at the same time or, most likely, the existing stars from the outer bar or the disc redistributed and shaped the inner structures. Therefore, only those numerical works that do not need gas to generate the double-barred objects seem to be compatible with the observational evidences shown here for NGC 357. This is the case of the N-body simulations by Debattista & Shen (2007), who use a disc and a rapidly rotating bulge (like a pseudobulge) to create a double-barred system. In these simulations, the inner bar appears first, but this is probably a consequence of the initial presence of the pseudobulge: in the real Universe, the outer bar most likely is formed first, so the pseudobulge would be generated from the gas flow along it. This scenario reinforces the hypothesis of the pseudobulge for the case of NGC 357, since the bulge rotation is an essential condition for generating the two bars within the Debattista & Shen (2007) gas-free framework.
There is one possibility to reconcile the classical secular approach with the observational results for NGC 357, and this is to assume a very fast formation of the central components: immediately after the outer bar was created, the gas flowed along it, triggered a quick star formation and formed the inner bar and the bulge. Within this scenario, the final ages of the three components would be very similar. The outer bar would be slightly older, but this is consistent with our results taking into account the error bars. In this scenario a positive metallicity gradient for the gas along the outer bar is required. Although this fact might be somewhat striking, from a stellar (not gaseous) point of view there is evidence for such gradients. Indeed, Pérez et al. (2009) study a sample of 20 barred galaxies and find that some of them tend to become more metal-rich at the ends of the main bars. Moreover, those objects have older mean ages and higher central velocity dispersions than the rest of the sample, which is in agreement with the properties found for NGC 357. Unfortunately, the S/N ratio of our data is not enough to measure gradients along the main bar to check this possibility.
6 Conclusions
We have performed for the first time a detailed analysis of the morphological, kinematical, and stellar population properties of a prototype double-barred early-type disc galaxy. We put special emphasis on the inner bar in order to constrain its role in the evolution of this galaxy. The observational strategy consisted in taking very deep long-slit spectra along the directions of the inner and outer bars and the major axis of the disc.
The presence of the two bars is clearly revealed by the ellipticity and PA profiles, which show the usual sharp changes due to this kind of structure. Moreover, the kinematical analysis also presents clear signatures due to the inner bar: the double-hump profile in the velocity (Emsellem et al., 2001) and the -hollows in the velocity dispersion (de Lorenzo-Cáceres et al., 2008). These hollows are due to the contrast between the velocity dispersion values of the inner bar and the central structure, that might be a classical bulge with a velocity dispersion higher than the inner bar, or a pseudobulge with a lower velocity dispersion than the bar. The relative contribution of the inner bar to the total flux also influences the size and depth of the -hollows. It remains unclear if the -hollows or other related features may appear for the case of the outer bar. Unfortunately, the S/N of the main bar spectrum is not sufficient to explore the kinematics at its ends.
The analysis of the kinematics of NGC 357 also reveals a kinematically-decoupled structure rotating faster than its surroundings at the centre of the galaxy. This signature matches in size with a central -drop. NGC 357 is the first observed galaxy in which a -drop and the -hollows coexist. This fact illustrates the differences between both signatures: whereas the former are just due to the presence of the inner bar, the latter is caused by an inner, colder structure. Due to the different nature of both signatures, we want to stress that a double-barred galaxy might present a -drop, the -hollows, or both, as in this case.
The structural composition of NGC 357 has to account for all the observational evidences found in the analysis of the photometry and kinematics. The presence of the disc and the two bars is clear, but the central region turns out to be more difficult to disentangle. In fact, two possible scenarios are compatible with the results obtained in this work. The first possibility is that NGC 357 hosts a classical, hot bulge together with an inner disc, which would be responsible of the decoupling in the velocity profile and the -drop. The second scenario is that the bulge of NGC 357 is, in fact, a cold pseudobulge, which is directly related to the kinematical central signatures.
The main conclusion of this work is that the bulge and inner bar show similar stellar population properties (age, metallicity and -enhancement), whereas the outer bar has no significant difference in age but it is less metal-rich and more -enhanced, indicating that it was assembled in shorter timescales than the inner structures. This result seems to discard for this galaxy the traditional secular evolution scenario, in which the star formation triggered by the gas flown along the outer structures is causing the formation of the central parts. Therefore, NGC 357 has been shaped by the redistribution of the existing stars, maybe in a secular way in which stars from the disc form the inner components, or maybe in an initial disc + pseudobulge framework so the inner bar is lately formed from the pseudobulge stars. This last scenario is backed by the numerical work of Debattista & Shen (2007), who create double-barred systems from a pure stellar disc and pseudobulge. In this scenario, the fast rotation of the pseudobulge is the key element to generate bars without the gas contribution.
An analysis such as the one presented in this work for a larger sample of double-barred galaxies is required to derive general and robust conclusions on the formation of these complex objects. Fortunately, the striking results obtained for NGC 357 are motivating and shed light on the importance of carefully studying double-barred galaxies, from the outer disc to the very central regions.
Acknowledgments
We are indebted to Patricia Sánchez-Blázquez and Isabel Pérez for providing the line-strength measurements for the reference barred galaxies. We are also very grateful to Jairo Méndez-Abreu, Jesús Falcón-Barroso, Inma Martínez-Valpuesta, Nacho Trujillo, Reynier Peletier and Mina Koleva, whose help and useful comments have been very important. Comments and suggestions from the anonymous referee have greatly improved this paper. This work has been supported by the Programa Nacional de Astronomía y Astrofísica of the Spanish Ministry of Science and Innovation under grant AYA2010-21322-C03-02. EMC is supported by the University of Padua through grants CPDA089220, 60A02-1283/10, and 60A02-5052/11 and by the Italian Space Agency (ASI) through grant ASI-INAF I/009/10/0. This work benefits from observations made with the NASA/ESA Hubble Space Telescope, obtained from the Hubble Legaxy Archive, which is a collaboration between the Space Telescope Science Institute (STScI/NASA), the Space Telescope European Coordinating Facility (ST-ECF/ESA) and the Canadian Astronomy Data Centre (CADC/NRC/CSA).
References
- Aguerri et al. (2005) Aguerri, J. A. L., Elias-Rosa, N., Corsini, E. M., & Muñoz-Tuñón, C. 2005, A&A, 434, 109
- Aguerri et al. (2009) Aguerri, J. A. L., Méndez-Abreu, J., & Corsini, E. M. 2009, A&A, 495, 491
- Beifiori et al. (2011) Beifiori, A., Maraston, C., Thomas, D., & Johansson, J. 2011, A&A, 531, A109
- Bottema (1989) Bottema, R. 1989, A&A, 221, 236
- Bureau & Athanassoula (2005) Bureau, M., & Athanassoula, E. 2005, ApJ, 626, 159
- Cameron et al. (2010) Cameron, E., et al. 2010, MNRAS, 409, 346
- Cappellari & Emsellem (2004) Cappellari, M., & Emsellem, E. 2004, PASP, 116, 138
- Cardiel (1999) Cardiel, N. 1999, Ph.D. Thesis, Universidad Complutense de Madrid, Spain,
- Carretero et al. (2004) Carretero, C., Vazdekis, A., Beckman, J. E., Sánchez-Blázquez, P., & Gorgas, J. 2004, ApJ, 609, L45
- Cervantes & Vazdekis (2009) Cervantes, J. L., & Vazdekis, A. 2009, MNRAS, 392, 691
- Chung & Bureau (2004) Chung, A., & Bureau, M. 2004, AJ, 127, 3192
- Contopoulos & Papayannopoulos (1980) Contopoulos, G., & Papayannopoulos, T. 1980, A&A, 92, 33
- Corsini et al. (2003) Corsini, E. M., Debattista, V. P., & Aguerri, J. A. L. 2003, ApJ, 599, L29
- de Lorenzo-Cáceres et al. (2008) de Lorenzo-Cáceres, A., Falcón-Barroso, J., Vazdekis, A., & Martínez-Valpuesta, I. 2008, ApJ, 684, L83
- de Vaucouleurs et al. (1991) de Vaucouleurs, G., de Vaucouleurs, A., Corwin, H. G., Jr., Buta, R. J., Paturel, G., & Fouque, P. 1991, Third Reference Catalogue of Bright Galaxies, Springer-Verlag, Berlin
- Debattista & Shen (2007) Debattista, V. P., & Shen, J. 2007, ApJ, 654, L127
- Elmegreen et al. (2004) Elmegreen, B. G., Elmegreen, D. M., & Hirst, A. C. 2004, ApJ, 612, 191
- Emsellem et al. (2001) Emsellem, E., Greusard, D., Combes, F., Friedli, D., Leon, S., Pécontal, E., & Wozniak, H. 2001, A&A, 368, 52
- Emsellem et al. (2011) Emsellem, E., Cappellari, M., Krajnović, D., et al. 2011, MNRAS, 414, 888
- Englmaier & Shlosman (2004) Englmaier, P., & Shlosman, I. 2004, ApJ, 617, L115
- Erwin & Sparke (2002) Erwin, P., & Sparke, L. S. 2002, AJ, 124, 65
- Erwin (2004) Erwin, P. 2004, A&A, 415, 941
- Eskridge et al. (2000) Eskridge, P. B., et al. 2000, AJ, 119, 536
- Falcón-Barroso et al. (2003) Falcón-Barroso, J., Balcells, M., Peletier, R. F., & Vazdekis, A. 2003, A&A, 405, 455
- Falcón-Barroso et al. (2006) Falcón-Barroso, J., et al. 2006, MNRAS, 369, 529
- Falcón-Barroso et al. (2011) Falcón-Barroso, J., Sánchez-Blázquez, P., Vazdekis, A., Ricciardelli, E., Cardiel, N., Cenarro, A. J., Gorgas, J., & Peletier, R. F. 2011, A&A, 532, A95
- Fisher & Drory (2008) Fisher, D. B., & Drory, N. 2008, AJ, 136, 773
- Friedli & Martinet (1993) Friedli, D., & Martinet, L. 1993, A&A, 277, 27
- Gadotti et al. (2007) Gadotti, D. A., Athanassoula, E., Carrasco, L., Bosma, A., de Souza, R. E., & Recillas, E. 2007, MNRAS, 381, 943
- Ganda et al. (2006) Ganda, K., Falcón-Barroso, J., Peletier, R. F., Cappellari, M., Emsellem, E., McDermid, R. M., de Zeeuw, P. T., & Carollo, C. M. 2006, MNRAS, 367, 46
- Gerhard (1993) Gerhard, O. E. 1993, MNRAS, 265, 213
- González (1993) González, J. J. 1993, Ph.D. Thesis, University of California, Santa Cruz
- Heller et al. (2001) Heller, C., Shlosman, I., & Englmaier, P. 2001, ApJ, 553, 661
- Heller et al. (2007) Heller, C. H., Shlosman, I., & Athanassoula, E. 2007, ApJ, 657, L65
- Jedrzejewski (1987) Jedrzejewski, R. I. 1987, MNRAS, 226, 747
- Jogee et al. (2004) Jogee, S., et al. 2004, ApJ, 615, L105
- Jørgensen (1999) Jørgensen, I. 1999, MNRAS, 306, 607
- Knapen et al. (2000) Knapen, J. H., Shlosman, I., Peletier, R. F. 2000, ApJ, 529, 93
- Koleva et al. (2009) Koleva, M., Prugniel, P., Bouchard, A., & Wu, Y. 2009, A&A, 501, 1269
- Kormendy & Kennicutt (2004) Kormendy, J., & Kennicutt, R. C., Jr. 2004, ARA&A, 42, 603
- Kormendy et al. (2009) Kormendy, J., Fisher, D. B., Cornell, M. E., & Bender, R. 2009, ApJS, 182, 216
- Kuntschner (2000) Kuntschner, H. 2000, MNRAS, 315, 184
- Laine et al. (2002) Laine, S., Shlosman, I., Knapen, J. H., & Peletier, R. F. 2002, ApJ, 567, 97
- Laurikainen et al. (2002) Laurikainen, E., Salo, H., & Rautiainen, P. 2002, MNRAS, 331, 880
- Lisker et al. (2006) Lisker, T., Debattista, V. P., Ferreras, I., & Erwin, P. 2006, MNRAS, 370, 477
- Maciejewski & Sparke (1997) Maciejewski, W., & Sparke, L. S. 1997, ApJ, 484, L117
- Maciejewski & Sparke (2000) Maciejewski, W., & Sparke, L. S. 2000, MNRAS, 313, 745
- Marinova & Jogee (2007) Marinova, I., & Jogee, S. 2007, ApJ, 659, 1176
- Márquez et al. (2003) Márquez, I., Masegosa, J., Durret, F., González Delgado, R. M., Moles, M., Maza, J., Pérez, E., & Roth, M. 2003, A&A, 409, 459
- Menéndez-Delmestre et al. (2007) Menéndez-Delmestre, K., Sheth, K., Schinnerer, E., Jarrett, T. H., & Scoville, N. Z. 2007, ApJ, 657, 790
- Moiseev (2001) Moiseev, A. V. 2001, Bull. Special Astrophys. Obs., 51, 140
- Moiseev, Valdés, & Chavushyan (2004) Moiseev, A. V., Valdés, J. R., & Chavushyan, V. H. 2004, A&A, 421, 433
- Morelli et al. (2010) Morelli, L., Cesetti, M., Corsini, E. M., et al. 2010, A&A, 518, A32
- Osterbrock et al. (1996) Osterbrock, D. E., Fulbright, J. P., Martel, A. R., Keane, M. J., Trager, S. C., & Basri, G. 1996, PASP, 108, 277
- Pérez et al. (2007) Pérez, I., Sánchez-Blázquez, P., & Zurita, A. 2007, A&A, 465, L9
- Pérez et al. (2009) Pérez, I., Sánchez-Blázquez, P., & Zurita, A. 2009, A&A, 495, 775
- Pérez & Sánchez-Blázquez (2011) Pérez, I., & Sánchez-Blázquez, P. 2011, A&A, 529, A64
- Rautiainen et al. (2002) Rautiainen, P., Salo, H., & Laurikainen, E. 2002, MNRAS, 337, 1233
- Sánchez-Blázquez et al. (2006) Sánchez-Blázquez, P., et al. 2006, MNRAS, 371, 703
- Sánchez-Blázquez et al. (2011) Sánchez-Blázquez, P., Ocvirk, P., Gibson, B. K., Pérez, I., & Peletier, R. F. 2011, MNRAS, 415, 709
- Sarzi et al. (2006) Sarzi, M., et al. 2006, MNRAS, 366, 1151
- Sandage & Tammann (1981) Sandage, A., & Tammann, G. A. 1981, The Revised Shapley-Ames Catalog of Bright Galaxies, Carnegie Institution, Washington
- Sersic (1968) Sérsic, J. L., Atlas de galaxias australes, Observatorio Astronomico, Cordoba
- Sheth et al. (2008) Sheth, K., et al. 2008, ApJ, 675, 1141
- Shlosman et al. (1989) Shlosman, I., Frank, J., & Begelman, M. C. 1989, Nature, 338, 45
- Shlosman et al. (1990) Shlosman, I., Begelman, M. C., & Frank, J. 1990, Nature, 345, 679
- Shlosman & Heller (2002) Shlosman, I., & Heller, C. H. 2002, ApJ, 565, 921
- Tonry & Davis (1979) Tonry, J., & Davis, M. 1979, AJ, 84, 1511
- Trager et al. (1998) Trager, S. C., Worthey, G., Faber, S. M., Burstein, D., & Gonzalez, J. J. 1998, ApJS, 116, 1
- Trager et al. (2000) Trager, S. C., Faber, S. M., Worthey, G., & González, J. J. 2000, AJ, 120, 165
- van den Bergh (2002) van den Bergh, S. 2002, AJ, 124, 782
- van der Marel & Franx (1993) van der Marel, R. P., & Franx, M. 1993, ApJ, 407, 525
- Vazdekis et al. (1997) Vazdekis, A., Peletier, R. F., Beckman, J. E., & Casuso, E. 1997, ApJS, 111, 203
- Vazdekis (1999) Vazdekis, A. 1999, ApJ, 513, 224
- Vazdekis & Arimoto (1999) Vazdekis, A., & Arimoto, N. 1999, ApJ, 525, 144
- Vazdekis et al. (2001) Vazdekis, A., Kuntschner, H., Davies, R. L., Arimoto, N., Nakamura, O., & Peletier, R. 2001, ApJ, 551, L127
- Vazdekis et al. (2004) Vazdekis, A., Trujillo, I., & Yamada, Y. 2004, ApJ, 601, L33
- Vazdekis et al. (2010) Vazdekis, A., Sánchez-Blázquez, P., Falcón-Barroso, J., Cenarro, A. J., Beasley, M. A., Cardiel, N., Gorgas, J., & Peletier, R. F. 2010, MNRAS, 404, 1639
- Wegner et al. (2003) Wegner, G., et al. 2003, AJ, 126, 2268
- Wozniak et al. (1995) Wozniak, H., Friedli, D., Martinet, L., Martin, P., & Bratschi, P. 1995, A&AS, 111, 115
- Wozniak et al. (2003) Wozniak, H., Combes, F., Emsellem, E., & Friedli, D. 2003, A&A, 409, 469
- Wozniak & Champavert (2006) Wozniak, H., & Champavert, N. 2006, MNRAS, 369, 853
- Yamada et al. (2006) Yamada, Y., Arimoto, N., Vazdekis, A., & Peletier, R. F. 2006, ApJ, 637, 200
- York et al. (2000) York, D. G., et al. 2000, AJ, 120, 1579
Appendix A The newly defined Fe4383SR index
For the inner and outer bars of NGC 357 we only have blue spectra, from 3990 to 4440 Å. There is only one Iron index in the Lick system within this range, at 4383 Å. Unfortunately, the red pseudo-continuum of this Lick Fe4383 index falls partially out of our blue spectra, so we have redefined it in order to introduce a new Fe4383SR index suitable for our spectral range requirements. Fe4383SR is named after Short Red (due to its motivation) and keeps the blue pseudo-continuum of the Lick Fe4383 index, but modifies the range definitions for the main bandpass and the red pseudo-continuum (see Table 2). This new index has been tested with the bulge of NGC 357, for which we have data in two spectral ranges so we can measure additional Iron indices. Figure 9 shows several age indicators plotted against Fe4383SR and Fe. The corresponding measurements for the bulge of NGC 357 are overplotted. The age and metallicity obtained from the two Iron index definitions are consistent. We therefore use Fe4383SR for estimating the metallicity in our blue spectra.
Appendix B S/N constraints for the cross-correlation method
As explained in Section 4.3.3, we explored the requirements of the cross-correlation method through several tests with the Vazdekis et al. (2010) model library, by changing their spectral resolution, spectral range and S/N ratio. We found that the S/N of the outer bar spectrum is not sufficient to disentangle its age and metallicity. This fact is illustrated in Figure 10, where we show the results from aplying the cross-correlation method to a model of 8 Gyr and solar metallicity, once cut and smoothed to mimic the observed spectrum for the outer bar. We also added gaussian noise to the model to match the S/N ratio of the data. The error regions are so large that, for ages above 3 Gyr the results for the solar and supersolar metallicity are completely mixed.