Multi-Wavelength Properties of Barred Galaxies in the Local Universe: Environment and evolution across the Hubble sequence
Abstract
We investigate possible environmental and morphological trends in the bar fraction using two carefully selected samples representative of a low-density environment (the isolated galaxies from the AMIGA sample) and of a dense environment (galaxies in the Virgo cluster). Galaxies span a stellar mass range from to M⊙ and are visually classified using both high-resolution NIR (H-band) imaging and optical rgb images. We find that the bar fraction in disk galaxies is independent of environment suggesting that bar formation may occur prior to the formation of galaxy clusters. The bar fraction in early type spirals () is 50%, which is twice as high as the late type spirals (). The higher bar fraction in early type spirals may be due to the fact that a significant fraction of their bulges are pseudo-bulges which form via the buckling instability of a bar. i.e. a large part of the Hubble sequence is due to secular processes which move disc galaxies from late to early types. There is a hint of a higher bar fraction with higher stellar masses which may be due to the susceptibility to bar instabilities as the baryon fractions increase in halos of larger masses. Overall, the population has a lower bar fraction than the galaxies and their barred fraction drops significantly with decreasing stellar mass. This supports the notion that form via the transformation of disk galaxies that enter the cluster environment. The gravitational harassment thickens the stellar disks, wiping out spiral patterns and eventually erasing the bar - a process that is more effective at lower galaxy masses.
Subject headings:
galaxies:barred galaxies1. Introduction
Understanding bar-formation and the secular effects that bars have on the stellar component is becoming central to our understanding of galaxy formation and evolution. Once a bar forms it can change the scale length of the stellar component via scattering/mixing of stars in the radial direction and they can create an extended stellar distribution (Roškar et al., 2008). Bars can move a galaxy between morphological classes through the secular formation of pseudo-bulges (Athanassoula, 2002; Debattista et al., 2004) and they can drive gas to the central black hole fuelling AGN (Shlosman et al. 1989).
Numerical simulations have shown that bars naturally arise from the secular evolution of discs (Toomre, 1964; Ostriker & Peebles, 1973; Fall & Efstathiou, 1980). Bars can also be triggered by dynamical interactions in the field (Gerin et al., 1990; Barnes & Hernquist, 1992; Romano-Díaz et al., 2008; Dubinski et al., 2009). It has been shown that close galaxy companions are associated with bar formation, but primarily for early Hubble-types (Elmegreen et al., 1990). In galaxy clusters, gravitational encounters (harassment) can drive a morphological transformation from late type disks to dwarf ellipticals (dSphs). In this scenario, encounters create a “naked” stellar bar which is subsequently heated, causing the remnants to become more spherical with time (Moore et al., 1996).
Is environment the key factor in determining why two similar galaxies may or may not have a bar or is the existence of a bar related to the initial conditions of galaxy formation? The stability (or instability) of disks to bar formation may also depend on the baryon fraction, and in particular the mass of stars and gas in the disk. This varies across the Hubble sequence and depends strongly on halo mass (van den Bosch et al., 2000; Courteau et al., 2003; McGaugh, 2005). This all suggests that in addition to local density, morphology and halo mass are also important principal parameters to investigate. Another key observational result is the fact that the bar fraction is not changing significantly with redshift (see Elmegreen et al. 2004; Marinova & Jogee 2007, but also Sheth et al. 2008 for a different result), however, most disk galaxies are not within dense environments so it would be difficult to disentangle the effects of environment, especially at higher redshifts.
Several studies have shown that there is no evidence for a dependence of bar frequency on galaxy environment (van den Bergh, 2002), the same is true even if galaxies of different morphological type are considered independently (Aguerri et al., 2009). Li et al. (2009) came to the same conclusion analyzing the clustering properties of barred and unbarred galaxies of similar stellar mass and finding it indistinguishable over all the scales probed (from 20 kpc to 30 Mpc). More recently, the Coma cluster was studied by Méndez-Abreu et al. (2010): they find that the bar fraction does not vary significantly even when going from the center to the cluster outskirts. However, the Coma cluster is such an extreme environment that most of its apparent spiral galaxy population may be field galaxies in projection.
In the light of these observational results and motivation from numerical simulation studies, we aim at measuring the bar fraction (as number of barred discs over the total number of discs) as a function of environment and disc morphology, at in two carefully selected samples representative of a low-density environment (the isolated galaxies from the AMIGA sample) and of a moderately dense environment (galaxies in the Virgo cluster).
To achieve this goal it is important to use homogeneous classifications since, as we have shown in Giordano et al., (2010) (paperI hereafter), the bar fraction is very stable against sample selection but that some (possibly spurious) differences can arise if the comparison is based on samples classified using different methods (for example visual classification versus automated profile fitting). In particular, the way the disc population is identified and isolated plays a crucial role, since, if no detailed morphological information is available, discs can easily be miscounted (for example applying only color and/or magnitude cuts).
In order to address this, we use data from the UKIDSS Large Area Survey (Lawrence et al., 2007) and from SDSS DR7 (Abazajian et al., 2009), with the great advantage of combining optical rgb images with near-infrared (H-band) imaging with excellent resolution for local universe studies, that allow us to visually inspect the images to provide detailed morphological classifications.
2. Data
2.1. Virgo sample
In PaperI we presented a thorough study of the barred galaxies in the Virgo Cluster from which we adopt all the classified galaxies with a measured H-band magnitude from 2MASS. The Virgo disk sample is composed of moderately inclined (axis ratio larger than 0.4) members with UKIDSS near-IR imaging of Hubble type between S0 and Sm, spanning a H-band magnitude (stellar mass) range of -17 to -25 mag ( to M⊙). In the following analysis, we use the H-band magnitudes from Paper I to compute stellar masses assuming a flat color with a . The local galaxy density for members is determined via the proxy (Baldry et al., 2006), using the positions and magnitudes from the Virgo Cluster Catalog (Binggeli et al., 1984).
2.2. Field sample
To provide a robust comparison to the Virgo sample, we select a true Field sample using the AMIGA (Analysis of the interstellar Medium of Isolated GAlaxies) project (Verdes-Montenegro et al., 2005). The AMIGA catalogue is based on the KIG catalog Karachentseva (1973) of isolated galaxies (). The KIG catalog is composed of 1050 galaxies with apparent blue magnitudes brighter than 15.7 mag; these isolated galaxies are selected to have no neighbor of comparable size within twenty galactic diameters. The KIG catalog has been used by multiple studies to investigate the effects of under-dense environment on galaxy properties (Adams et al., 1980; Haynes & Giovanelli, 1980) and the AMIGA project quantified the isolation of KIG galaxies identifying their sample of 791 genuinely isolated galaxies Verley et al. (2007a). The AMIGA project has also compiled multiwavelength coverage of this statistically significant sample of the most isolated galaxies in the local universe and the dataset includes optical photometry and morphologies for a redshift-complete subsample of 956 galaxies (Sulentic et al., 2006), and these data are publicly released under a VO interface at http://amiga.iaa.es/.
By cross-matching the AMIGA catalogue with the 2MASS and SDSS databases, we identify 563 galaxies with both H-band and rgb images. As in our Virgo sample, we select only moderately inclined (axis ratio ) disk galaxies with Hubble type of to . The stellar masses of the resulting 390 Field disk galaxies are determined using the total H-band magnitudes from 2MASS and assuming the same flat color and as in the Virgo sample. The local density for each galaxy is determined by their 5th nearest neighbors (, see Baldry et al. 2006) as defined by the AMIGA catalogue of neighbors, constructed down to a magnitude 17.5, lying within 0.5 Mpc around the KIG galaxies (Verley et al., 2007b).
2.3. Identifying Barred Disks
The UKIDSS Large Area Survey is an ongoing survey to image 4000 deg2 at high Galactic latitudes in the YJHK filters to a depth in H of 18.8 mag; it has a spatial resolution of 0.4′′/pixel (like SDSS data) and an average seeing of 0.8′′. Our galaxies span a redshift out to 0.03 where the UKIDSS imaging has a physical resolution of 400 pc/pixel. As outlined in PaperI, we use the H-band imaging to visually classify the disk galaxies into one of three categories: “barred”, “non-barred”, or “uncertain”. All the galaxies in the Virgo sample have H-band imaging from UKIDSS that is also available for 172 galaxies in the Field sample, for the rest we must rely on SDSS and rgb imaging; however, for all the galaxies with both H-band and imaging, we find that our bar classifications are essentially identical.
Both Virgo and Field catalogues, comprehensive of rgb and H-band thumbnails are available online111http://www.itp.uzh.ch/ giordano/mwpbg-v2.html.
3. Results and Discussion
3.1. Barred Fraction vs. Environment
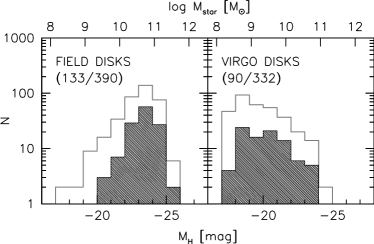
In Figure 1 we show the H-band luminosity distribution for moderately inclined disk galaxies in our Field and Virgo samples. The barred fraction averaged over the disk population in the Field is 34% (133/390) and in Virgo is 28% (90/332). We find that even with bar classifications based on high resolution near-IR imaging, the barred fraction does not vary with environment when considering the disk population as a whole. Although our results are consistent with earlier work based on optical imaging (see for example van den Bergh 2002; Li et al. 2009), the constancy of the barred fraction conflicts with expectations from current galaxy formation models, since strong interactions can trigger bar instabilities (Berentzen et al., 2004).
To further test the robustness of our result, we incorporate the Nair & Abraham (2010) optically-selected sample of about 14,000 galaxies from the SDSS DR4; this sample includes nearly all spectroscopically-targeted galaxies in the redshift range to an apparent extinction-corrected limit of mag. In addition to visually classified Hubble types, the NA10 catalogue contains the existence of bars, stellar masses computed according to Kauffmann et al. (2003), and an estimate of the local density computed using the 5th nearest neighbors () according to Baldry et al. (2006). To ensure that we can compare the (optical) NA10 sample directly to our (near-IR) results, we apply the same disk selection criteria as in our Field and Virgo samples and consider only galaxies at .
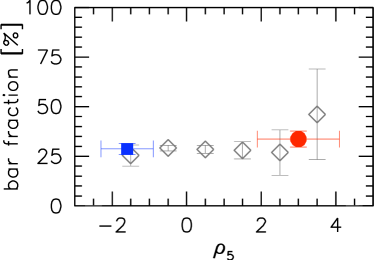
Figure 2 shows the barred fraction in our Field (blue) and Virgo (red) populations as well as the NA10 sample (grey) as a function of local galaxy density (); note how effectively our Field and Virgo samples bracket the extremes in . We find the barred disk fraction is surprisingly resilient (%): the barred fraction does not vary as the environment changes from isolated field galaxies to cluster cores.
3.2. Barred Fraction vs. Disk Morphology
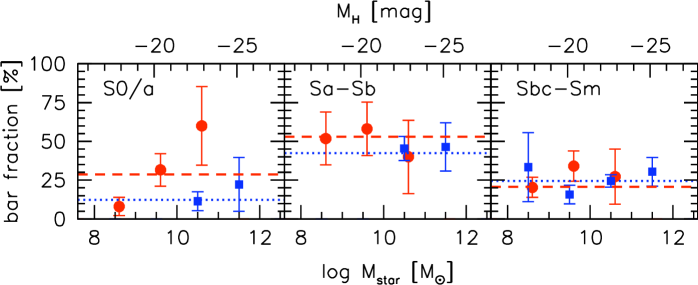
To investigate how the barred fraction varies with disk morphology, we divide both our Field and Virgo samples into three classes: 1) lenticulars (featureless discs, corresponding to Hubble-types ); 2) early-type spirals (bulge-dominated discs, corresponding to Hubble-types ); and 3) late-type spirals (disc-dominated or bulge-less discs, corresponding to Hubble-types ). In Figure 3 we show the barred fraction as a function of stellar mass for the three disk classes where the blue squares represent the Field and the red circles the Virgo members. Each panel also includes the average barred fraction for the three disk classes in the Field (dotted line) and in Virgo (dashed line). The differences in the relative number of galaxies in each disk class is due to the morphology-density relation, i.e. the fraction of lenticulars in the Field (%) is lower than in Virgo (%; PaperI).
We find that the barred fraction for early-type spirals is systematically higher than in late-type spirals regardless of environment: % for vs. % for . The barred fraction in lenticulars () is also lower in both environments.
4. Summary
We present the first comprehensive study of barred disks as a function of environment that uses NIR and rgb imaging to resolve bars; the advantage of using near-infrared imaging from UKIDSS is that bar classifications are less affected by dust and bright star-forming regions. We expand on our study of bars in Virgo by building a Field sample using the KIG catalog of isolated galaxies. Our Field and Virgo disk populations are at , span a range in stellar mass from 108 to 1012 M⊙ and Hubble type (), encompass a wide range in local densities and are analyzed in exactly the same manner.
We find that the barred disk fraction is surprisingly constant at % in both the Field and Virgo samples, i.e. the barred fraction for the disk population as a whole does not depend on environment. We test the robustness of our result by analyzing the NA10 optically-selected sample of nearby galaxies in the same manner, and we again find a constant barred fraction across the full range of local galaxy density.
This implies that disks become barred prior to the late time assembly of galaxy clusters, which is consistent with observational evidence that the bar fraction does not evolve strongly with redshift.
The barred fraction is highest for early-type spirals () regardless of environment: these galaxies are nearly twice as likely to be barred as late-type spirals (). If a late type spiral forms a bar, then it may also form a pseudo-bulge via a buckling instability and its morphological class will change. Indeed, the consensus is forming that our own Galaxy has evolved across the Hubble sequence in this fashion (Agertz et al., 2010). If this is a common phenomenon, as numerical simulations indicate (Debattista et al., 2006), then we naturally expect the bar fraction to be higher in early type spirals, that have a higher baryon fraction. This implies that a significant fraction of the bulges of early type galaxies are pseudo-bulges.
The morphology-density relation (Dressler, 1980) can be explained by the notion that the cluster environment is creating S0’s from the infalling disc population. Indeed, Graham & Worley (2008) find that the bulge to disc ratios of S0’s is similar to that of early type galaxies. One might therefore expect the bar fraction to be the same in S0s and early type spirals, however averaged over the entire population it is significantly lower (25% versus 50% respectively). We note that the bar fraction in S0’s and early type discs with stellar masses above is similar ( 50%), but this drops to less than 10% in the least massive S0’s. This supports a harassment scenario for the formation of the S0 population. Gravitational encounters between galaxies and with the global cluster potential thicken the disks of massive early type spirals by an amount that is sufficient to suppress spiral patterns (Moore et al 1999). For lower mass disks, the heating is more effective and will eventually erase the signatures of a preexisting bar. Numerical simulations also indicate that infalling late type disks will undergo an environmentally driven bar instability, however this phase is short lived with the bar experiencing subsequent heating until it becomes a dE/dSph.
References
- Abazajian et al. (2009) Abazajian, K. N., Adelman-McCarthy, J. K., Agüeros, M. A., Allam, S. S., Allende Prieto, C., An, D., Anderson, K. S. J., Anderson, S. F., Annis, J., Bahcall, N. A., & et al. 2009, ApJS, 182, 543
- Adams et al. (1980) Adams, M. T., Jensen, E. B., & Stocke, J. T. 1980, AJ, 85, 1010
- Agertz et al. (2010) Agertz, O., Teyssier, R., & Moore, B. 2010, MNRAS, 1527
- Aguerri et al. (2009) Aguerri, J. A. L., Méndez-Abreu, J., & Corsini, E. M. 2009, A&A, 495, 491
- Athanassoula (2002) Athanassoula, E. 2002, Ap&SS, 281, 39
- Baldry et al. (2006) Baldry, I. K., Balogh, M. L., Bower, R. G., Glazebrook, K., Nichol, R. C., Bamford, S. P., & Budavari, T. 2006, MNRAS, 373, 469
- Barnes & Hernquist (1992) Barnes, J. E., & Hernquist, L. 1992, ARA&A, 30, 705
- Berentzen et al. (2004) Berentzen, I., Athanassoula, E., Heller, C. H., & Fricke, K. J. 2004, MNRAS, 347, 220
- Binggeli et al. (1984) Binggeli, B., Sandage, A., & Tarenghi, M. 1984, AJ, 89, 64
- Courteau et al. (2003) Courteau, S., Andersen, D. R., Bershady, M. A., MacArthur, L. A., & Rix, H.-W. 2003, ApJ, 594, 208
- Debattista et al. (2004) Debattista, V. P., Carollo, C. M., Mayer, L., & Moore, B. 2004, ApJ, 604, L93
- Debattista et al. (2006) Debattista, V. P., Mayer, L., Carollo, C. M., Moore, B., Wadsley, J., & Quinn, T. 2006, ApJ, 645, 209
- Dressler (1980) Dressler, A. 1980, ApJ, 236, 351
- Dubinski et al. (2009) Dubinski, J., Berentzen, I., & Shlosman, I. 2009, ApJ, 697, 293
- Elmegreen et al. (2004) Elmegreen, B. G., Elmegreen, D. M., & Hirst, A. C. 2004, ApJ, 612, 191
- Elmegreen et al. (1990) Elmegreen, D. M., Elmegreen, B. G., & Bellin, A. D. 1990, ApJ, 364, 415
- Fall & Efstathiou (1980) Fall, S. M., & Efstathiou, G. 1980, MNRAS, 193, 189
- Gerin et al. (1990) Gerin, M., Combes, F., & Athanassoula, E. 1990, A&A, 230, 37
- Graham & Worley (2008) Graham, A. W., & Worley, C. C. 2008, MNRAS, 388, 1708
- Haynes & Giovanelli (1980) Haynes, M. P., & Giovanelli, R. 1980, ApJ, 240, L87
- Karachentseva (1973) Karachentseva, V. E. 1973, Astrofizicheskie Issledovaniia Izvestiya Spetsial’noj Astrofizicheskoj Observatorii, 8, 3
- Kauffmann et al. (2003) Kauffmann, G., Heckman, T. M., White, S. D. M., Charlot, S., Tremonti, C., Brinchmann, J., Bruzual, G., Peng, E. W., Seibert, M., Bernardi, M., Blanton, M., Brinkmann, J., Castander, F., Csábai, I., Fukugita, M., Ivezic, Z., Munn, J. A., Nichol, R. C., Padmanabhan, N., Thakar, A. R., Weinberg, D. H., & York, D. 2003, MNRAS, 341, 33
- Lawrence et al. (2007) Lawrence, A., Warren, S. J., Almaini, O., Edge, A. C., Hambly, N. C., Jameson, R. F., Lucas, P., Casali, M., Adamson, A., Dye, S., Emerson, J. P., Foucaud, S., Hewett, P., Hirst, P., Hodgkin, S. T., Irwin, M. J., Lodieu, N., McMahon, R. G., Simpson, C., Smail, I., Mortlock, D., & Folger, M. 2007, MNRAS, 379, 1599
- Li et al. (2009) Li, C., Gadotti, D. A., Mao, S., & Kauffmann, G. 2009, MNRAS, 397, 726
- Marinova & Jogee (2007) Marinova, I., & Jogee, S. 2007, ApJ, 659, 1176
- McGaugh (2005) McGaugh, S. S. 2005, ApJ, 632, 859
- Méndez-Abreu et al. (2010) Méndez-Abreu, J., Sánchez-Janssen, R., & Aguerri, J. A. L. 2010, ApJ, 711, L61
- Moore et al. (1996) Moore, B., Katz, N., Lake, G., Dressler, A., & Oemler, A. 1996, Nature, 379, 613
- Nair & Abraham (2010) Nair, P. B., & Abraham, R. G. 2010, ApJS, 186, 427
- Ostriker & Peebles (1973) Ostriker, J. P., & Peebles, P. J. E. 1973, ApJ, 186, 467
- Romano-Díaz et al. (2008) Romano-Díaz, E., Shlosman, I., Heller, C., & Hoffman, Y. 2008, ApJ, 687, L13
- Roškar et al. (2008) Roškar, R., Debattista, V. P., Quinn, T. R., Stinson, G. S., & Wadsley, J. 2008, ApJ, 684, L79
- Sheth et al. (2008) Sheth, K., Elmegreen, D. M., Elmegreen, B. G., Capak, P., Abraham, R. G., Athanassoula, E., Ellis, R. S., Mobasher, B., Salvato, M., Schinnerer, E., Scoville, N. Z., Spalsbury, L., Strubbe, L., Carollo, M., Rich, M., & West, A. A. 2008, ApJ, 675, 1141
- Sulentic et al. (2006) Sulentic, J. W., Verdes-Montenegro, L., Bergond, G., Lisenfeld, U., Durbala, A., Espada, D., Garcia, E., Leon, S., Sabater, J., Verley, S., Casanova, V., & Sota, A. 2006, A&A, 449, 937
- Toomre (1964) Toomre, A. 1964, ApJ, 139, 1217
- van den Bergh (2002) van den Bergh, S. 2002, AJ, 124, 782
- van den Bosch et al. (2000) van den Bosch, F. C., Robertson, B. E., Dalcanton, J. J., & de Blok, W. J. G. 2000, AJ, 119, 1579
- Verdes-Montenegro et al. (2005) Verdes-Montenegro, L., Sulentic, J., Lisenfeld, U., Leon, S., Espada, D., Garcia, E., Sabater, J., & Verley, S. 2005, A&A, 436, 443
- Verley et al. (2007a) Verley, S., Leon, S., Verdes-Montenegro, L., Combes, F., Sabater, J., Sulentic, J., Bergond, G., Espada, D., García, E., Lisenfeld, U., & Odewahn, S. C. 2007a, A&A, 472, 121
- Verley et al. (2007b) Verley, S., Odewahn, S. C., Verdes-Montenegro, L., Leon, S., Combes, F., Sulentic, J., Bergond, G., Espada, D., García, E., Lisenfeld, U., & Sabater, J. 2007b, A&A, 470, 505