Phase transitions and spectral properties of the ionic Hubbard model in one dimension
Abstract
The ionic Hubbard model is investigated at half filling at zero temperature. We apply the cellular dynamical mean-field theory to the one-dimensional ionic Hubbard model to compute local quantities such as double occupancy and staggered charge density. Both quantities provide general transition behavior of the model from a band insulating phase to a Mott insulating phase. The renormalized band gap is introduced as an efficient order parameter for the transition from a band insulator. We also present the spectral properties of the ionic Hubbard model, which exhibit characteristic features for both weak and strong interactions.
pacs:
71.10.Fd, 71.10.Hf, 71.27.+aI Introduction
Strongly correlated electron systems have been one of the most interesting problems in modern condensed matter physics. The interest in strongly correlated systems was motivated by experiments on transition-metal oxides which were inconsistent with the predictions of the conventional band theory. Since the argument by Mott that the mutual interaction between electrons can cause insulating behavior, extensive research has been performed on the effects of the interaction in the metal-insulator transition. Imada et al. (1998) It is practically impossible to include all the degrees of freedom in strongly correlated systems, and the standard approach has been to solve theoretical models constructed with essential ingredients. The Hubbard model (HM) is one of the most popular models in strongly correlated systems. Hubbard (1963) It includes only two essential components: electron hoppings and local Coulomb interactions. Although the model seems extremely simplified, it has successfully described the metal-insulator transition caused by the mutual interaction between electrons.
The ionic Hubbard model (IHM), an extended version of the HM, was proposed to explain the neutral-ionic transition in the quasi-one-dimensional charge-transfer organic materials. Strebel and Soos (1970); Hubbard and Torrance (1981); Nagaosa and Takimoto (1986a, b); Nagaosa (1986) Unlike the original HM, this model is an insulator in the absence of the mutual Coulomb interaction. It enables one to examine an interesting insulator-insulator transition, from a band insulator (BI) under weak interaction to a Mott insulator (MI) under strong interaction. Accordingly the transition nature in the IHM is expected to differ significantly from the usual metal-insulator transition in the HM.
A more interesting feature of this model is the possibility of a nontrivial intermediate state, sandwiched between the two insulating phases. Extensive studies of the intermediate state in the IHM have been carried out in various spatial dimensions. In the infinite dimensions, which can be treated exactly by the dynamical mean-field theory (DMFT), Georges et al. (1996) the metallic phase is observed as an intermediate phase for the weak alternating potential, whereas a direct insulator-insulator transition is shown under a strong staggered potential. Garg et al. (2006); Craco et al. (2008); Byczuk et al. (2009) The same conclusion has been obtained by a recent study using a coherent potential approximation. Hoang (2010) In two dimensions, on the other hand, there has been some controversy as to the nature of the intermediate phase in the IHM. Quantum Monte Carlo calculations Paris et al. (2007); Bouadim et al. (2007) showed that the metallic phase exists, as is observed in the infinite dimensions. In contrast, the cellular dynamical mean-field theory (CDMFT) Kancharla and Dagotto (2007) as well as the variational cluster approachChen et al. (2010) predicts a bond-ordered insulating phase as an intermediate state.
In one dimension, which is our main interest in this paper, the possibility of an insulating intermediate state was suggested by the bosonization method, Fabrizio et al. (1999) which predicts a spontaneously dimerized insulating (SDI) phase between BI and MI phases. Many subsequent interesting works for the one-dimensional (1D) IHM have been reported. Kampf et al. (2004); Manmana et al. (2004); Torio et al. (2001); Wilkens and Martin (2001); Otsuka and Nakamura (2005); Aligia and Batista (2005) Particularly density matrix renormalization group (DMRG) calculations have confirmed the existence of an SDI phase for intermediate interaction strengths. Kampf et al. (2004); Manmana et al. (2004) However, the critical properties of the transition between BI and SDI phases obtained by DMRG calculations turned out not to be consistent with those of two-dimensional (2D) Ising universality class predicted in a bosonization method. For the transition between SDI and MI phases, even the critical interaction strength has not been identified clearly from finite-size scalings.
The main purpose of this paper is to investigate in detail the nature of transitions in the 1D IHM at half filling. In order to achieve this we use the CDMFT, Kotliar et al. (2001) which is one of the cluster extensions Maier et al. (2005) of DMFT. While a single site is chosen to construct the self-consistent equation in the DMFT, the CDMFT picks up a cluster composed of several sites in the spatial dimension of the system. This makes it possible to include short-ranged spatial fluctuations inside the cluster, which are expected to be important in low-dimensional systems. The CDMFT turns out to be a very efficient method even in one dimension, Bolech et al. (2003); Capone et al. (2004); Koch et al. (2008); Go and Jeon (2009) the worst case for a mean-field theory. In particular, it has been shown that the CDMFT of the 1D HM yields excellent agreement with the Bethe ansatz exact solution.Capone et al. (2004); Koch et al. (2008); Go and Jeon (2009) Such a good agreement in turn reinforces our expectation of an accurate description by the CDMFT method of the 1D IHM for which no exact solution is available. We employ the exact diagonalization method as an impurity solver to study the ground state of the 1D IHM. The exact diagonalization method is powerful since it deals with all the quantum fluctuations on an equal footing, although it limits the number of sites inside the cluster as well as that of bath sites. Recent studies on correlated systems show that single-site or cluster DMFT combined with the exact diagonalization gives reliable results for finite temperatures as well. Capone et al. (2007); Liebsch and Tong (2009); Liebsch and Ishida
We calculate local quantities such as staggered charge density and double occupancy, which have been reported to be evaluated accurately in the CDMFT approach. Capone et al. (2004); Koch et al. (2008) We also introduce a renormalized band gap defined by the self-energy corrected band gap and demonstrate that it plays the role of convenient order parameter for the BI phase. Any indication of the transition from an intermediate phase to an MI phase is not observed in the local quantities, such as the abrupt change in slope which was reported in the cellular dynamical mean-field study of the two-dimensional IHM. Kancharla and Dagotto (2007) In order to gain further insight into the transition nature we finally focus on the spectral properties of the model. Computed spectral weights reveal the spin-charge separation in an MI phase, which is characteristic of the 1D system. Such spin-charge separation has been reported by earlier studies through cluster extensions of the DMFT only for the 1D HM. Sénéchal et al. (2000); Go and Jeon (2009) The transition from an intermediate phase to an MI phase exhibits rather a crossoverlike behavior, which may be a reason for the difficulty in obtaining the transition point clearly in earlier numerical investigations.
II Model and Method
The Hamiltonian of the 1D IHM is given by
| (1) |
where () creates (destroys) an electron with spin at the th site and . The hopping of electrons is allowed only between the nearest neighbors. The parameters , , and are the hopping amplitude, the on-site Coulomb repulsion, and the chemical potential, respectively. Throughout the paper we will represent all the energies in units of . The system is composed of two alternating sublattices and . The potential energy difference between nearest neighbors is and every site belonging to the sublattice () has lower (higher) potential energy by than the chemical potential. If vanishes this model is restored to the original HM. We set the chemical potential to be half the Coulomb repulsion in order to maintain the half filling of electrons over the system.
We use the CDMFT to study the 1D IHM. The infinite lattice is reduced to a cluster of size which hybridizes with the self-consistent electronic bath sites within the CDMFT. We employ the exact diagonalization method as an impurity solver. In order to obtain the cluster self-energy, we map the lattice model to the impurity Hamiltonian,
| (2) |
where are the cluster site indices and label the bath sites. The matrix contains the hoppings, the staggered potential, and the chemical potential inside the cluster, which is given explicitly by
| (3) |
[The circumflex over a symbol represents a matrix.] The parameters and , which respectively denote the bath energy levels and hybridization strengths with the clusters, are determined from the imposed self-consistency conditions. From the impurity Hamiltonian we compute the cluster Green function as well as the cluster self-energy, , where is the Weiss field describing the noninteracting bath.
The Green function of momentum in reduced Brillouin zone is given by
| (4) |
where , is the Fourier transform of the hopping matrix, and , are fictitious Matsubara frequencies. Here we used and and omitted the spin index for simplicity. The local lattice Green function is then determined by
| (5) |
The new Weiss field is obtained through the self-consistent equation,
| (6) |
the best fit of which produces new bath parameters . The above procedure is repeated until the convergence is reached. For a more detailed procedure, we refer the reader to earlier works.Go and Jeon (2009, 2010)
It is known that even the cluster of , which is the minimal size describing the system within the CDMFT approach, is sufficient to obtain an accurate estimation of the local quantities in the 1D HM. Capone et al. (2004) Further, we have observed that in the 1D IHM the local quantities obtained by the calculations for various combination of and are not significantly dependent on the choice of and , although larger has some tendency to improve the momentum resolution of spectral weights. The number of sites in the impurity Hamiltonian is practically limited by . We use and for the presentations of most quantities investigated in this paper, and other choices of and will be specified.
III Results and Discussion
III.1 Local quantities
In order to examine how the system evolves with the variation of the local interaction we first calculate two local quantities: staggered charge density and double occupancy. The staggered charge density is defined by the difference between the number densities at two sublattices, , where the sublattice number densities can be calculated as
| (7) |
with the angular brackets being the expectation value over the ground state of the impurity Hamiltonian. We also calculate the double occupancy defined by
| (8) |
which is known to be a convenient measure in the transition from metal to an MI phase.
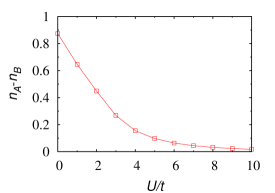
In the ionic limit (), it is energetically favorable that all the electrons are in the sublattice , producing unity of the staggered charge density. As is increased, the energy cost of two electrons to stay in the same site becomes large, reducing the staggered charge. In the strong-coupling limit (), the staggered charge is expected to approach zero.
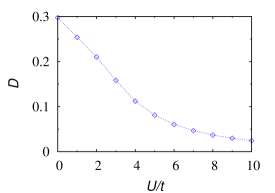
In the case that the system has neither the interaction nor the staggered potential , the double occupancy is since every site has an equal possibility to be occupied independent of spin. The presence of the staggered potential in the system tends to increase the double occupancy. In contrast, the repulsion between electrons makes the doubly occupied sites less favorable and results in the reduction of the double occupancy.
The features of two quantities described in the above reasoning are generally consistent with our numerical results in Fig. 1, which shows (a) the staggered charge density and (b) the double occupancy as a function of . The staggered charge is relatively large in the weak interaction regime and monotonically decreases with increasing ; it reveals that the system exhibits a BI phase for weak interactions and that an MI behavior turns up in the regime of strong interactions. In our numerical work we have also confirmed that the system with large shows larger staggered charge density over the whole region although the increment is reduced for stronger interactions (not shown). The analysis of double occupancy has drawn a similar conclusion. In the noninteracting system () the double occupancy is larger than the free-electron value 1/4 and the system lies in a BI phase. The double occupancy is reduced monotonically by the increase of , approaching zero, as is expected in an MI. Monotonic decrease in both the staggered charge density and the double occupancy demonstrates that the increase of the interaction strength drives the system from a BI into an MI. It is of interest to note that no abrupt change is observed in the variation of both quantities with an increase of the interaction strength.
III.2 Energy densities
In order to gain more insight on the transition between BI and MI, we compute the energy density of the system. The ground-state energy density of the system is calculated as
| (9) |
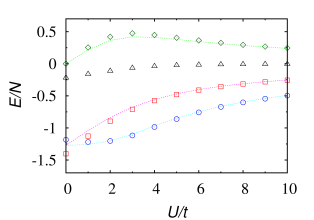
where , , and denote kinetic, potential, and correlation energy densities, respectively. The factor 2 in comes from spin degeneracy. Computed energy densities illustrate which contribution plays a dominant role in each phase. In Fig. 2 we have plotted various contributions to the energy density of the 1D IHM along with those of the 1D HM for comparison. Since the HM does not have staggered potential, the contribution from potential energy is zero and is not plotted in the figure.
In the region of weak interactions (), we can see that both the kinetic and the correlation energy densities are higher than those of the standard HM. The energy gain in the potential contribution compensates for the increase in other energy densities, demonstrating the BI nature of the system in this region. The increase of the interaction strength lessens such a tendency gradually. In the strong-interaction region () all the energy-density contributions are almost the same as those of the HM and the energy contribution from the staggered potential is almost zero, signifying that the system is in an MI phase. As in the local quantities examined in the previous subsections, all the energy densities display continuous variations with the increase of interaction strength.
III.3 Local density of states
The local density of states (LDOS) provides more detailed information on the single-particle properties. Within the CDMFT approach, the LDOS is given by
| (10) |
where is a spectral weight with the energy and the momentum vector in the full Brillouin zone. We restore the translational symmetry broken in the CDMFT formalism by the periodization of the Green function for each sublattice
| (11) |
where is given in Eq. (4). Then we can compute the total spectral weight as
| (12) |
where is the periodized Green function of the sublattice and is a small broadening factor. In this work we used .
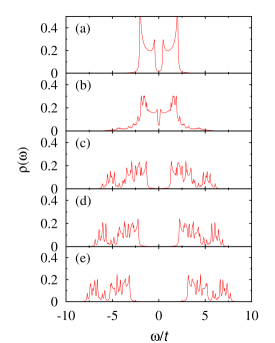
The LDOS is shown in Fig. 3 for several values of . In the noninteracting system , the LDOS can be computed analytically and is composed of two bands which are separated by a band gap due to the staggered potential. The CDMFT results generally reproduce the analytical LDOS for a noninteracting system as demonstrated in Ref. Go and Jeon, 2008. Turning on the interaction does not change the LDOS very much from the noninteracting LDOS, and the two band structure is retained. For weak interactions the increase of interaction strength reduces monotonically the band gap around a Fermi level. Around a certain value the LDOS displays a minimum spectral gap and prominent long tails show up at the outer edges of the bands. Further increase of above in turn enlarges the gap between the two bands. Each band is apparently split into two subbands and the LDOS is composed of four bands for strong interactions. Such a four-band structure is also observed in the original HM, where it is caused by spectral weights concentrated on the spinon-holon continuum. Go and Jeon (2009) In the IHM the gap between the subbands is distinguished more clearly than in the HM and it is found to be proportional to . We will give more detailed discussions on this topic in the section that deals with the spectral weights.
III.4 Spectral gap and renormalized band gap
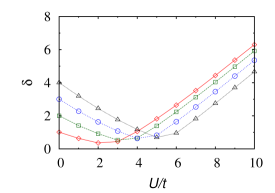
For a quantitative analysis of the gap around a Fermi level, we investigate the spectral gap , which is defined as the energy difference between the highest filled and the lowest empty levels in the LDOS. Since the IHM always displays a minimum gap at the spectral gap can be conveniently obtained from the spectral weight at the Fermi point within the CDMFT. Since the system has a particle-hole symmetry, we estimate the spectral gap to be twice the difference between the Fermi level and the peak of closest to it for positive . The measured gap is plotted as a function of the interaction strength for various in Fig. 4. The overall behaviors of the spectral gap are consistent with those observed in the LDOS. The spectral gap is equal to in the noninteracting system (). It is reduced from the noninteracting value by weak interactions, reaches a minimum at , and increases with in the regime of strong interactions above . Our CDMFT results of the system with various in Fig. 4 have shown that increases with the bare band gap .
In a BI quasiparticle excitations are well defined and we can interpret the spectral gap as the energy difference between the lowest quasielectron and quasihole excitations. By expanding the self-energy for each sublattice around the Fermi level we can estimate the position of the poles of the Green function on the real frequency axis near the Fermi level. We then define the renormalized band gap by the difference between the poles of the Green’s function of the sublattice and which are the closest to the Fermi level, which is expected to be the same as the spectral gap in a BI phase. By definition equals a bare band gap in the noninteracting system since the self-energy vanishes and the poles of the Green function are identical to the bare dispersion of the system. Indeed is a band gap with a self-energy correction. On the other hand, in correlated phases such as an MI, the quasiparticle excitations are not well defined and the discrepancy between and will show up. We can thus expect that the comparison of the renormalized band gap with the spectral gap will be a good parameter for determining whether the system is in a BI phase or not.
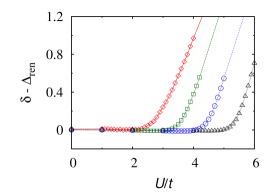
Within the CDMFT we have computed and plotted the difference between the spectral gap and in Fig. 5. We can see that it is zero for , which is guaranteed from the definition of the renormalized band gap. It is remarkable that the difference remains zero over a finite region of below a certain critical value . Above the discrepancy between and turns out to grow rapidly, signifying that an MI phase or another correlated phase emerges for . For , the CDMFT yields ; this is comparable to, although slightly smaller than, the critical values obtained in the existing works, from the DMRG study Manmana et al. (2004) and from the effective model in the strong-coupling limit. Tincani et al. (2009) We compare and for various in Table 1. It is found that two interaction strengths correlate very much with each other and is always slightly higher than , which is also consistent with existing works. Manmana et al. (2004); Kampf et al. (2004)
III.5 Spectral weights
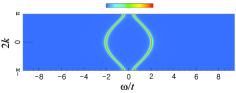
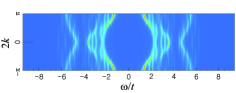
A useful quantity for demonstrating momentum-resolved information on the correlation effects in the system is a total spectral weight given in Eq. (12). This is computed from periodized sublattice Green functions in Eq. (11) and we plot for various interaction strength in Fig. 6.
For weak interaction below two quasiparticle bands are sharply defined in as illustrated in Fig. 6(a) for . Such quasiparticle bands which are separated by a band gap result in two-band structure of the LDOS which is similar to that of a noninteracting system. In this regime only the gap between the two bands and the band widths are renormalized by weak interactions.
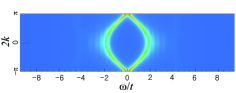
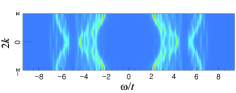
In Fig. 6(b) we can observe that around the single-particle dispersion begins to be broadened particularly around the zone center , which is a signature of the transition to a correlated phase from a BI phase. The broadening around the zone center is a source for the appearance of long tails at the outer edges of the bands in the LDOS. Here it is of interest to note that the broadening shape of the dispersion closely resembles the spin-charge separation observed in the 1D HM. The spinon (holon) is a fractionalized excitation which carries only spin (charge) but no charge (spin). In the 1D HM, the Bethe ansatz solution gives the dispersion of the exotic excitations. The assembled dispersions construct the spectral weight and we can observe some prominent dispersions such as the spinon and the holon branches. In the 1D HM most weights of are concentrated on the spinon branch under relatively weak interaction and more weights transfer to the holon branches and other accessible regions of higher energies as the interaction strength is increased. Go and Jeon (2009) Similar weight transfer is observed in the spectral weights of 1D IHM as shown in Fig. 6.
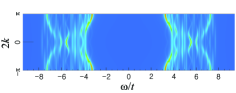
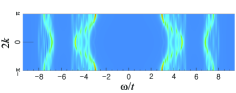

Although the spectral weights of the two models are quite similar to each other in the strong interaction regime, a remarkably different feature also arises from the presence of staggered potential. In the absence of the staggered potential two holon branches for and for cross each other at the zone center slightly above , and extends as secondary holon branches in the other region, as is reproduced in Fig. 7(a). Go and Jeon (2009) The spectral weights for and , which are shown in Figs. 7(b) and 7(c), demonstrate marked gaps at the crossing points of the holon branches. The fact that the gap width is proportional to also supports that the degeneracy of the holon branches at is lifted by the staggered potential. Accordingly, the dispersion displays four well-separated bands, yielding the characteristic four-band structure observed in the LDOS for large in Fig. 3. We also note that the shift of the spinon and the first holon bands toward the Fermi level produces some reduction in the Mott gap in the presence of a staggered potential.
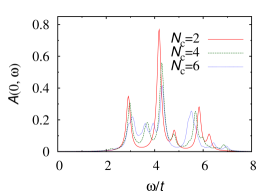
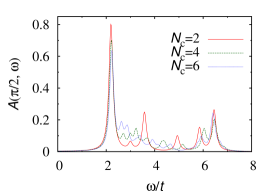
The comparison of the spectral weights with different gives us a good guide to the understanding of the overall distribution of spectral weights. In Fig. 8 we plot the spectral weights on the two momentum points and with different cluster sizes and . In the plot of spectral weights at the zone center in Fig. 8(a) we can recognize three prominent peaks around , , and , which are identified as the spinon and the two split holon branches, respectively. A similar tendency is demonstrated clearly in the plot of in Fig. 8(b). The first peak around corresponds to a merging band of the spinon and the lower holon band, while the higher holon band generates the second peak around . The peaks which seem to be prominent for tend to be smeared out to a continuum with the increase of .
Since the pioneering bosonization approach Fabrizio et al. (1999) it has been generally believed that the 1D IHM shows two successive transitions with an increase of the interaction strength. In the CDMFT we have identified the first transition from the BI by examining the renormalized band gap. However, we are not able to position the second transition point from the intermediate insulating phase to the MI in the investigation of the systems with various values of . We have not observed any nonanalytic behaviors in local quantities such as the staggered charges or the double occupancy, in contrast to the 2D IHM where some kinks in the local quantities were proposed as a signature of the second phase transition. Kancharla and Dagotto (2007) No abrupt change in the spectral properties occurs as the interaction strength is increased. Particularly the spectral weights exhibit a rather gradual transition to the MI. Although the origin of such difficulty in positioning the second phase transition is not clear, we believe that it is related to rather slow falloff of the bond-order parameter around the second transition in the DMRG study. Manmana et al. (2004)
IV Summary
We have investigated the one-dimensional half-filled ionic Hubbard model at zero temperature using the cellular dynamical mean-field theory. We have computed the staggered charge density and the double occupancy. Both quantities display monotonic decrease with an increase of the interaction strength, signifying that the system evolves from a band insulator to a Mott insulator. The energy-density analysis shows that the potential energy gain occurs for weak interactions while the system with strong interactions gives almost the same energy contributions as in the Hubbard model. The phase boundary of a band insulating phase has been determined by the comparison of the renormalized band gap with the spectral gap. Around the phase boundary we have also observed a minimum of the spectral gap for various strengths of staggered potential. We have calculated the spectral weights and analyzed the detailed structure of spin-charge separation by analogy with the one-dimensional Hubbard model. The staggered potential turns out to produce a gap at the crossing point of two holon branches, which is proportional to a band gap parameter.
ACKNOWLEDGMENTS
This research was supported by Basic Science Research Program through the National Research Foundation of Korea (Grant No. 2010-0010937) funded by the Ministry of Education, Science and Technology.
References
- Imada et al. (1998) M. Imada, A. Fujimori, and Y. Tokura, Rev. Mod. Phys. 70, 1039 (1998).
- Hubbard (1963) J. Hubbard, Proc. R. Soc. London, Ser. A 276, 238 (1963).
- Strebel and Soos (1970) P. J. Strebel and Z. G. Soos, J. Chem. Phys. 53, 4077 (1970).
- Hubbard and Torrance (1981) J. Hubbard and J. B. Torrance, Phys. Rev. Lett. 47, 1750 (1981).
- Nagaosa and Takimoto (1986a) N. Nagaosa and J. Takimoto, J. Phys. Soc. Japan 55, 2735 (1986a).
- Nagaosa and Takimoto (1986b) N. Nagaosa and J. Takimoto, J. Phys. Soc. Japan 55, 2745 (1986b).
- Nagaosa (1986) N. Nagaosa, J. Phys. Soc. Japan 55, 2754 (1986).
- Georges et al. (1996) A. Georges, G. Kotliar, W. Krauth, and M. J. Rozenberg, Rev. Mod. Phys. 68, 13 (1996).
- Garg et al. (2006) A. Garg, H. R. Krishnamurthy, and M. Randeria, Phys. Rev. Lett. 97, 046403 (2006).
- Craco et al. (2008) L. Craco, P. Lombardo, R. Hayn, G. I. Japaridze, and E. Müller-Hartmann, Phys. Rev. B 78, 075121 (2008).
- Byczuk et al. (2009) K. Byczuk, M. Sekania, W. Hofstetter, and A. P. Kampf, Phys. Rev. B 79, 121103 (2009).
- Hoang (2010) A. T. Hoang, J. Phys.: Condens. Matter 22, 095602 (2010).
- Paris et al. (2007) N. Paris, K. Bouadim, F. Hebert, G. G. Batrouni, and R. T. Scalettar, Phys. Rev. Lett. 98, 046403 (2007).
- Bouadim et al. (2007) K. Bouadim, N. Paris, F. Hébert, G. G. Batrouni, and R. T. Scalettar, Phys. Rev. B 76, 085112 (2007).
- Kancharla and Dagotto (2007) S. S. Kancharla and E. Dagotto, Phys. Rev. Lett. 98, 016402 (2007).
- Chen et al. (2010) H.-M. Chen, H. Zhao, H.-Q. Lin, and C.-Q. Wu, New J. Phys. 12, 093021 (2010).
- Fabrizio et al. (1999) M. Fabrizio, A. O. Gogolin, and A. A. Nersesyan, Phys. Rev. Lett. 83, 2014 (1999).
- Kampf et al. (2004) A. P. Kampf, M. Sekania, G. I. Japaridze, and P. Brune, J. Phys.: Condens. Matter 15, 5895 (2004).
- Manmana et al. (2004) S. R. Manmana, V. Meden, R. M. Noack, and K. Schönhammer, Phys. Rev. B 70, 155115 (2004).
- Torio et al. (2001) M. E. Torio, A. A. Aligia, and H. A. Ceccatto, Phys. Rev. B 64, 121105 (2001).
- Wilkens and Martin (2001) T. Wilkens and R. M. Martin, Phys. Rev. B 63, 235108 (2001).
- Otsuka and Nakamura (2005) H. Otsuka and M. Nakamura, Phys. Rev. B 71, 155105 (2005).
- Aligia and Batista (2005) A. A. Aligia and C. D. Batista, Phys. Rev. B 71, 125110 (2005).
- Kotliar et al. (2001) G. Kotliar, S. Y. Savrasov, G. Pálsson, and G. Biroli, Phys. Rev. Lett. 87, 186401 (2001).
- Maier et al. (2005) T. Maier, M. Jarrell, T. Pruschke, and M. H. Hettler, Rev. Mod. Phys. 77, 1027 (2005).
- Bolech et al. (2003) C. J. Bolech, S. S. Kancharla, and G. Kotliar, Phys. Rev. B 67, 075110 (2003).
- Capone et al. (2004) M. Capone, M. Civelli, S. S. Kancharla, C. Castellani, and G. Kotliar, Phys. Rev. B 69, 195105 (2004).
- Koch et al. (2008) E. Koch, G. Sangiovanni, and O. Gunnarsson, Phys. Rev. B 78, 115102 (2008).
- Go and Jeon (2009) A. Go and G. S. Jeon, J. Phys.: Condens. Matter 21, 485602 (2009).
- Capone et al. (2007) M. Capone, L. de’ Medici, and A. Georges, Phys. Rev. B 76, 245116 (2007).
- Liebsch and Tong (2009) A. Liebsch and N.-H. Tong, Phys. Rev. B 80, 165126 (2009).
- (32) A. Liebsch and H. Ishida, eprint arXiv:1109.0158.
- Sénéchal et al. (2000) D. Sénéchal, D. Perez, and M. Pioro-Ladrière, Phys. Rev. Lett. 84, 522 (2000).
- Go and Jeon (2010) A. Go and G. S. Jeon, J. Korean Phys. Soc. 56, 994 (2010).
- Go and Jeon (2008) A. Go and G. S. Jeon, J. Korean Phys. Soc. 53, 1006 (2008).
- Tincani et al. (2009) L. Tincani, R. M. Noack, and D. Baeriswyl, Phys. Rev. B 79, 165109 (2009).