The Wolf-Rayet population of the nearby barred spiral galaxy NGC 5068 uncovered by VLT and Gemini
Abstract
We present a narrow-band VLT/FORS1 imaging survey of the SAB(rs)cd spiral galaxy NGC 5068, located at a distance of 5.45 Mpc, from which 160 candidate Wolf-Rayet sources have been identified, of which 59 cases possess statistically significant 4686 excesses. Follow-up Gemini/GMOS spectroscopy of 64 candidates, representing 40% of the complete photometric catalogue, confirms Wolf-Rayet signatures in 30 instances, corresponding to a 47% success rate. 21 out of 22 statistically significant photometric sources are spectroscopically confirmed. Nebular emission detected in 30% of the Wolf-Rayet candidates spectrally observed, which enable a re-assessment of the metallicity gradient in NGC 5068. A central metallicity of log(O/H)+12 8.74 is obtained, declining to 8.23 at . We combine our spectroscopy with archival H images of NGC 5068 to estimate a current star formation rate of 0.63 yr-1, and provide a catalogue of the 28 brightest HII regions from our own continuum subtracted H images, of which 17 qualify as giant HII regions. Spectroscopically, we identify 24 WC and 18 WN-type Wolf-Rayet stars within 30 sources since emission line fluxes indicate multiple Wolf-Rayet stars in several cases. We estimate an additional 66 Wolf-Rayet stars from the remaining photometric candidates, although sensitivity limits will lead to an incomplete census of visually faint WN stars, from which we estimate a global population of 170 Wolf-Rayet stars. Based on the H-derived O star population of NGC 5068 and N(WR)/N(O)0.03, representative of the LMC, we would expect a larger Wolf-Rayet population of 270 stars. Finally, we have compared the spatial distribution of spectroscopically confirmed WN and WC stars with SDSS-derived supernovae, and find both WN and WC stars to be most consistent with the parent population of Type Ib SNe.
keywords:
stars: Wolf-Rayet - Supernovae - galaxies: stellar content, galaxies: individual: NGC5068 - ISM: HII regions1 Introduction
Massive stars (8 M⊙) dominate the radiative ionizing budget of star-forming galaxies, and contribute significantly to the mechanical energy budget via their powerful stellar winds and ultimate death as core-collapse supernovae (ccSNe), plus the chemical enrichment of galaxies, especially for -elements. However, theoretically their evolutionary paths and precise fate remain unclear, arising from details of stellar winds, initial rotation and metallicity. Empirical results such as the ratio of blue and red supergiants, or the ratio of Wolf-Rayet (WR) to O stars provide sensitive tests of evolutionary models which incorporate complex processes, such as rotation (Langer & Maeder, 1995; Maeder & Meynet, 2000).
The conventional WR phase corresponds to the core-helium burning stage of massive stars (20-25 M⊙ in the Milky Way), with a duration of only a few hundred thousand years (Crowther, 2007). WR stars possess winds densities which are an order of magnitude higher than O stars, producing a unique, broad emission-line spectrum. Spectroscopically, they are divided into WN and WC subtypes which are dominated by He ii 4686 and C iii 4650 + C iv 5808 emission lines, respectively. Consequently, WN and WC stars are associated with the products of the core hydrogen- (CNO cycle) and helium-burning (3). Photometrically, WR stars cannot be distinguished from blue supergiants (BSG) via broad-band imaging, although strong emission lines facilitate their detection via suitable narrow-band filters (Moffat & Shara, 1983).
Follow-up spectroscopy of photometric candidates with 4m aperture telescopes is routinely capable of determining the nature of Wolf-Rayet stars in Local Group galaxies (Neugent & Massey, 2011). However, beyond the Local Group 8m class telescopes are required. The advantages of using telescopes such as the Very Large Telescope (VLT) were first demonstrated by Schild et al (2003) in their investigation into the WR population of NGC 300. Observations of massive stars beyond 1 Mpc provide a broader range of galaxy morphological types and metallicities than those available in the Local Group. In addition, the much larger volume sampled enables progress in empirically linking various flavours of core-collapse supernovae (ccSNe) to progenitor stars.
Massive stars with initial masses 8–20 M⊙ retain their hydrogen envelope and end their lives in the red supergiant (RSG) phase undergoing core–collapse and producing a H-rich Type II ccSN (Smartt, 2009). This has been observationally confirmed from archival broad-band pre-SN images e.g. SN 2003gd, which was identified as an 8 M⊙ RSG (Smartt et al, 2004). Stars with initial masses above 20 M⊙ are thought to end their lives during the WR phase as H-poor Type Ib or H+He-poor Type Ic ccSNe (Woosley & Bloom, 2006). However, no direct detection of Type Ib/c SNe progenitors have, to date, been established.
A greater understanding of the progenitors of ccSNe can be achieved through observations of the environments in which the SNe occur (Anderson & James, 2008). Kelly et al. (2008) found that H-rich Type II ccSNe follow the distribution of the host galaxy light, whereas Type Ib and Ic ccSNe are located in the brightest regions of the galaxy. Moreover, the distributions of Type Ib and Ic ccSNe are different, suggesting that they have different progenitors. If WN and WC stars are the progenitors of Type Ib and Ic ccSNe respectively, then they should be located in the same regions of the galaxy. Leloudas et al. (2010) applied the same method to the spectroscopic WR surveys of M83 and NGC 1313 (Hadfield et al., 2005; Hadfield & Crowther, 2007), confirming that the WN-Type Ib and WC-Type Ic were the most likely progenitor scenarios, albeit with low number statistics.
An alternative scenario for the production of Type Ib/c ccSNe has been proposed by Podsialowski et al (1992) in which intermediate mass stars in binary systems lose their hydrogen and helium envelopes via Roche Lobe overflow and/or common envelope evolution. This stripping of outer layers would result in a low mass helium core which would have WR-like emission, however, such low mass helium cores would be completely hidden by their higher mass companions. This scenario appears consistent with Type Ic SN 2002ap in M74, for which deep CFHT broad-band images did not reveal any progenitor down to a limiting magnitude of MB = –4.2 mag (Crockett et al, 2007), suggesting a binary system with a low mass C+O core of 5 M⊙ (Mazzali et al, 2002).
At present, the relative statistics of core-collapse supernovae (Smartt et al, 2009; Li et al, 2011) favour both binary and single star evolutionary channels (Smith et al., 2011). Our group are undertaking photometric and spectroscopic surveys of Wolf-Rayet stars in a dozen star-forming galaxies beyond the Local Group for the purpose of studying massive stars in a variety of environments and to provide a database of future Type Ib/c progenitors.
In this paper we investigate the WR population of NGC 5068, a face-on barred spiral galaxy (de Vaucouleurs et al., 1991, SAB(rs)cd), situated at a distance of 5.45 Mpc (Herrmann et al., 2008) beyond the Centaurus A group (Karachentsev et al., 2007). NGC 5068 is known to host WR stars, since their spectroscopic signatures have been serendipitously detected in observations of bright H ii regions by Rosa & D’Odorico (1986). However, no systematic search for WR stars in NGC 5068 has been undertaken and the stellar content of NGC 5068 remains largely unknown. Here, we present a comprehensive study of the massive stellar population of NGC 5068, and compare the distribution of WR stars relative to the giant H ii regions in NGC 5068. We constrain estimates of the star-formation rate (SFR) of NGC 5068 which vary wildly, from 0.35 M⊙yr-1 to 3 M⊙yr-1 (Martin & Friedli, 1997; Ryder et al., 1994). Similarly, measurements of the central metallicity of the galaxy range from LMC-like metallicities (Hodge, 1974) to super-solar (Ryder, 1995).
This paper is organised as follows. In Section 2 we discuss the observations, data reduction and source selection, while in Section 3 we analyse the nebular properties of H ii regions in NGC 5068. Section 4 determines the WR population and Section 5 the O star population and SFR of NGC 5068. In Section 6 we assess the global WR population based on the completeness of our observations. Section 7 provides a comparison of results with both NGC 7793 and predictions from evolutionary theory. Finally, Section 8 compares the spatial distribution of the WR stars in NGC 5068 with those of ccSN; a summary follows in Section 9.
2 Observations & Data Reduction
NGC 5068 has been imaged with the ESO Very Large Telescope (VLT) and Focal Reduced/Low-dispersion Spectrograph #1 (FORS1) covering a field-of-view of 6.8 6.8 arcmin2 with a plate scale of 0.25 arcsec pixel-1. Both broad- and narrow-band imaging were obtained on 2008 April 7 under program ID 081.B-0289 (P.I. Crowther). In addition, the Gemini Multi-Object Spectrograph (GMOS) on the Gemini-South telescope was used to obtain follow-up spectroscopy in March-April 2009 under program ID GS-2009A-Q-20 (P.I. Crowther). The R150 grating was placed at a central wavelength of 510nm and 530nm with a dispersion of 3.5 pixel-1. Further details of the observations can be found in Table 1.
| Date | Filter/ | Exposure | Seeing | |
| mask ID | () | time (s) | (arcsec) | |
| VLT/FORS1 Imaging | ||||
| 2008-04-07 | B high | 4400 | 250 | 0.80 |
| V high | 5570 | 250 | 0.80 | |
| H | 6563 | 250 | 0.85 | |
| H/4500 | 6665 | 250 | 0.75 | |
| He ii | 4684 | 31025 | 0.80 | |
| He ii/6500 | 4781 | 31025 | 0.75 | |
| Gemini/GMOS Spectroscopy | ||||
| 2009-04-03 | MASK 1 | 5100/5300 | 6430 | 0.87 |
| 2009-03-31 | MASK 2 | 5100/5300 | 61400 | 0.87 |
| 2009-04-01 | MASK 3 | 5100/5300 | 61400 | 1.16 |
2.1 Imaging & Photometry
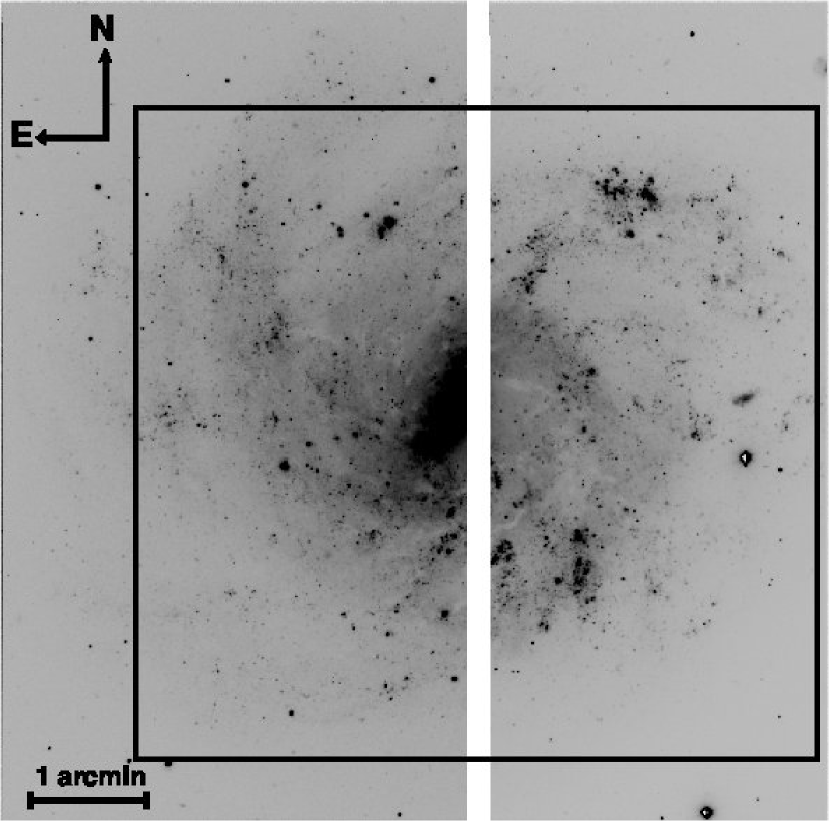
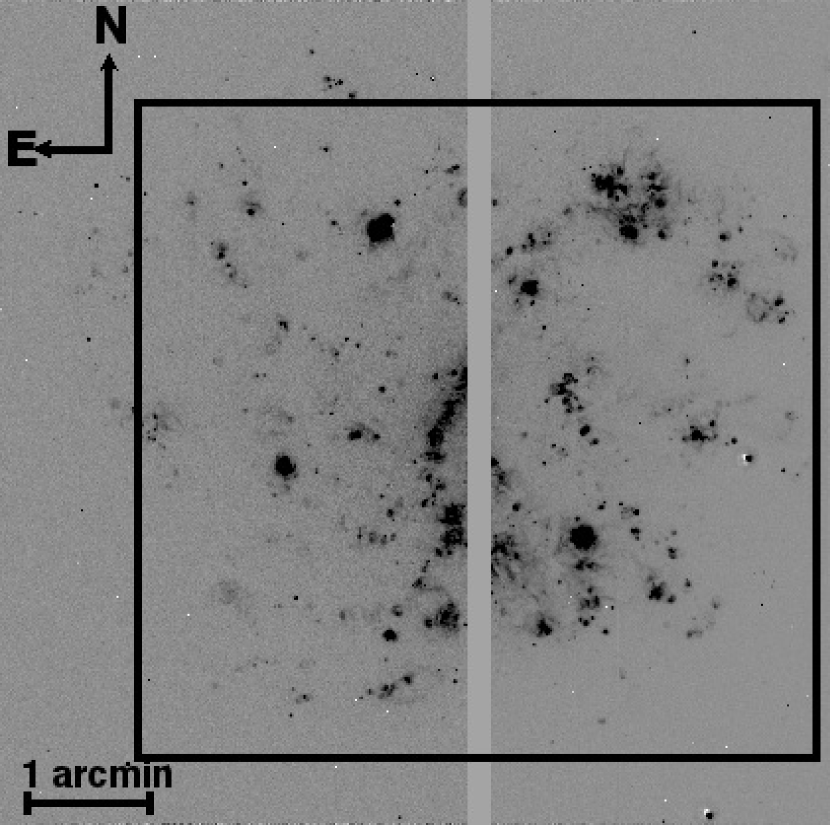
FORS1 was used on 7 April 2008 to obtain narrow-band imaging of NGC 5068 centered on 4684 and 4781 under good seeing conditions of 0.8″. Three 1025 second exposures were obtained for each filter while a single exposure of 250 seconds was used for additional narrow-band on– and off–H images (6563 and 6665, respectively). Broad V- and B-band high-throughput images of 250 seconds each were also acquired on the same night to supplement the narrow-band images. The field of view of the FORS1 images is presented in Figure 1, the black square indicates the region covered by our spectroscopic observations which will be discussed further in Section 2.3.
Data reduction, including bias subtraction, flat fielding and image combining were achieved using standard procedures in iraf (Tody, 1986). Photometry was performed using the daophot routine for the B, V, 4684 and 4781 images. Individual sources were fit with a gaussian point-spread function (PSF) to determine their magnitude and its associated error.
Figure 2 shows the log distribution of the number of sources within each 0.4 magnitude bin. Following Bibby & Crowther (2010) we fit a power law to the bright end of the distribution using IDL, to assess the completeness of our imaging. The 100% completeness limit is indicated by the turnover of the distribution where the observed data deviates from the extrapolated power law. The 100% completeness limit for our NGC 5068 narrow-band imaging corresponds to m4684 = 24.0 mag. We define the 50% completeness limit as the magnitude at which only 50% of the sources predicted by the power law are detected, finding a 50% detection limit of m4686 =24.8 mag for NGC 5068. The significance of these detection limits is discussed further in Section 6.2. The detection limits for the broad-band images are almost identical to those of the narrow-band imaging.

Typical photometric errors for all images were approximately 0.04 mag for bright (m4684 = 21 mag) with significantly higher errors of 0.20 mag for the faintest stars (m4684 = 26 mag) and 0.5 mag for m4684 = 27 mag. Figure 3 shows the distribution photometric errors for the 4684 images. In some instances, irrespective of the brightness of the source, severe crowding makes a PSF fit inappropriate, so no photometry is derived for some sources.

Absolute calibration for the broad-band images was achieved from observations of five stars within the standard star field SA 110-362 (Stetson, 2000). For the narrow-band images the spectrophotometric standard star LTT 7987 (Hamuy et al., 1994) was used to obtain photometric zero–points since standard star fields are not available. The associated error on the calculated zero–points is 0.15 mag.
2.2 Source Selection
The 4684 narrow-band filter is coincident with the N iii4640, He ii4686 and C iv4650 WR emission lines and the 4781 filter is placed on the continuum where there are no WR lines present. The “blinking” technique, pioneered by Moffat & Shara (1983), is the easiest way of identifying WR candidates and compares the 4684, 4781 and continuum subtracted image (4684 minus the 4781 image) to reveal emission-line stars.
In total 160 Wolf-Rayet candidates were identified in NGC 5068, which are listed in Table 2. Photometry was obtained for 95% of the candidates in at least the 4684 filter. The few sources for which 4684 photometry was not obtained were either too faint, extended or were located in a crowded region which makes reliable photometry difficult; Very extended or crowded sources are noted in Table 2, as are three sources which lay at the very edge of the FORS1 CCD that naturally represent less secure candidates. Although all 160 candidates were identified from the ‘blinking’ technique, photometric errors indicates that only 59 sources are formally 3 detections.
To enable accurate mapping of the WR candidates an astrometric solution was achieved by comparing the measured position of several stars in the image to their positions found in the Guide Star Catalogue. We found offsets of –0.6 arcsec and +0.22 arcsec for the right ascension and declination, respectively, which have been applied to the WR candidates listed in Table 2.
| ID | RA | Dec | r/ | mV | mB–mV | m4684 | m4684–m4781 | E(B-V) | MV | M4684 | Spectral | HII region | Finding |
|---|---|---|---|---|---|---|---|---|---|---|---|---|---|
| J2000 | J2000 | mag | mag | mag | mag | mag | mag | mag | Type | Chart | |||
| 1 | 13:18:41.27 | -20:59:53.1 | 1.20 | – | – | 24.82 0.09 | –0.72 0.15 | 0.259 | – | –4.79 | (WN)(1) | – | 28 |
| 2 | 13:18:41.27 | -21:04:36.9 | 1.07 | 21.68 0.07 | +1.76 0.07 | 22.82 0.02 | –0.16 0.10 | 0.259 | –7.80 | –6.79 | (no WR) | – | 23 |
| 3 | 13:18:43.15 | -21:01:38.4 | 0.79 | 22.06 0.29 | +0.27 0.29 | 22.29 0.02 | +0.01 0.09 | 0.259 | –7.42 | –7.32 | (no WR) | – | 24 |
| 4 | 13:18:43.30 | -21:03:41.2 | 0.81 | 21.71 0.02 | +1.72 0.02 | 22.81 0.02 | –0.09 0.12 | 0.259 | –7.77 | –6.80 | (no WR) | faint | 23 |
| 5 | 13:18:43.36 | -21:01:29.1 | 0.80 | extended | 0.259 | (WR?) | faint | 24 | |||||
| 6 | 13:18:43.44 | -21:01:31.5 | 0.79 | 23.76 0.26 | +0.17 0.26 | 22.95 0.03 | –1.46 0.23 | 0.247 | –5.69 | –6.62 | WN4–6(2) | faint | 24 |
| 7 | 13:18:43.61 | -21:01:20.7 | 0.80 | 23.37 0.12 | +0.40 0.14 | 23.58 0.06 | –0.42 0.10 | 0.259 | –6.11 | –6.03 | (no WR) | faint | 24 |
| 8 | 13:18:43.64 | -21:01:24.6 | 0.79 | 23.19 0.07 | +0.06 0.07 | 23.30 0.03 | –0.03 0.07 | 0.259 | –6.29 | –6.31 | no WR | faint | 24 |
| 9 | 13:18:44.41 | -21:02:34.1 | 0.66 | 21.75 0.45 | –0.08 0.45 | 21.83 0.08 | –0.21 0.08 | 0.259 | –7.73 | –7.78 | (no WR) | bright | 22 |
| 10 | 13:18:44.75 | -21:01:04.3 | 0.78 | 24.30 0.09 | +0.64 0.11 | – | – | 0.428 | –5.18 | – | WC4–5(1) | faint | 25 |
| 11 | 13:18:44.85 | -21:00:50.4 | 0.82 | 21.68 0.02 | +0.17 0.06 | 22.09 0.07 | –0.09 0.09 | 0.259 | –7.80 | –7.52 | (no WR) | HII #3 | 25 |
| 12 | 13:18:45.09 | -21:01:03.8 | 0.76 | 22.81 0.06 | +0.16 0.07 | 22.35 0.02 | –0.95 0.25 | 0.284 | –6.75 | –7.35 | WCE(1) | bright | 25 |
| 13 | 13:18:45.23 | -21:02:25.6 | 0.60 | 21.75 0.02 | +0.05 0.04 | 21.90 0.03 | –0.09 0.10 | 0.465 | –8.37 | –8.45 | WCE(1)(?) | bright | 22 |
| 14 | 13:18:45.56 | -21:02:33.5 | 0.58 | 21.57 0.22 | +0.12 0.22 | 21.72 0.02 | –0.22 0.26 | 0.259 | –7.91 | –7.89 | no WR | HII #4 | 22 |
| 15 | 13:18:45.77 | -21:02:38.6 | 0.57 | – | – | 24.35 0.05 | –1.14 0.11 | 0.259 | – | –5.26 | (WN)(1) | – | 22 |
| 16 | 13:18:45.84 | -21:02:30.5 | 0.56 | extended | 0.259 | (WR?) | HII #4 | 22 | |||||
| 17 | 13:18:46.07 | -21:03:47.3 | 0.68 | 22.56 0.05 | +0.25 0.06 | 22.30 0.02 | +1.12 0.09 | 0.230 | –6.83 | –7.21 | WC4-5(2) | bright | 20 |
| 18 | 13:18:46.12 | -21:03:25.0 | 0.62 | – | – | 24.59 0.05 | –0.55 0.09 | 0.259 | – | –5.02 | (WN)(1) | – | 20 |
| 19 | 13:18:46.63 | -21:03:32.0 | 0.61 | 23.43 0.03 | +0.43 0.06 | 23.43 0.04 | –0.63 0.11 | 0.259 | –6.05 | –6.18 | WC(1) | bright | 20 |
| 20 | 13:18:46.96 | -21:01:47.5 | 0.54 | 23.74 0.11 | –0.13 0.11 | 23.62 0.05 | –0.11 0.26 | 0.259 | –5.99 | (no WR) | – | 21 | |
| 21 | 13:18:47.01 | -21:00:33.8 | 0.77 | 21.72 0.21 | +0.89 0.21 | 22.79 0.03 | –0.46 0.14 | 0.595 | –8.80 | –8.03 | WNE(2)(?) | HII #6 | 26 |
| 22 | 13:18:47.09 | -21:00:25.3 | 0.80 | 23.15 0.45 | –0.01 0.45 | – | – | 0.259 | –6.33 | – | no WR | bright | 27 |
| 23 | 13:18:47.16 | -21:03:54.0 | 0.65 | 23.75 0.27 | –0.07 0.29 | – | – | 0.259 | –5.73 | – | (WR?) | HII #7 | 20 |
| 24 | 13:18:47.24 | -21:00:36.5 | 0.75 | – | – | – | – | 0.259 | – | – | (WR?) | – | 26 |
| 25 | 13:18:47.438 | -21:00:19.7 | 0.81 | 20.29 0.10 | +0.12 0.11 | 20.44 0.04 | –0.01 0.33 | 0.259 | –9.19 | –9.17 | no WR | bright | 27 |
| 26 | 13:18:47.44 | -21:03:53.2 | 0.64 | 23.37 0.13 | –0.06 0.15 | 23.71 0.06 | –0.22 0.50 | 0.259 | –6.11 | –5.90 | (no WR) | HII #7 | 20 |
| 27 | 13:18:47.47 | -21:01:57.4 | 0.48 | 23.39 0.09 | +1.83 0.15 | 24.52 0.09 | –0.38 0.09 | 0.259 | –6.09 | –5.09 | (no WR) | – | 21 |
| 28 | 13:18:47.50 | -21:03:43.2 | 0.60 | 22.78 0.09 | +0.07 0.09 | 22.72 0.01 | –0.18 0.02 | 0.159 | –6.39 | –6.53 | (WN)(1) | faint | 20 |
| 29 | 13:18:47.50 | -21:03:28.3 | 0.55 | 25.19 0.05 | +0.01 0.12 | 24.80 0.11 | –0.30 0.31 | 0.259 | –4.29 | –4.81 | (no WR) | – | 20 |
| 30 | 13:18:47.70 | -21:00:09.1 | 0.85 | 25.07 0.05 | -0.22 0.10 | 23.90 0.05 | –1.51 0.10 | 0.259 | –4.41 | –5.71 | (WC)(1) | – | 27 |
| 31 | 13:18:47.74 | -21:02:14.6 | 0.44 | 21.95 0.03 | –0.02 0.08 | 22.03 0.09 | +0.04 0.24 | 0.259 | –7.53 | –7.58 | no WR | – | 21 |
| 32 | 13:18:47.78 | -21:02:19.2 | 0.44 | 23.76 0.05 | –0.22 0.06 | 22.48 0.02 | –1.27 0.45 | 0.259 | –5.72 | –7.13 | (WN)(2) | – | 21 |
| 33 | 13:18:48.05 | -21:03:52.3 | 0.61 | – | – | – | – | – | – | – | (WR?) | – | 20 |
| 34 | 13:18:48.06 | -21:00:48.7 | 0.66 | 18.61 0.04 | +0.67 0.07 | 19.59 0.07 | –0.08 0.48 | 0.259 | –10.87 | -10.02 | no WR | HII #9 | 26 |
| 35 | 13:18:48.12 | -21:00:37.7 | 0.70 | – | – | – | 0.259 | – | – | WCE(2) | faint | 26 | |
| 36 | 13:18:48.18 | -21:00:48.4 | 0.66 | – | – | 21.54 0.10 | –1.02 0.10 | 0.259 | – | –8.07 | (WC)(1) | HII #9 | 26 |
| 37 | 13:18:48.18 | -21:00:38.9 | 0.70 | – | – | – | – | 0.259 | – | – | (WR?) | faint | 26 |
| 38 | 13:18:48.19 | -21:00:34.2 | 0.72 | – | – | – | – | 0.259 | – | – | (WR?) | faint | 26 |
| 39 | 13:18:48.29 | -21:00:33.4 | 0.72 | 22.59 0.06 | +0.21 0,08 | 22.75 0.05 | –0.04 0.15 | 0.259 | –6.89 | –6.86 | WN(1) | – | 26 |
| 40 | 13:18:48.56 | -21:00:17.3 | 0.78 | 20.59 0.04 | +0.38 0.06 | 21.23 0.05 | –0.03 0.37 | 0.259 | –8.89 | –8.38 | (no WR) | HII #10 | 27 |
| 41 | 13:18:48.98 | -21:00:21.0 | 0.74 | 19.42 0.06 | +0.27 0.06 | 19.82 0.03 | –0.02 0.36 | 0.259 | –10.06 | –9.79 | no WR | HII #11 | 27 |
| 42 | 13:18:48.98 | -21:00:25.4 | 0.72 | 20.77 0.08 | –0.13 0.09 | 20.29 0.06 | –0.49 0.39 | 0.259 | –8.71 | –9.32 | (WC)(2) | faint | 27 |
| 43 | 13:18:49.15 | -21:02:33.1 | 0.35 | 22.90 0.05 | +0.09 0.05 | 22.42 0.02 | –0.65 0.06 | 0.259 | –6.58 | –7.19 | WN5b(3) | – | 15 |
| 44 | 13:18:49.31 | -21:02:00.2 | 0.36 | 22.93 0.28 | –0.21 0.29 | 23.00 0.10 | –0.30 0.10 | 0.259 | –6.55 | –6.66 | (WN)(1) | – | 15 |
| 45 | 13:18:49.36 | -21:00:21.6 | 0.73 | 19.53 0.16 | +0.38 0.16 | 20.17 0.03 | 0.00 0.29 | 0.259 | –9.95 | –9.44 | no WR | HII #12 | 27 |
| 46 | 13:18:49.47 | -21:02:34.5 | 0.33 | 21.10 0.11 | +0.07 0.12 | 21.31 0.03 | +0.02 0.06 | 0.259 | –8.38 | –8.30 | (no WR) | bright | 15 |
| 47 | 13:18:49.49 | -21:03:55.9 | 0.57 | 21.56 0.21 | –0.10 0.22 | 21.55 0.09 | –0.38 0.15 | 0.259 | –7.92 | –8.06 | (no WR) | faint | 19 |
| 48 | 13:18:49.60 | -21:03:38.3 | 0.49 | – | – | – | – | 0.259 | – | – | (WR?) | faint | 19 |
| 49 | 13:18:49.69 | -21:03:19.9 | 0.42 | 20.05 0.07 | +0.31 0.07 | 20.33 0.01 | –0.03 0.07 | 0.259 | –9.43 | –9.28 | (no WR) | HII #14 | 29 |
| 50 | 13:18:49.72 | -21:03:41.7 | 0.50 | 21.46 0.07 | –0.13 0.10 | 21.32 0.09 | –0.27 0.09 | 0.259 | –8.02 | –8.29 | (WN)(2) | – | 19 |
| 51 | 13:18:49.78 | -21:04:06.8 | 0.61 | 22.64 0.08 | –0.34 0.09 | 22.68 0.03 | –0.59 0.49 | 0.259 | –6.84 | –6.93 | (WN)(1) | bright | 19 |
| 52 | 13:18:49.80 | -21:02:28.2 | 0.30 | 22.38 0.14 | –1.78 0.15 | 20.99 0.02 | –0.16 0.15 | 0.259 | –7.10 | –8.62 | (no WR) | HII #13 | 15 |
Table 2(continued)
ID
RA
Dec
r/
mV
mB–mV
m4684
m4684–m4781
E(B-V)
MV
M4684
Spectral
HII Region
Finding
J2000
J2000
mag
mag
mag
mag
mag
mag
mag
Type
Chart
53
13:18:49.80
-21:02:26.5
0.30
–
–
23.14 0.09
–0.35 0.09
0.259
–
–6.47
(WN)(1)
HII #13
15
54
13:18:49.81
-21:03:48.7
0.53
21.74 0.08
+0.19 0.09
21.92 0.05
–0.02 0.54
0.101
–7.25
–7.12
no WR
–
19
55
13:18:49.84
-21:03:20.7
0.42
22.11 0.05
+0.08 0.09
22.43 0.05
–0.23 0.15
0.259
–7.37
–7.18
no WR
HII #14
29
56
13:18:49.90
-21:02:30.3
0.30
23.28 0.20
–0.12 0.21
22.32 0.02
–2.00 0.37
0.259
–6.20
–7.29
(WC)(1)
HII #13
15
57
13:18:49.98
-21:03:56.8
0.56
23.64 0.05
–0.59 0.07
23.47 0.06
–0.72 0.06
0.259
–5.84
–6.14
(WN)(1)
–
19
58
13:18:49.99
-21:03:23.7
0.42
19.42 0.14
+0.05 0.15
19.19 0.08
–0.39 0.49
0.259
–10.06
–10.42
(no WR)
HII #14
29
59
13:18:50.03
-21:02:17.5
0.29
–
–
22.14 0.01
–1.62 0.35
0.259
–
–7.47
WCpec?(?)
bright
15
60
13:18:50.08
-21:03:21.3
0.41
20.12 0.05
+0.10 0.08
20.46 0.07
–0.16 0.37
0.451
–9.96
–9.84
no WR
HII #14
29
61
13:18:50.11
-21:03:45.2
0.50
21.86 0.09
–0.01 0.10
23.56 0.08
–0.47 0.15
0.259
–7.62
–6.05
(WN)(1)
–
19
62
13:18:50.26
-21:03:20.0
0.41
24.24 0.33
–0.53 0.33
24.29 0.06
–0.29 0.08
0.259
–5.24
–5.32
(WN)(1)
bright
29
63
13:18:50.27
-21:00:51.4
0.56
21.06 0.08
+1.52 0.09
22.04 0.04
–0.10 0.29
0.259
–8.42
–7.57
no WR
faint
13
64
13:18:50.38
-21:02:15.6
0.27
24.39 0.14
–0.18 0.15
24.36 0.07
–0.47 0.14
0.259
–5.09
–5.25
(WN)(1)
faint
15
65
13:18:50.40
-21:02:18.6
0.27
21.18 0.09
+0.12 0.09
20.95 0.01
–0.54 0.14
0.259
–8.30
–8.66
WC6(2)
bright
15
66
13:18:50.41
-21:03:42.9
0.48
24.56 0.12
–0.42 0.14
23.95 0.06
–0.41 0.14
0.259
–4.92
–5.66
(WN)(1)
–
19
67
13:18:50.42
-21:02:01.8
0.29
22.15 0.52
–0.26 0.53
21.87 0.05
–0.26 0.53
0.259
–7.33
–7.74
(no WR)
bright
15
68
13:18:50.50
-21:02:02.2
0.28
blended with A24
0.259
(WR?)
bright
15
69
13:18:50.66
-21:02:06.2
0.27
–
–
22.04 0.03
–0.49 0.03
0.259
–
–7.57
(WN)(2)
HII #15
15
70
13:18:50.67
-21:02:07.6
0.26
20.37 0.13
+0.02 0.13
20.32 0.03
–0.10 0.11
0.259
–9.11
–9.29
(no WR)
HII #15
15
71
13:18:50.80
-21:01:08.6
0.46
20.70 0.21
+1.70 0.21
21.79 0.04
–0.09 0.09
0.259
–8.78
–7.82
no WR
faint
13
72
13:18:51.05
-21:02:22.4
0.22
–
–
–
–
0.259
–
–
(WR?)
–
15
73
13:18:51.16
-21:04:09.3
0.59
21.07 0.17
+0.03 0.18
21.11 0.10
–0.11 0.37
0.277
–8.47
–8.57
no WR
HII #16
18
74
13:18:51.30
-21:03:50.5
0.49
–
–
23.04 0.05
–0.17 0.07
0.259
–
–6.57
(no WR)
bright
18
75
13:18:51.43
-21:04:09.0
0.58
21.78 0.10
+0.08 0.12
21.79 0.05
–0.25 0.11
0.259
–7.70
–7.82
(no WR)
HII #16
18
76
13:18:51.50
-21:04:08.3
0.58
20.69 0.18
+0.27 0.18
21.02 0.04
–0.20 0.11
0.259
–8.79
–8.59
(no WR)
HII #16
18
77
13:18:51.66
-21:00:05.1
0.74
20.41 0.16
+1.36 0.17
21.32 0.05
+0.03 0.08
0.259
–9.07
–8.29
no WR
faint
12
78
13:18:51.68
-21:01:18.4
0.38
22.70 0.27
–0.23 0.28
22.34 0.04
–0.35 0.04
0.259
–6.78
–7.27
WN6(1)
HII #17
14
79
13:18:51.79
-21:01:06.5
0.44
–
–
23.89 0.08
–0.44 0.08
0.259
–
–5.72
(WN)(1)
–
13
80
13:18:51.78
-21:03:37.3
0.42
25.25 0.06
–0.33 0.10
–
–
0.259
–4.23
–
(WR?)
faint
17
81
13:18:51.85
-21:00:49.6
0.52
20.54 0.09
+0.24 0.10
21.20 0.05
+0.02 0.05
0.259
–8.94
–8.41
no WR
HII #18
13
82
13:18:51.86
-21:01:16.1
0.39
19.74 0.18
+0.05 0.18
19.63 0.05
–0.25 0.07
0.259
–9.74
–9.98
(WN)(8)
HII #17
14
83
13:18:51.90
-21:00:53.9
0.49
20.87 0.14
+0.15 0.14
21.02 0.04
+0.02 0.08
0.259
–8.61
–8.59
no WR
faint
13
84
13:18:51.98
-21:03:41.2
0.44
24.52 0.02
–0.21 0.04
22.72 0.02
–2.35 0.23
0.259
–4.96
–6.89
WC4–5(1)
–
17
85
13:18:52.04
-21:01:14.9
0.39
21.80 0.06
+0.35 0.07
22.23 0.03
+0.06 0.39
0.259
–7.68
–7.38
no WR
HII #17
14
86
13:18:52.15
-21:01:18.8
0.37
23.02 0.19
–0.31 0.20
22.57 0.03
–0.31 0.04
0.259
–6.46
–7.04
(WN)(1)
bright
14
87
13:18:52.16
-21:01:14.2
0.39
–
–
–
–
0.259
–
–
(WR?)
faint
14
88
13:18:52.19
-21:01:21.7
0.35
24.41 0.12
+0.15 0.14
23.03 0.03
–2.80 0.06
0.259
–5.07
–6.58
(WC)(1)
–
14
89
13:18:52.22
-21:04:07.0
0.56
–
–
22.42 0.03
–2.54 0.13
0.259
–
–7.19
(WC)(1)
–
18
90
13:18:52.28
-21:01:25.4
0.33
23.82 0.09
–0.17 0.10
22.03 0.03
–2.23 0.06
0.259
–5.66
–7.58
WC4–5(2)
–
14
91
13:18:52.29
-21:01:22.6
0.34
24.41 0.12
+0.15 0.14
23.03 0.04
–2.80 0.06
0.259
–5.07
–6.58
(WC)(1)
bright
14
92
13:18:52.39
-21:03:43.5
0.44
22.34 0.15
+0.18 0.16
22.55 0.05
–0.79 0.17
0.259
–7.14
–7.06
(WN)(2)
faint
14
93
13:18:52.57
-21:00:57.8
0.46
21.42 0.19
–0.14 0.02
21.33 0.06
–0.11 0.35
0.170
–7.79
–7.96
WNE(1)
bright
13
94
13:18:52.71
-21:03:04.3
0.25
25.14 0.08
–0.71 0.09
22.55 0.02
–3.36 0.05
0.259
–4.34
–7.06
WC7(1)
–
16
95
13:18:52.72
-21:03:27.6
0.36
–
–
21.99 0.09
+0.12 0.28
0.259
–
–7.62
no WR
faint
17
96
13:18:52.95
-21:02:54.3
0.19
23.46 0.31
–0.15 0.32
22.39 0.02
–1.20 0.19
0.259
–6.02
–7.22
(WN)(2)
bright
16
97
13:18:53.06
-21:03:56.8
0.50
21.44 0.29
+1.98 0.29
22.64 0.04
–0.12 0.09
0.259
–8.04
–6.97
(no WR)
bright
18
98
13:18:53.06
-21:03:25.7
0.34
–
–
–
0.259
–
–
(WR?)
bright
17
99
13:18:53.08
-21:03:22.7
0.33
23.66 0.04
+0.53 0,05
–
–
0.259
–5.82
–
WN6(3)
bright
17
100
13:18:53.11
-21:03:30.9
0.37
23.17 0.33
+0.12 0.33
23.11 0.05
–0.21 0.07
0.259
–6.31
–6.50
(WN)(1)
bright
17
101
13:18:53.13
-21:03:36.6
0.40
19.69 0.05
+0.21 0.06
19.94 0.04
+0.07 0.46
0.259
–9.79
–9.67
no WR
faint
17
102
13:18:53.14
-21:00:32.2
0.57
22.03 0.22
+0.23 0.23
22.38 0.06
–0.13 0.39
0.259
–7.45
–7.23
(no WR)
bright
10
103
13:18:53.23
-21:02:43.5
0.14
22.39 0.09
–0.17 0.11
22.36 0.02
–0.18 0.45
0.027
–6.37
–6.42
no WR
HII #19
16
104
13:18:54.15
-21:02:03.8
0.09
edge of chip
–
–
–
0.147
–
–
WN(1)
–
8
105
13:18:54.15
-21:03:26.7
0.34
edge of chip
–
–
–
–
–
–
no WR
bright
7
106
13:18:54.18
-21:00:27.9
0.59
23.21 0.12
–0.19 0.13
22.80 0.04
–0.57 0.51
0.087
–5.74
–6.19
WN7(1)
bright
10
107
13:18:54.19
-21:03:07.6
0.24
edge of chip
–
–
–
0.259
–
–
(WR?)
bright
7
108
13:18:54.22
-21:00:32.1
0.56
20.88 0.05
+0.01 0.05
20.99 0.03
–0.05 0.18
0.259
–8.60
–8.62
no WR
faint
10
Table 2(continued)
ID
RA
Dec
r/
mV
mB–mV
m4684
m4684–m4781
E(B-V)
MV
M4684
Spectral
HII Region
Finding
J2000
J2000
mag
mag
mag
mag
mag
mag
mag
Type
Chart
109
13:18:54.24
-21:02:04.6
0.08
20.65 0.26
+0.57 0.27
20.85 0.10
–0.25 0.16
0.259
–8.83
– 8.7
(no WR)
bright
8
110
13:18:54.25
-21:03:06.5
0.24
24.40 0.03
–0.28 0.10
21.15 0.02
–0.15 0.03
0.102
–5.08
–8.46
(no WR)
faint
7
111
13:18:54.27
-21:02:55.1
0.18
25.04 0.12
–0.57 0.14
23.42 0.03
–1.50 0.06
0.259
–4.44
–6.19
WNL(1)
–
7
112
13:18:54.31
-21:03:08.2
0.25
–
–
22.14 0.04
–
0.102
–
–6.91
WC(1)
faint
7
113
13:18:54.38
-21:00:29.3
0.58
–
–
–
–
0.259
–
–
(WR?)
faint
10
114
13:18:54.49
-21:02:13.3
0.04
crowded
(WR?)
bright
8
115
13:18:54.60
-21:02:07.9
0.07
19.87 0.05
+0.15 0.08
19.99 0.09
–0.03 0.21
0.259
–9.61
–9.62
no WR
faint
8
116
13:18:54.67
-21:03:10.8
0.26
18.91 0.13
+0.05 0.14
18.99 0.06
–0.16 0.44
0.259
–10.57
–10.62
no WR
HII #20
7
117
13:18:54.67
-21:03:06.1
0.24
21.20 0.22
+0.20 0.22
21.37 0.02
–0.15 0.12
0.259
–8.28
–8.30
B0-B3
bright
7
118
13:18:54.77
-21:04:08.8
0.56
23.67 0.18
–0.02 0.18
22.68 0.03
–1.34 0.11
0.259
–5.81
–6.93
(WN)(2)
faint
5
119
13:18:54.82
-21:03:12.8
0.27
22.68 0.23
–0.39 0.23
21.62 0.02
–1.34 0.30
0.259
–6.80
–7.99
(WC)(1)
bright
7
120
13:18:54.83
-21:0.3:26.0
0.34
21.88 0.09
+0.05 0.09
21.99 0.03
+0.03 0.08
0.259
–7.60
–7.62
(no WR)
–
7
121
13:18:54.90
-21:04:02.8
0.53
extended
(WR?)
HII #21
5
122
13:18:54.96
-21:0.4:55.3
0.81
21.30 0.09
+1.60 0.10
22.44 0.03
–0.02 0.34
0.259
–8.18
–7.17
(no WR)
–
11
123
13:18:54.97
-21:04:06.2
0.55
21.95 0.04
+0.03 0.05
22.02 0.04
–0.08 0.13
0.259
–7.53
–7.59
no WR
bright
5
124
13:18:55.11
-21:04:05.0
0.55
23.43 0.22
-0.22 0.23
22.06 0.01
–1.54 0.10
0.259
–6.06
–7.55
(WC)(1)
faint
5
125
13:18:55.15
-21:02:57.1
0.20
22.18 0.08
+0.06 0.08
21.93 0.03
–0.43 0.04
0.259
–7.30
–7.68
WC(1)
bright
7
126
13:18:55.35
-21:02:32.3
0.09
21.81 0.11
+0.42 0.13
21.83 0.09
–0.32 0.09
0.259
–7.67
–7.78
(WN)(2)
bright
8
127
13:18:55.42
-21:04:13.1
0.59
–
–
24.08 0.05
–1.16 0.14
0.259
–
–5.53
(WN)(1)
–
5
128
13:18:55.53
-21:04:06.7
0.56
24.04 0.06
+0.26 0.08
extended
–
0.259
–5.44
–
WC4–5(1)
bright
5
129
13:18:55.66
-21:03:39.6
0.42
–
–
22.83 0.03
–0.55 0.32
0.358
–
–7.14
no WR
bright
6
130
13:18:55.79
-21:03:46.6
0.46
22.21 0.05
+0.55 0.08
22.84 0.09
–0.46 0.33
0.259
–7.27
–6.77
no WR
bright
6
131
13:18 56.02
-21:02:44.8
0.17
23.46 0.31
–0.15 0.32
22.39 0.02
–1.20 0.19
0.180
–5.78
–6.94
WC4(1)
bright
2
132
13:18:56.32
-21:04:36.3
0.73
21.72 0.18
–0.06 0.19
22.01 0.06
–0.54 0.06
0.259
–7.76
–7.60
(no WR)
bright
4
133
13:18 56.52
-21:02:04.7
0.15
23.87 0.09
+0.18 0.10
22.89 0.04
–1.55 0.08
0.259
–5.61
–6.72
WC4(1)
faint
2
134
13:18:56.77
-21:04:13.4
0.62
21.13 0.15
+0.58 0.16
21.12 0.02
–1.24 0.06
0.181
–8.11
–8.21
WC4(3)
HII #24
4
135
13:18:56.82
-21:02:13.7
0.16
20.12 0.09
+1.49 0.1
21.04 0.04
–0.05 0.15
0.259
–9.36
–8.57
no WR
faint
2
136
13:18:56.82
-21:04:41.6
0.76
22.74 0.09
+0.34 0.12
22.65 0.06
–1.01 0.06
0.259
–6.74
–6.96
no WR
faint
4
137
13:18:56.91
-21:03:10.7
0.32
21.97 0.13
–0.02 0.13
21.99 0.02
–0.05 0.09
0.259
–7.51
–7.62
(no WR)
bright
6
138
13:18:56.98
-21:04:13.1
0.62
20.38 0.41
+0.12 0.42
20.46 0.03
–0.27 0.45
0.259
–9.10
–9.15
(no WR)
HII #24
4
139
13:18:57.09
-21:00:46.1
0.51
–
–
–
–
0.259
–
–
(WR?)
HII #25
9
140
13:18:57.17
-21:03:25.3
0.39
23.37 0.21
+0.08 0.21
23.31 0.04
–0.25 0.06
0.259
–6.11
–6.30
(WN)(1)
faint
6
141
13:18:57.20
-21:02:07.8
0.19
21.70 0.06
–0.11 0.07
21.50 0,03
–0.28 0.06
0.259
–7.78
–7.91
no WR
bright
2
142
13:18:57.20
-21:00:47.8
0.50
21.25 0.15
–0.15 0.15
20.88 0.06
–0.29 0.13
0.259
–8.23
–8.73
(no WR)
HII #25
9
143
13:18:57.63
-21:03:22.0
0.40
22.34 0.03
+0.14 0.09
22.25 0.10
–0.56 0.43
0.259
–7.14
–7.36
(no WR)
faint
6
144
13:18:57.65
-21:04:41.9
0.78
23.78 0.04
+0.24 0.07
22.28 0.02
–2.58 0.41
0.259
–5.70
–7.33
(WC)(1)
bright
4
145
13:18:57.98
-21:02:28.4
0.24
23.06 0.05
–0.07 0,06
22.08 0.02
–1.11 0.17
0.259
–6.42
–7.53
WC6(1)
HII #26
2
146
13:18:58.04
-21:00:58.4
0.47
19.94 0.06
+1.58 0.07
20.98 0.03
–0.09 0.06
0.259
–9.54
–8.63
no WR
bright
9
147
13:18:59.01
-21:04:08.6
0.66
24.00 0.06
+0.35 0.08
23.43 0.03
–1.06 0.13
0.259
–5.48
–6.18
(WN)(1)
–
3
148
13:18:59.58
-21:02:09.4
0.34
23.87 0.09
+0.18 0.10
23.52 0.07
–0.68 0.32
0.259
–5.61
–6.09
(WN)(1)
–
2
149
13:19:00.02
-21:04:44.4
0.86
22.62 0.40
+0.67 0.40
23.23 0.03
–0.53 0.30
0.125
–6.45
–5.90
WNE(1)
bright
3
150
13:19:00.30
-21:04:46.2
0.88
24.33 0.17
+0.14 0.18
22.72 0.02
–2.72 0.08
0.259
–5.15
–6.89
WC4–5(1)
faint
3
151
13:19:00.77
-21:02:25.2
0.42
25.04 0.12
–0.57 0.14
23.42 0.03
–1.50 0.06
0.259
–4.44
–6.19
WNE(1)
–
2
152
13:19:00.79
-21:02:47.3
0.45
19.58 0.12
+0.40 0.14
20.79 0.09
+0.37 0.09
0.259
–9.90
–8.82
(no WR)
HII #28
2
153
13:19:01.98
-21:00:36.7
0.70
20.89 0.11
–0.14 0.12
20.76 0.06
–0.28 0.21
0.259
–8.59
–8.85
(no WR)
bright
1
154
13:19:02.02
-21:02:44.2
0.52
24.98 0.12
–0.40 0.15
24.53 0.10
–0.72 0.11
0.259
–4.50
–5.08
(WN)(1)
–
2
155
13:19:02.19
-21:01:15.3
0.59
19.82 0.21
+1.49 0.21
20.80 0.04
–0.05 0.53
0.259
–9.66
–9.79
no WR
bright
1
156
13:19:02.24
-21:01:11.5
0.60
21.59 0.08
+0.24 0.08
21.81 0.04
+0.09 0.08
0.259
–7.89
–7.80
no WR
–
1
157
13:19:02.74
-21:01:09.8
0.63
22.48 0.49
–0.33 0.49
22.21 0,05
–0.32 0.31
0.259
–7.00
–7.40
(no WR)
bright
1
158
13:19:02.93
-21:03:52.0
0.76
22.90 0.16
–0.05 0.16
22.75 0.02
–0.17 0.12
0.259
–6.58
–6.86
(no WR)
faint
3
159
13:19:05.09
-21:01:27.8
0.73
25.45 0.12
–0.47 0.16
24.17 0.08
–1.21 0.15
0.259
–4.03
–5.44
(WN)(1)
–
1
160
13:19:05.13
-21:02:26.4
0.70
23.54 0.02
+0.05 0.08
23.53 0.06
–0.31 0.33
0.259
–5.94
–6.07
(no WR)
faint
2
H1
13:18:58.05
-21:01:45.9
0.28
23.24 0.35
+0.01 0.35
23.48 0.05
+0.03 0.30
0.258
–6.23
–6.13
HII region
bright
H2
13:18:49.50
-21:01:52.6
0.37
23.38 0.08
–0.07 0.09
23.63 0.03
+0.04 0.07
0.258
–6.10
–5.98
HII region
bright
H3
13:18:57.01
-21:04:25.9
0.69
23.25 0.08
–0.11 0.09
23.29 0.06
–0.02 0.10
0.181
–5.99
–5.95
HII region
bright
H4
13:18:55.75
-21:01:37.0
0.23
21.80 0.08
+0.31 0.08
22.09 0.03
+0.05 0.14
0.259
–7.68
–7.52
HII region
bright
2.3 MOS Spectroscopy
Multi-Object Spectroscopy (MOS) of WR candidates in NGC 5068 was obtained in March-April 2009 using the Gemini Multi-Object Spectrograph (GMOS) at the Gemini-South telescope in Cerro Pachon, Chile.
Since the 4684 and 4781 narrow-band imaging were obtained from the VLT1114684 and adjacent continuum filters were subsequently acquired for Gemini/GMOS, broad-band (g’ filter) pre-imaging was obtained using GMOS to aid the MOS mask design. The field-of-view of GMOS is 5.55.5 arcmin compared to the 6.86.8 arcmin VLT field (Figure 1) hence some of the WR candidates lay beyond the GMOS field. The GMOS field of view was chosen to maximise the number of WR candidates and is overlaid on the VLT field in Figure 1; only six sources were outside the GMOS field.
Three MOS masks were designed using 0.75 arcsec slits and the R150 grating with a dispersion of 3.5 pixel-1. The spectral coverage was typically from 3900–9000 to include all of the WR and nebular diagnostic lines. Data long-ward of 7000 suffered from fringing effects and second order contamination so was unreliable, however this is not a concern as no diagnostic lines lie within this region.
For the first MOS mask (#1) six 430 s exposures were obtained under good seeing conditions which over the duration of the observations was an average of 0.87″. WR candidates included in MOS mask #1 had the brightest 4684–4781 photometric excesses requiring a S/N3–5 for detection. MOS masks #2 and #3 had six longer exposures of 1400 s each, producing a higher signal-to-noise of S/N10 to detect the fainter WR candidates. Seeing conditions for MOS mask #2 were similar to the mask #1, although conditions deteriorated to 1.16 ″ for mask #3.
64 out of the 160 WR candidates were spectroscopically observed, (40%), a similar percentage to the 3 photometrically significant sources (23 from 59 cases). To fill the gaps in the MOS mask design, four H ii regions, identified from our H images were added, allowing nebular properties to be investigated. Additional targets were spectroscopically observed in regions of NGC 5068 where we were unable to identify suitable WR candidates due to the FORS chip gaps, two of which were spectroscopically observed.
Spectroscopic data were reduced and extracted using standard procedures within the Gemini iraf package. Spectra were wavelength calibrated using observations of an internal CuAr arc lamp with each of the three MOS masks. Absolute flux calibrations were achieved from observations of the spectrophotometric standard star LTT 7987 (Hamuy et al., 1994) using the starlink package figaro.
In order to assess the reliability of our photometry we convolved the observed flux calibrated object spectra with the response function of the interference filter used in the narrow-band imaging to determine a spectroscopic magnitude for each source; a comparison of which is shown in Figure 4. Most sources are in reasonable agreement, with the exception of source #17, the mλ4684–mλ4781 excess of 1.12 is inconsistent with the WC subtype determined from spectroscopy (see Section 4.2). This source was included as a candidate following visual inspection of the continuum subtracted image which clearly showed the presence of WR emission, hence photometry for this source is unreliable.

3 Nebular properties
In this section we use our GMOS spectroscopy to derive the nebular properties of H ii regions in NGC 5068, comparing our results with previous estimates. Approximately 30% of our spectroscopy of WR candidates contained nebular lines in addition to the 4 H ii regions that were specifically targeted for this purpose. We performed Gaussian fits to the excited nebular (and stellar) emission lines using the Emission Line Fitting (elf) routine within the starlink package dipso.
3.1 Interstellar Extinction
The interstellar extinction for each source was determined from the observed Balmer line ratios of FHα/FHβ with Case B recombination theory (Hummer & Storey, 1987), assuming ne100 cm-3, Te104 K and a standard Galactic extinction law (Seaton, 1979).
Individual values of E(B–V) are listed for each source in Table 2 and range from just above the foreground extinction at E(B–V) = 0.087 mag to 0.428 mag. The average extinction of E(B–V) = 0.2590.035 mag is applied to all sources for which no spectroscopic value can be derived. Taking into account the underlying Balmer absorption we estimate that the H flux is underestimated by 1–13% based on measured equivalent widths of 15-300 . Ryder (1995) derive similar values of extinction ranging from foreground extinction of E(B–V) = 0.007 mag to E(B-V) = 0.623 mag. The dereddened emission line spectrum of the H ii regions #202 is shown as an example in Figure 5 with all the of the nebular diagnostic lines indicated.

3.2 Metallicity of NGC 5068
Nebular emission lines from H ii regions allow metallicity calculations for NGC 5068. Previously, Ryder (1995) used a combination of long-slit spectroscopy and multi-aperture plate slitlets to obtain spectra of 20 H ii regions within NGC 5068. Using the R23 method (Pagel & Edmunds, 1981) they determined a metallicity gradient of log(O/H)12 = (8.960.12)–(0.350.26)(r/R25), where r/R25 is the deprojected distance from the centre of the galaxy based on R253.62 arcmin for NGC 5068 from de Vaucouleurs et al. (1991). Pilyugin et al (2004) subsequently combined the spectroscopic observations by Ryder (1995) with those from McCall et al. (1985) and re-calculated a metallicity gradient of log(O/H)12 = 8.320.08(r/R25) using the excitation parameter, , rather than from empirical values. This result suggests that the centre of the galaxy is more metal-poor than the outer disk. Only 4 instances of positive gradients were found by Pilyugin et al (2004) from a sample of 54 galaxies. Usually, spiral galaxies have flat or negative metallicity gradients (Zaritsky, Kennicutt & Huchra, 1994), e.g. NGC 7793 (Bibby & Crowther, 2010) and M101(Cedres et al., 2004).
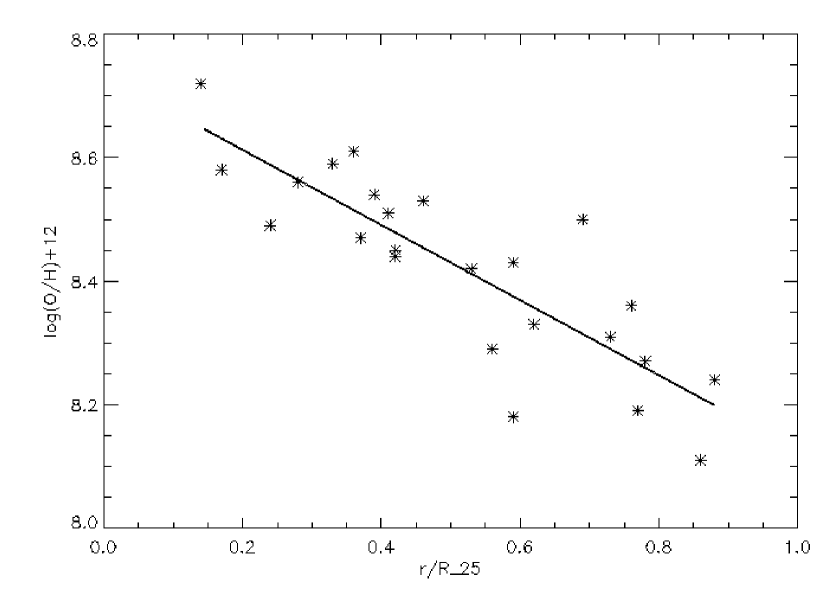
Unfortunately, due to the low S/N of our spectroscopic observations the 4363 [O iii] line is not detected so an accurate temperature, and hence emissivities cannot be calculated. Consequently we are unable to use the weak-lined methods described by Osterbrock (1989) to determine the ionic abundances of H ii regions in NGC 5068; consequently we revert to strong-line methods described by Pettini & Pagel (2004). In addition to the four H ii regions included in our MOS masks, the H, [N ii], H and [O iii] lines required are present in 17 WR spectra. We calculated the [N ii]/H (or N2) and ([O iii]/H)/N2 (or O3N2) line ratios by fitting the nebular emission lines with a Gaussian profile using the Emission Line Fitting routine (elf). The linear relationships of N2 and O3N2 with metallicity from Pettini & Pagel (2004) were used to determine the metallicity of the H ii region, shown in Table 3. Using the gradient function in IDL we fit the average metallicities of the H ii regions and found a metallicity gradient of
for NGC 5068 which is shown in Figure 6. Metallicities range from log(O/H)12 = 8.10 – 8.72 with a central metallicity of log(O/H)12 = 8.74. The central metallicity is lower than that found by Ryder (1995), however the metallicity gradient is consistent within errors indicating that different methods used (R23 versus N2 and O3N2) to derive metallicity may have a systematic offset (Kewley & Dopita, 2002; Kewley & Ellison, 2008). Unfortunately our spectral range does not include the [O ii] 3727 line required for the R23 method, so a full comparison of the two methods cannot be made. Finally, our negative metallicity gradient is inconsistent with the positive gradient found by Pilyugin et al (2004) and their estimate of the central metallicity is 0.4 dex lower than our own.
| Source | r/R25 | I([N ii]) | log(O/H) | I([O iii]) | log(O/H) | log(O/H) |
|---|---|---|---|---|---|---|
| ID | I(H) | + 12 1 | I(H) | + 12 2 | + 12 mean | |
| 10 | 0.78 | 0.07 | 8.26 | 1.53 | 8.27 | 8.27 |
| 12 | 0.76 | 0.10 | 8.32 | 1.40 | 8.39 | 8.34 |
| 21 | 0.77 | 0.07 | 8.25 | 7.06 | 8.13 | 8.19 |
| 45 | 0.73 | 0.07 | 8.24 | 1.13 | 8.38 | 8.31 |
| H2 | 0.37 | 0.13 | 8.39 | 0.47 | 8.58 | 8.49 |
| 54 | 0.53 | 0.15 | 8.42 | – | – | 8.42 |
| 55 | 0.42 | 0.13 | 8.40 | 0.90 | 8.50 | 8.45 |
| 60 | 0.41 | 0.12 | 8.37 | 0.26 | 8.65 | 8.51 |
| 73 | 0.59 | 0.10 | 8.32 | 0.49 | 8.54 | 8.43 |
| 99 | 0.33 | 0.44 | 8.70 | 0.93 | 8.47 | 8.58 |
| 103 | 0.14 | 0.36 | 8.65 | 0.29 | 8.79 | 8.72 |
| 104 | 0.09 | 0.37 | 8.65 | 0.19 | 8.43 | 8.54 |
| 128 | 0.56 | 0.09 | 8.31 | 1.63 | 8.27 | 8.29 |
| 129 | 0.42 | 0.20 | 8.50 | 3.22 | 8.38 | 8.44 |
| 130 | 0.46 | 0.17 | 8.47 | 0.62 | 8.58 | 8.53 |
| 131 | 0.17 | 0.26 | 8.56 | 0.55 | 8.66 | 8.61 |
| H3 | 0.69 | 0.14 | 8.41 | 0.22 | 8.70 | 8.56 |
| 145 | 0.24 | 0.19 | 8.49 | – | – | 8.49 |
| H1 | 0.28 | 0.21 | 8.51 | 0.31 | 8.66 | 8.59 |
| 149 | 0.86 | 0.04 | 8.10 | 4.20 | 8.11 | 8.10 |
| 150 | 0.88 | 0.07 | 8.23 | 2.71 | 8.25 | 8.24 |
| Average | 0.155 | 8.440.17 | ||||
| 1 N2 | ||||||
| 2 O3N2 | ||||||
4 Wolf-Rayet Population
We have identified broad WR emission features in 30 of the 64 sources spectroscopically observed, i.e. only 47% of these candidates are confirmed. Note that these statistics exclude three candidates for which slits were misaligned, as a result of conversion between the FORS1 4684 imaging to the g’ GMOS pre-imaging for the MOS mask design.
Of the remaining spectroscopically observed candidates lacking WR emission features, one is a early B-type star while the others show no stellar features at the low S/N of the observations. Photometrically, the majority of these sources indicated negligible or weak He ii4686 excesses. Indeed, only one (#136) is a firm WR candidate with a 4684 excess of 3, such that 21 of the 22 statistically significant sources were confirmed as Wolf-Rayet stars.
Emission line fluxes of He ii4686 N iii-v4603-4641 for WN stars and C iii4647-4651 C iv5808 for WC stars, are fit with Gaussian profiles using the elf suite within the dipso package. Spectral classification systems by Smith et al. (1996) and Crowther et al. (1998) are used to assign either a WN or WC subtype, respectively. At a distance of 5.45 Mpc we cannot spatially resolve individual WR stars. We therefore adopt the luminosity calibrations derived by Crowther & Hadfield (2006), which are based on average line luminosities for single WR stars in the Large Magellanic Cloud (LMC), to determine the number of WN and WC stars in each source. LMC templates are used in view of the metallicity of NGC 5068 obtained in Section 3. Table 4 records the line fluxes and luminosities for each WR source, the classification assigned and the the number of WR stars present in that region.
| Fλ( erg s-1 cm-2) | Lλ( erg s-1 ) | ||||||||||
| ID | E(B-V) | F(N v-iii) | F(C iii) | F(He ii) | F(He ii) | F(C iii) | F(C iv) | L(He ii) | L(C iv) | WR | N(WR) |
| 4603-4641 | 4647-4651 | 4686 | 5411 | 5696 | 5808 | 4686 | 5808 | Subtype | |||
| 6 | 0.247 | – | – | 3.51 | 0.30 | – | – | 2.96 | – | WN4–6 | 2 |
| 10 | 0.428 | – | 1.07 | – | – | – | 1.62 | – | 1.79 | WC4–5 | 1 |
| 12 | 0.284 | – | 2.04 | – | – | – | 3.08 | – | 2.32 | WCE | 1 |
| 13 | 0.465 | – | – | – | – | – | 1.66 | – | 2.02 | WCE(?) | 1 |
| 17 | 0.230 | – | 1.05 | – | 2.04 | – | 10.2 | – | 6.67 | WC4–5 | 2 |
| 19 | 0.259 | – | 4.70 | – | – | – | 5.05 | – | 3.56 | WC | 1 |
| 21 | 0.595 | – | – | 1.36 | – | – | – | 3.88 | – | WNE(?) | 2 |
| 35 | 0.259 | – | 11.1 | – | – | – | 8.53 | – | 6.01 | WCE | 2 |
| 39 | 0.259 | – | – | 0.59 | – | – | – | 0.52 | – | WN | 1 |
| 43 | 0.259 | – | – | 5.00 | 1.59 | – | 0.76 | 4.40 | 5.36 | WN5b | 3 |
| 59 | 0.259 | – | 3.74 | – | – | – | – | – | – | WCpec? | ? |
| 65 | 0.259 | – | 14.9 | – | – | 0.70 | 9.29 | – | 6.55 | WC6 | 2 |
| 78 | 0.259 | – | – | 1.88 | – | – | – | 1.65 | – | WN6 | 1 |
| 84 | 0.259 | – | 12.8 | – | – | – | 5.98 | – | 4.22 | WC4–5 | 1 |
| 90 | 0.259 | – | 10.9 | – | – | – | 8.86 | – | 6.25 | WC4–5 | 2 |
| 93 | 0.170 | – | – | 3.39 | – | – | – | 2.18 | – | WNE | 1 |
| 94 | 0.259 | – | 8.67 | – | – | 1.23 | 3.48 | – | 2.46 | WC7 | 1 |
| 99 | 0.259 | 0.80 | – | 5.36 | 0.99 | – | – | 4.62 | – | WN6 | 3 |
| 104 | 0.147 | – | – | 3.86 | – | – | – | 2.29 | – | WN(?) | 1 |
| 106 | 0.087 | 0.56 | – | 2.54 | – | – | – | 1.22 | – | WN7 | 1 |
| 111 | 0.259 | – | – | 1.77 | – | – | – | 1.56 | – | WNL | 1 |
| 112 | 0.102 | – | 1.62 | – | – | – | 2.60 | – | 1.21 | WC | 1 |
| 125 | 0.259 | – | 12.1 | 1.53 | – | – | 5.85 | 1.34 | 4.12 | WC | 1 |
| 128 | 0.259 | – | 4.59 | – | – | – | 3.04 | – | 2.14 | WC4–5 | 1 |
| 131 | 0.180 | – | 2.35 | 0.55 | – | – | 1.12 | 0.36 | 0.64 | WC4 | 1 |
| 133 | 0.259 | – | 5.67 | – | – | – | 2.73 | – | 1.93 | WC4 | 1 |
| 134 | 0.181 | – | 8.90 | – | – | – | 19.3 | – | 11.1 | WC4 | 3 |
| 145 | 0.259 | – | 0.85 | – | – | 0.69 | 4.12 | – | 2.90 | WC6 | 1 |
| 149 | 0.125 | – | – | 2.71 | – | – | 1.51 | 1.49 | 0.75 | WNE | 1 |
| 150 | 0.259 | – | 9.81 | – | – | – | 5.94 | – | 4.19 | WC4–5 | 1 |
| 151 | 0.259 | – | – | 1.63 | 0.24 | – | 0.35 | 1.43 | 0.25 | WNE | 1 |
4.1 WN stars
Twelve of the 30 sources confirmed reveal the characteristic signature of WN stars. If N v-iii4603–4641 is detected then its strength relative to the He ii 4686 emission line is used to assign a refined classification of WN6 or WN7. For those WN stars where N v-iii4603–4641 was not detected we assume a WNE subtype. Mid-type WN4–6 classifications are used when both He ii4686 and He ii5411 are detected. In one case we classify the WR source as WN5b since the WR emission features are much broader than typical WR stars. In total, we identify 18 WN stars in the 12 sources. Figure 7a) shows the observed WN spectra of source #99, which hosts two WN5-6 stars. The template spectra, shown by the dashed line, are taken from Crowther & Hadfield (2006). The He ii4686, 5411 and N iii4641 WR emission lines are marked while the additional narrow lines are nebular emission lines.
4.2 WC stars
We identify strong blue and red emission WC features for 18 of the 30 sources spectroscopically confirmed as WR stars. Following the classification of Crowther et al. (1998) we use the C iii5696/C iv5808 ratio to refine the subtype of the WC stars. We find that WC4–5 stars dominate the WC population, with no C iii5696 detected in the stellar spectrum, as is the case in other relatively metal-poor galaxies. A typical example is presented in Figure 7b together with an LMC WC4 template (Crowther & Hadfield, 2006). These are used to determine the number of WC stars in each region, with most regions hosting a single WC star. In total, we identify 24 WC stars in the 18 sources exhibiting WC emission.
In addition to the 30 confirmed WR sources, broad emission at 4660 is seen in source #59, which we attribute to either C iii4650, C iv 4660 or He ii 4686, as indicated in Figure 8. However, neither C iv5808 nor C iii5696 is observed, from which we assign a WC?pec spectral type, but do not attempt to quantify the number of WR stars.


5 H Imaging
We have obtained narrow-band 6563 (H) and adjacent continuum images using VLT/FORS1 to derive the total O star population and SFR of NGC 5068. Images were absolutely flux calibrated using the spectrophotometric standard star LTT 7987 (Hamuy et al., 1994) obtained on the same night as the science observations. The 6563 observations are contaminated by the [N ii]6548,6583 doublet which can account for as much as 30% of the total emission in metal-rich regions. Our spectroscopic observations of H ii regions resolve the H and [N ii] lines finding on average [N ii]/H = 0.155 (Table 3) which we applied to our measured 6563 fluxes. We corrected the H fluxes for extinction using measured values where possible, otherwise applying the average E(B–V) = 0.259 mag, before calculating the final H luminosities adopting a distance of 5.45 Mpc (Herrmann et al., 2008).
5.1 Star Formation Rate
The star-formation rate of the galaxy was found by placing a circular aperture with a diameter of 6.5 arcmin over the entire galaxy in our VLT/FORS1 field of view using the starlink package gaia. This observed H flux was corrected for [N ii] emission ([N ii]/H=0.155) and extinction (E(B-V)=0.259 mag) producing a total H luminosity of 5.681040 erg s-1. Following the relations of Kennicutt (1998) the corrected H flux luminosity was used to calculate the number of ionising photons, from which the SFR of the galaxy is inferred. The VLT/FORS1 images of NGC 5068 suggest a SFR = 0.45 M⊙yr-1, excluding the H emission which lies in the CCD chip gap and also extended emission beyond our field of view.
Table 5 shows a comparison of our analysis with previous work. The result from Ryder et al. (1994) is substantially higher than the other estimates, but unfortunately no observed flux measurements are available so no further comparison with this result can be made. In addition, the observations of Hodge (1974) are consistent with our estimate, however, they only observe the inner part of the galaxy and again no measured fluxes are available for comparison. We include both of these results in Table 5 only for completeness. The flux measurements of Kennicutt et al. (2008) are the most complete since the 13 arcmin2 field of view, which is double our own, contains all the H emission from the galaxy. The SFR they derive is 0.53 M⊙yr-1, however they only correct for foreground extinction, and find a larger [N ii]/H contribution of 0.209 which was estimated using empirical scaling relation since no direct observations were available.
The H flux from the archival CTIO images of NGC 5068 used by Kennicutt et al. (2008) exceeds our measurements by 30%, which is unsurprising considering the smaller field of view and detector gaps in our VLT images. Therefore, we adopt the observed flux from Kennicutt et al. (2008) of F(H+[N ii]) = 1.4810-11erg s-1 cm-2. Since [NII]/H decreases with metallicity from the metal–rich inner disk to the metal–poor outer disk, we correct for three separate values of [N ii]/H at r/ R25 = 0–0.28, 0.29–0.69, 0.70–1. Using the measured values of [N ii]/H from sources listed in Table 3 we find the average [N ii]/ H value within each r/ R25 range, resulting in [N ii]/ H = 0.28, 0.17, and 0.08, from the inner to outer disk, respectively. We find a F(H) = 1.2210-11erg s-1 cm-2 and calculate total a H luminosity of 7.931040 erg s-1 for NGC 5068, after correction for the [N ii] emission and average extinction from our GMOS spectroscopy. This corresponds to a global SFR = 0.63 M⊙yr-1 adopting the Kennicutt (1998) calibration. The errors on the SFR are derived from the errors on E(B-V) and on the distance of NGC 5068 from Herrmann et al. (2008).
| Work | F(H | [N ii] | E(B-V) | D | L(H) | log(Q0) | N(O7 v) | SFR |
| +[N ii]) | H | Mpc | s-1 | M⊙ yr-1 | ||||
| This work | 1.04 | 0.155 | 0.259 | 5.45 | 5.68 | 52.62 | 4200 | 0.45 |
| K08 | 1.48 | 0.209 | 0.090 | 6.20 | 6.61 | 52.69 | 4900 | 0.53 |
| Inner1 | 0.23 | 0.28 | 0.259 | 5.45 | 1.07 | 51.90 | 800 | 0.09 |
| Middle2 | 1.04 | 0.18 | 0.259 | 5.45 | 5.53 | 52.62 | 4200 | 0.45 |
| Outer3 | 0.21 | 0.08 | 0.259 | 5.45 | 1.26 | 51.97 | 900 | 0.10 |
| Total | 1.48 | 7.93 | 52.77 | 5900 | 0.63 | |||
| Ryder et al. (1994) | 3.0 | |||||||
| Hodge (1974) | 0.35 | |||||||
5.2 O Star Population
The H luminosity of 7.931040 erg s-1 equates to 6000 O7 v stars, assuming an ionising flux Q0 = 1049 ph s-1 for a typical O7 v star in a low metallicity environment (Vacca, 1994). However, in reality not all of the O stars will be O7 dwarfs but will span the entire spectral range. Starburst models by Schaerer & Vacca (1998) can be used to estimate the true number of O stars for a given age, , using the parameter . Unfortunately the spiral arms of NGC 5068 undergo continuous star-formation and hence the age could range from 3–10 Myr, the lifetime of O stars. Consequently we follow Bibby & Crowther (2010) who used the 30 Doradus region of the LMC, and the SMC, as proxy to determine a uniform correction factor of N(O)/N(O7 v)1.5, suggesting a total O star population of 9000.
Hodge (1974) identified 83 H ii regions in NGC 5068, including some giant H ii regions (GHR), formally defined as regions in which Q0 exceeds 1050 photon s-1 (Conti et al., 2008). A catalogue of the 29 brightest H ii regions in NGC 5068 is presented in Table 6. The observed H flux within a given diameter, dap, has been continuum subtracted, corrected for the contribution of [N ii], plus an average NGC 5068 extinction unless this has been individually measured (see Section 5). From the list of H ii regions in Table 6, 17 qualify as GHR, albeit these are dependent upon extinction and distance uncertainties. Note that NGC 5068 hosts three very bright H ii regions, which each host over 100 equivalent O7 dwarfs, reminiscent of the brightest H ii regions in the Milky Way (e.g. NGC 3603), albeit somewhat more modest in ionizing output than the 30 Doradus region of the LMC (Kennicutt, 1984).
Mindful that Table 6 may be incomplete due to the detector gap in the FORS1 images, we inspected the archival H CTIO images of Kennicutt et al. (2008) but found that no substantial H ii regions were present in this region.
Table 6 provides cross matches to the catalogue of Hodge (1974), and also indicates which bright H ii regions host WR candidates. 20% of the WR candidates lie within the most prominent H ii regions, although considering the entire 160 candidate list, 50% lie within bright (compact) H ii regions, 25% are associated with faint (diffuse) nebulosity, and 25% are not associated with any H ii region (Table 2).
| ID | RA | Dec | dap | F(H) | E(B-V) | L(H) | log(Q0) | N(O7 v) | Hodge | WR |
|---|---|---|---|---|---|---|---|---|---|---|
| HII #1 | 13:18:42.8 | -21:01:24 | 5 | 19.1 | 0.259 | 12.3 | 50.96 | 91 | H82 | – |
| HII #2 | 13:18:44.5 | -21:01:14 | 5 | 1.72 | 0.259 | 1.11 | 49.92 | 8 | H79 | – |
| HII #3 | 13:18:44.8 | -21:00:51 | 4 | 1.48 | 0.259 | 0.96 | 49.85 | 7 | H77 | 11 |
| HII #4 | 13:18:45.8 | -21:02:31 | 5 | 4.28 | 0.259 | 2.77 | 50.31 | 20 | H73 | 14,16 |
| HII #5 | 13:18:47.0 | -21:00:50 | 5 | 1.69 | 0.259 | 1.09 | 49.91 | 8 | H86 | – |
| HII #6 | 13:18:47.1 | -21:00:34 | 3 | 0.76 | 0.595 | 1.07 | 49.90 | 9 | 21 | |
| HII #7 | 13:18:47.3 | -21:03:53 | 6 | 3.18 | 0.259 | 2.05 | 50.18 | 15 | 23,26 | |
| HII #8 | 13:18:48.0 | -21:03:11 | 4 | 1.63 | 0.259 | 1.05 | 49.89 | 8 | H65 | – |
| HII #9 | 13:18:48.1 | -21:00:49 | 7 | 16.9 | 0.259 | 10.9 | 50.91 | 81 | H60 | 34,36 |
| HII #10 | 13:18:48.5 | -21:00:17 | 4 | 1.75 | 0.259 | 1.13 | 49.92 | 8 | H59 | 40 |
| HII #11 | 13:18:49.0 | -21:00:22 | 4 | 4.08 | 0.259 | 2.64 | 50.29 | 20 | H54 | 41 |
| HII #12 | 13:18:49.3 | -21:00:23 | 4 | 4.98 | 0.259 | 3.22 | 50.38 | 24 | H50 | 45 |
| HII #13 | 13:18:49.8 | -21:02:29 | 5 | 4.28 | 0.259 | 2.77 | 50.31 | 20 | H48 | 52,53,56 |
| HII #14 | 13:18:49.9 | -21:03:23 | 10 | 28.2 | 0.259 | 18.3 | 51.13 | 135 | H49 | 49,55,58,60 |
| HII #15 | 13:18:50.7 | -21:02:06 | 5 | 1.39 | 0.259 | 0.90 | 49.82 | 7 | H42 | 69,70 |
| HII #16 | 13:18:51.3 | -21:04:09 | 5 | 3.22 | 0.259 | 2.08 | 50.19 | 15 | H40 | 73,75,76 |
| HII #17 | 13:18:51.7 | -21:01:18 | 5 | 7.16 | 0.259 | 4.63 | 50.53 | 34 | 78 | |
| HII #18 | 13:18:51.8 | -21:00:50 | 4 | 1.86 | 0.259 | 1.20 | 49.95 | 9 | H36 | 81 |
| HII #20 | 13:18:53.2 | -21:02:45 | 4 | 2.72 | 0.259 | 1.76 | 50.12 | 13 | H33 | 103 |
| HII #21 | 13:18:54.7 | -21:03:10 | 7 | 4.34 | 0.259 | 2.81 | 50.32 | 21 | H29 | 116 |
| HII #22 | 13:18:54.9 | -21:04:04 | 4 | 2.94 | 0.259 | 1.32 | 49.99 | 10 | 121 | |
| HII #23 | 13:18:55.2 | -21:02:42 | 4 | 1.95 | 0.259 | 1.26 | 49.97 | 9 | – | |
| HII #24 | 13:18:56.7 | -21:00:33 | 4 | 1.53 | 0.259 | 9.87 | 49.86 | 7 | H14 | – |
| HII #25 | 13:18:56.8 | -21:04:13 | 4 | 5.18 | 0.181 | 2.79 | 50.32 | 21 | 134 | |
| HII #27 | 13:18:57.3 | -21:00:47 | 15 | 29.1 | 0.259 | 18.8 | 51.14 | 139 | H13 | 139 |
| HII #28 | 13:18:58.2 | -21:02:28 | 4 | 2.72 | 0.259 | 1.76 | 50.11 | 13 | 145 | |
| HII #30 | 13:18:59.2 | -21:00:06 | 4 | 1.20 | 0.259 | 0.78 | 49.76 | 6 | H10 | – |
| HII #31 | 13:19:00.8 | -21:02:47 | 9 | 3.21 | 0.259 | 20.8 | 51.19 | 154 | H7 | 152 |
| HII #32 | 13:19:03.1 | -21:01:00 | 4 | 1.51 | 0.259 | 0.98 | 49.86 | 7 | H2 | – |
6 The Global WR Population of NGC 5068
The spectroscopic observations of 30 WR candidates identifies 18 WN stars and 24 WC stars in NGC 5068. We use the photometric properties of these confirmed WR stars to infer the likelihood that the remaining WR candidates are indeed true WR stars, and in some cases assess their WR subtype. In addition we take account of the detection limits and photometric completeness of our survey to derive the global WR population of NGC 5068.
6.1 Nature of the Remaining Candidates
In section 2.3 we established that our photometric and spectroscopic 4684 excesses were in good agreement (recall Figure 4). Therefore, we can assess the nature of the remaining candidates based upon the properties of our confirmed WR sources. Figure 9 compares the photometric m4684–m4781 excess against the absolute 4684 magnitude of the WR candidates identified in the VLT/FORS1 imaging. Those candidates, which have a spectroscopically determined subtype are plotted accordingly, while those candidates for which spectroscopy was not obtained are plotted by the open triangles and the non-WR sources are marked with an “x”.
In addition to the sources plotted in Figure 9 there are 3 confirmed WC, 2 confirmed WN sources and 25 additional non-WR sources which do not possess photometry in one or both filters. Photometry for such sources is not available if the source is extended, in a crowded region, or too faint in the 4781 observation.
As a result of their strong emission lines, WC stars have significantly larger photometric 4684 excesses relative to WN stars(Conti & Massey, 1989). Our spectroscopic observations reflect this, since all sources with 4686 excesses of at least –1.5 mag are spectroscopically confirmed as WC stars, as indicated in Figure 9. Consequently, we can fairly reliably infer that the remaining 5 WR candidate regions with equally large 4684 excesses also host WC stars.
In order to estimate the number of Wolf-Rayet stars for each photometric candidate, we convert , and magnitudes into fluxes, and estimate emission line fluxes by subtracting from , and then follow the same approach as for the spectroscopic datasets. We have compared photometric and spectroscopic 4603/4650/4686 fluxes for 24 sources in common, and find spectroscopic fluxes are typically 50% higher. In part, this arises from the relatively narrow FWHM of the 4684 bandpass with respect to broad WR emission (e.g. FWHM55 for #112). Therefore, photometric flux estimates should provide useful lower limits to the WR population of each source.
For the spectroscopically observed candidates with photometric excesses between –0.6 and –1.5 mag, all are confirmed except in one instance, so these too are likely to host WR stars. It is less straightforward to assign a WN or WC subtype to these candidates since they overlap in 4684 excesses since the stellar continua from other stars dilute the WR emission lines, resulting in smaller excesses; this is discussed further in Section 6.2. Still, since WN subtypes possess intrinsically weak emission, they are more likely to correspond to the faintest sources with modest excesses.
Therefore, we assign a photometric WN subtype for sources fainter than , and photometric WC subtypes otherwise. For the spectroscopic sources with weaker excesses below 0.6 mag, only a small percentage (20%) were confirmed as genuine WR stars. Therefore, for such stars to be considered as a photometric WR star we require a photometric m4684–m4781 excess of at least 3, plus a excess in 4686 with respect to the -band. Such stars are most likely to be WN subtypes, except for the very brightest sources with mag.
In total, we estimate an additional 43 WN stars to the 18 spectroscopically identified, plus an additional 11 WC stars to the 24 obtained from spectroscopy, i.e. 61 WN and 35 WC stars in total.
In addition to photometric sources, 17 candidates without photometric information have yet to be incorporated. From the 7 such cases spectroscopically observed, 5 were confirmed as WR stars, so we shall assume that a similar fraction (12 from 17) of the candidates are genuine WR stars. However, we do not attempt to discriminate between WN or WC subtypes. Our estimate for the grand total of WR stars in NGC 5068 is therefore 110, with N(WN)/N(WC)1.7.

6.2 Completeness
From our 160 candidate WR sources in NGC 5068 we have estimated a global total of 110 WR stars. However, in order to assess the true WR population we must assess how many WR stars were not detected due to the limiting magnitudes our images.
The detection limits plotted as the dashed (100%) and solid (50%) lines in Figure 9 represent the depth of our FORS1 imaging based on the magnitude of all the objects detected in the image (including non-WR sources). The 4684 magnitude range of objects was 16–27 mag with the turnover of the distribution at 24.0 mag corresponding to a 100% detection limit of M4684 =–5.4 mag for an average extinction of E(B–V) = 0.259 mag and distance of 5.45 Mpc.
The main uncertainty on the assessing completeness of a global WR population is identifying unresolved regions hosting WR stars. While relatively isolated and resolved WR sources are easily identified from narrow–band imaging, unresolved regions hosting multiple early-type stars can dilute the WR emission and hide the WR source completely. How many candidates we did not detect due to dilution?
Bibby & Crowther (2010) derived the total completeness of their WR study of NGC 7793 from comparison with the complete WR population of the LMC by tracing how the 4684 emission from a representative sample of LMC WR stars would be diluted if the spatial resolution of the LMC images were the same as their NGC 7793 imaging (1.3″20 pc). By applying the detection limits of the narrow-band imaging to the diluted LMC sample they estimated the percentage of the known LMC WR stars that would not have been detected.
The larger distance of 5.45 Mpc to NGC 5068 together with an improved spatial resolution of 0.8′′ combine to produce a similar physical scale of 20 pc. This is presented in Fig. 10, from which we estimate that 85% of the WR stars in the LMC would be detected in our survey, based on the detection limits and spatial resolution of our narrow–band images, indicating a global WR population of 130.
Overall, since WC stars have a stronger excess relative to WN stars it is likely that we are close to 100% complete in WC stars in NGC 5068. Early–type WN stars (WNE) have larger excesses than late–type WN stars (WNL), but are significantly fainter visually, so we expect to be missing a significant percentage of WNE stars, but also be relatively complete in WNL stars. However, the diluted photometric excesses of 4 out of the 15 representative WR stars were 0.3 mag and fainter than = –7 mag (Figure 10.) Some such faint, weak excess sources – primarily WNE stars – will have been included in our catalogue, but would most likely be listed under “no WR” since they are not photometrically statistically significant. Indeed we see several examples of such sources in our survey such as Source #28, which is a genuine WNE star with an excess of only 0.18 mag and M4684 = –6.53 mag. Our survey of WNE stars is almost certainly incomplete from the persepective that the large excesses, which enable us to identify these faint stars, are diluted leaving only a faint excess which is hard to detect from ground–based images. Therefore, we predict a global WR population of 170 for NGC 5068 due to incompleteness for the faintest 25% of WR stars.

6.3 Predicted WR population
In Section 5.2 we used the SFR of the galaxy to determine that there were 9000 O stars in NGC 5068. We can use this information to infer the expected number of WR stars based on empirical values and independently assess the completeness of our survey. The ratio of WR to O stars varies with metallicity, as a result of the metallicity dependence of winds from massive stars, ranging from 0.03 in the LMC to 0.15 in the Solar neighbourhood (Crowther, 2007). The average metallicity we find for NGC 5068 is log(O/H)12 = 8.440.17 (recall Table 3), similar to the LMC, so assuming a similar WR to O ratio for NGC 5068 we would anticipate a WR population of 270 based upon its O star population of 9000.
If the WR population of NGC 5068 is 270, our earlier estimate is 40% incomplete. One possible explanation is that the percentage of weak-lined, faint WN stars could be considerably higher relative to other WR subtypes, as indeed is the case in the LMC. Ideally, deep, high resolution (space–based) imaging of NGC 5068 would be required, together with further follow-up spectroscopy to confirm this.
7 Comparison to NGC 7793
WR surveys beyond the local group have been undertaken on several nearby, spiral galaxies (e.g. Crowther & Hadfield (2006), Hadfield & Crowther (2007), Bibby & Crowther (2010)). The survey of NGC 7793 by Bibby & Crowther (2010) is an ideal galaxy with which to compare NGC 5068 given their similar physical properties.
NGC 7793 is a Sculptor group SA(s)d galaxy which is slightly nearer to us at 3.91 Mpc (Karachentsev et al., 2003) than NGC 5068. Basic properties of each galaxy are presented in Table 7 which shows that although the galaxies have similar physical sizes and central metallicities, the abundance gradient of NGC 5068 is nearly twice as steep as NGC 7793. We note that both studies use the N2 and O3N2 calibrations so are subject to the same systematic errors hence a comparison of H ii region abundances is not biased.
Also included in Table 7 is a comparison of their star formation rates, with NGC 5068 50% higher than NGC 7793. A similar number of WC stars have been spectroscopically confirmed in both galaxies, and although a smaller fraction of WN have been observed in NGC 5068 its WR population is anticipated to be 40% higher.
| Name | NGC 7793 | NGC 5068 |
|---|---|---|
| Hubble Type | SA(s)d | SB(d) |
| Distance (Mpc) | 3.91a | 5.45b |
| R25 (arcmin) | 4.65c | 3.62c |
| R25 (kpc) | 5.3c | 5.7c |
| SFR (M) | 0.45 | 0.63 |
| log(O/H)+12central | 8.61 | 8.74 |
| Gradient (dex kpc-1) | –0.07 | –0.11 |
| log(O/H))+12mean | 8.40 | 8.44 |
| N(O7V) | 4200 | 6000 |
| N(O) | 6250 | 9000 |
| WR candidates | 74 | 160 |
| Spectra obtained | 53% | 42% |
| N(WN)spect | 27 | 18 |
| N(WC)spect | 25 | 24 |
| N(WR)total | 105 | 170 |
| N(WR)/N(O) | 0.017 | 0.019 |
| aKarachentsev et al. (2003), bKarachentsev et al. (2007), | ||
| cde Vaucouleurs et al. (1991) | ||
7.1 Comparison with evolutionary models
Evolutionary models of massive stellar populations (Eldridge & Vink, 2006; Meynet & Maeder, 2005) predict a correlation in the WR/O star and WC/WN star ratios as a function of metallicity, which has been confirmed by observations of Local Group galaxies (Massey, 1996).
Figure 11 compares the empirical N(WR)/N(O) ratio of different galaxies at a range of metallicities with evolutionary predictions from Eldridge & Vink (2006) and Meynet & Maeder (2005). The single and binary models of Eldridge & Vink (2006) which include metallicity dependent WR winds are a somewhat better overall match to the observed data than the single star predictions from Meynet & Maeder (2005). However, neither model is successful in tracing the N(WR)/N(O) ratio with both appearing to overestimate the number of WR stars, for example N(WR)/N(O) = 0.019 for NGC 5068 (similar to NGC 7793) is lower than both sets of predictions. However, as discussed above, if we have underestimated the early-type WN population, which contribute 50% of the WR stars in the LMC, then the ratio could readily be as high as N(WR)/N(O)0.03 which would be in good agreement with theoretical predictions of Eldridge & Vink (2006).

8 The Spatial Distribution of WR Stars
Different core-collapse supernova (ccSN) subtypes appear to be located in different regions of their host galaxies. For example, Type II SNe, whose progenitors have been identified as red supergiants (RSG) (See Smartt (2009) for review), are found to follow the distribution of the host galaxy light whereas Type Ib, and more so Ic SNe, are preferentially located in the brightest regions (Fruchter et al., 2006; Kelly et al., 2008). Indeed, there is apparently no association between Type II SNe and H ii regions according to Anderson & James (2008), whereas Type Ib and especially Ic SNe are intimately associated with bright H ii regions. In addition, recent work by Modjaz et al. (2011) has revealed that Type Ic SNe are located in more metal–rich regions than Type Ib SN. If WN and WC stars are indeed the progenitors of Type Ib and Ic SNe, respectively, then they should follow similar distributions.
We use a broad-band image of NGC 5068 from the Digitized Sky Survey (DSS) since the chip gap in our VLT/FORS1 images would cause the light distribution of the galaxy to be non-uniform. We subtract all the foreground stars before degrading the image, to mimic the spatial resolution of the SDSS galaxies used in Kelly et al. (2008), and remove all the background light (Leloudas et al., 2010). Although we can assess the likely WR nature of the remaining WR candidates we only consider the spatial distribution of spectroscopically confirmed WN and WC stars that have been detected above the 3 level.
Using an IDL routine we obtain the fractional flux at the location of each WR star as a function of the number of stars. This is presented in Figure 12. In addition, we performed a KS-test to assess the probability that two distributions were from the same parent population; the results of each comparison are presented in Table 8.
From an initial visual inspection, the distribution of the WN stars appear to be most consistent with the distribution of the Type II SNe in the brightest and faintest 30% of the galaxy but lie inbetween the Type Ib and Ic-bl SNe distributions in the moderately bright regions (30%–70% fractional flux). The results from the KS–test are consistent with the qualitative analysis and show that the WN stars in NGC 5068 are most likely to be the parent population of Type Ib and Type II SNe, but does not rule out WN stars as the progenitors of Type Ic-bl SNe.
One possible explanation for the deviation of the WN from the Type Ib/c distributions in brighter regions is that, WNE stars with low 4686 excesses are extremely difficult to detect in bright regions at low spatial resolution as discussed in Section 6.2. A deep, high spatial resolution imaging survey may reveal a faint WNE population, in brighter regions, shifting the distribution and making it more consistent with the Type Ib SN distribution in the brightest regions.
The KS-test of the WC distribution, like the WN distribution, is most representative of the Type Ib distribution, which is consistent with a visual inspection. Again, the distribution deviates in the brightest 20% of the galaxy, suggesting that incompleteness also plays a, albeit smaller, role for the WC population. Classically, we would expect the WC distribution to be most consistent with the Type Ic distributions, whereas the result presented here indicates that WC stars are possible progenitors of Type Ib SNe as suggested by (Georgy et al., 2009).
Note that both the WN and WC distributions do not favour a single ccSNe distribution across the entire fractional flux range. It is plausible that the WN-Type Ib and WC-Type Ic connections deviate from a one-to-one correlation, such that some WN and WC stars may produce Type II and Type Ib SNe, respectively.
However, we admit that the results presented in this section are based on small number statistics and to achieve a more significant result we require spectroscopic confirmation of the remaining WR candidates listed in Table 2, together with other on-going WR galaxy surveys.
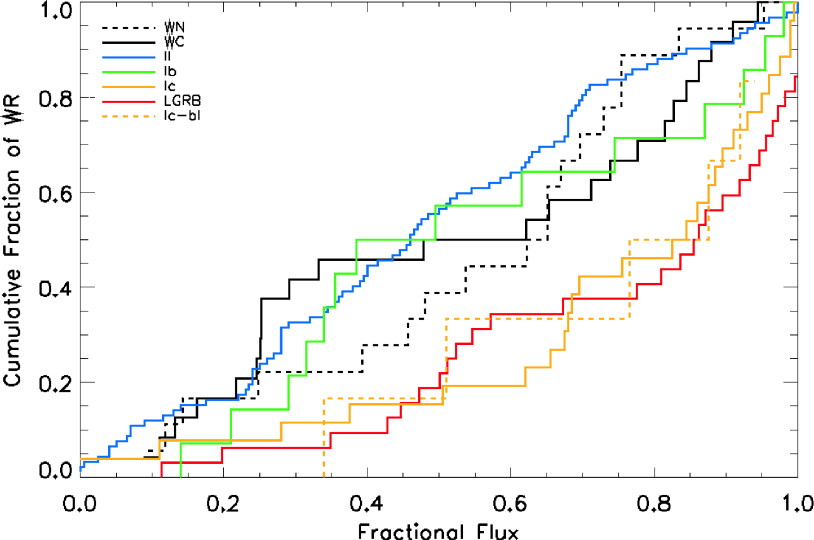
| WC | Type II | Type Ib | Type Ic | Type Ic-bl | LGRB | |
|---|---|---|---|---|---|---|
| WN | 0.460 | 0.417 | 0.512 | 0.033 | 0.361 | 0.004 |
| WC | – | 0.368 | 0.585 | 0.070 | 0.444 | 0.044 |
9 Summary
We present results from our VLT/FORS1 imaging and Gemini/GMOS spectroscopic survey of the WR population in the nearby star-forming galaxy NGC 5068.
From our VLT/FORS1 narrow-band 4684 imaging we have identified 160 emission line regions, for which we have obtained photometry. We obtained follow-up Gemini/GMOS spectroscopy of 67 of our photometric candidates, of which only 22 exhibited statistically significant 4684 excesses, while 5 were not detected in the 4781 continuum image. Wolf-Rayet emission lines were identified in 30 candidates, of which 21 were statistically significant. Based on line luminosity calibrations based on LMC Wolf-Rayet stars we spectroscopically confirmed 18 WN and 24 WC stars.
From comparison of the photometric properties of our confirmed WR stars with the remaining candidates we infer the presence of at least an additional 11 WC stars, 43 WN stars and approximately 12 WR stars of unknown subtype, bringing the total to 120 Wolf-Rayet stars. A comparison with the LMC WR stars degraded to a spatial resolution of 20 pc suggests that our imaging is fairly complete, although faint WR sources with intrinsically small m4684–m4784 excesses, from which we estimate a global WR population of 170 in NGC 5068.
Our spectroscopy enables us to re-derive the metallicity gradient of NGC 5068 using a combination of strong line methods. We find
revealing a strong metallicity gradient, contrary to the positive gradient found by Pilyugin et al (2004).
Nebular spectroscopy revealed [N ii]/H = 0.155 which we applied to the published H flux of Kennicutt et al. (2008) to reveal a SFR0.63 M⊙yr-1, revealing an O star population of 9000, and N(O)/N(WR)0.019 based on N(O)/N(O7V)1.5. A comparison between our census of NGC 5068 and the survey of NGC 7793 by Bibby & Crowther (2010) reveals that evolutionary predictions may overestimate the N(WR)/N(O) ratio for both galaxies by 50%, unless we have significantly underestimated the fraction of faint, weak excess Wolf-Rayet stars.
Finally, we assess the location of our spectroscopically confirmed WN and WC stars within NGC 5068 relative to the galaxy light and compare the distributions with those of different subtypes of ccSNe. We find that both WN and WC stars are most consistent with the Type Ib ccSNe distribution, however both distributions, particularly WN stars, are more consistent with the Type II distribution in the brightest regions. However, for the WN stars this could be explained by the missing weaker WNE stars which would remain undetected in brighter regions.
Acknowledgments
The authors thank the anonymous referee for careful reading of the manuscript and for suggestions which helped to improve the quality of the paper. JLB acknowledges financial support from STFC and also ongoing support from Hilary Lipsitz. Data presented in this paper are based on observations made with ESO Telescopes at the Paranal Observatories under programme ID 081.B-0289 and observations obtained at the Gemini Observatory, under program ID GS-2009A-Q-20, which is operated by the Association of Universities for Research in Astronomy, Inc., under a cooperative agreement with the NSF on behalf of the Gemini partnership: the National Science Foundation (United States), the Science and Technology Facilities Council (United Kingdom), the National Research Council (Canada), CONICYT (Chile), the Australian Research Council (Australia), Ministério da Ciência e Tecnologia (Brazil) and Ministerio de Ciencia, Tecnología e Innovación Productiva (Argentina).
References
- Anderson & James (2008) Anderson, J.P., James, P.A., 2008, MNRAS, 390, 1527
- Bibby & Crowther (2010) Bibby J.L., Crowther P.A., 2010, MNRAS, 405, 2737
- Cedres et al. (2004) Cedres, B., Urbaneja, M.A., Cepa J., 2004, A&A, 422, 511
- Conti et al. (2008) Conti, P.S., Crowther P.A., Leitherer C., 2008, From Luminous Hot Stars to Starburst Galaxies. Cambridge University Press
- Conti & Massey (1989) Conti, P.S., Massey, P. 1989, ApJ, 337, 251
- Crockett et al (2007) Crockett R.M., Smartt S.J., Eldridge J.J., Mattila S., Young D.R., Pastorello A., Maund J.R., et al., 2007, MNRAS, 381, 835
- Crowther (2007) Crowther P.A, 2007, ARA&A, 45, 177
- Crowther et al. (1998) Crowther P.A., De Marco O., Barlow M.J., 1998, MNRAS, 296, 367
- Crowther & Hadfield (2006) Crowther P.A., Hadfield L.J., 2006, A&A, 449, 71
- de Vaucouleurs et al. (1991) de Vaucouleurs G., de Vaucouleurs A., Corwin Jr.H.G., Buta R.J., Paturel G., Fouque P., 1991, Third Reference Catalogue of Bright Galaxies. Springer-Verlag Berlin Heidelberg New York
- Eldridge & Vink (2006) Eldridge J.J., Vink J.S., 2006, A&A, 452, 295
- Fruchter et al. (2006) Fruchter A.S., et al., 2006, Nature, 441, 463
- Garnett et al. (2004) Garnett D.R., Kennicutt R.C., Bresolin F., 2004, ApJ, 607, L21
- Georgy et al. (2009) Georgy C., Meynet G., Walder R., Folini D., Maeder A., 2009, A&A, 502, 611
- Hadfield et al. (2005) Hadfield L.J., Crowther P.A., Schild H., Schmutz W., 2005, A&A, 439, 265
- Hadfield & Crowther (2007) Hadfield L.J., Crowther P.A., 2007, MNRAS, 381, 418
- Hamuy et al. (1994) Hamuy M., Suntzeff N. B., Heathcote S. R., Walker A. R., Gigoux P., Phillips M. M., 1994, PASP, 106, 566
- Herrmann et al. (2008) Herrmann K.A., Ciardullo R., Feldmeier J.J., Vinciguerra M., 2008, ApJ, 683, 630
- Hodge & Kennicutt (1983) Hodge P.W., Kennicutt Jr.R.C., 1983, AJ, 88, 296
- Hodge (1974) Hodge P.W., 1974, PASP, 86, 845
- Hummer & Storey (1987) Hummer D.G., Storey P.J., 1987, MNRAS, 224 801
- Karachentsev et al. (2007) Karachentsev I.D., et al. 2007, ApJ, 133, 504
- Karachentsev et al. (2003) Karachentsev I.D., 2003, A&A, 404, 93
- Kelly et al. (2008) Kelly P.L., Kirshner R.P., Pahre M., 2008, ApJ, 687, 1201
- Kennicutt (1984) Kennicutt Jr.R.C., 1984, ApJ, 287, 116
- Kennicutt (1998) Kennicutt Jr.R.C., 1998, ARA&A, 36, 189
- Kennicutt et al. (2008) Kennicutt Jr.R.C., Lee J.C., Funes Jose G.S.J., Sakai S., Akiyama S., 2008, ApJS, 178, 247
- Kewley & Ellison (2008) Kewley L.J., Ellison S.L., 2008, ApJ, 681, 1183
- Kewley & Dopita (2002) Kewley L.J., Dopita M.A., ApJS, 142, 35
- Langer & Maeder (1995) Langer, N., Maeder, A. 1995, A&A 295, 685
- Leloudas et al. (2010) Leloudas G., Sollerman J., Levan A.J., Fynbo J.P.U., Malesani D., Maund J.R., 2010, A&A, 518, 29
- Martin & Friedli (1997) Martin P., Friedli D., 1997, A&A, 326, 449
- Massey (1996) Massey P., 1996, in Verux J.M, Detal A., Fraipont-Caro D., Gosset E., Rauw G., eds, Liege Int. Astrophys. Colloq. Vol. 33, Wolf-Rayet Stars in the Framework of Stellar Evolution. Univ. Liege, Liege, p. 361
- Mazzali et al (2002) Mazzali P.A., Deng J., Maeda K., Nomoto K., Umeda H., Hatano K., Iwamoto K., et al., 2002, ApJ, 572, L61
- Meynet & Maeder (2000) Meynet G., Maeder A., A&A, 361, 101
- Maeder & Meynet (2000) Maeder A., Meynet G., ARA&A, 38, 143
- Meynet & Maeder (2005) Meynet G., Maeder A., A&A, 429, 581
- McCall et al. (1985) McCall M.L., Rybski P.M., Shields G.A., 1985, ApJS, 57, 1
- Modjaz et al. (2011) Modjaz M., Kewley L., Bloom J.S., Filippenko A.V., Perley D., Silverman J.M., 2011, ApJ, 731, 4
- Modjaz et al. (2008) Modjaz M., et al., 2008, ApJ, 135, 1136
- Moffat & Shara (1983) Moffat A.J., Shara M.M., 1983, ApJ, 273, 544
- Neugent & Massey (2011) Neugent K.F., Massey P., 2011, ApJ, 733, 123
- Osterbrock (1989) Osterbrock D.E., 1989, Astrophysics of gaseous nebulae and active galactic nuclei. University of Minnesota, et al. Mill Valley CA, University Science Books, 1989, 422, p
- Pagel & Edmunds (1981) Pagel B.E.J., Edmunds M.G., 1981, ARA&A, 19, 77
- Pettini & Pagel (2004) Pettini, M., Pagel, B.E.K., 2004, MNRAS, 348, L59
- Pilyugin et al (2004) Pilyugin L.S., Vilchez J.M., Contini T., 2004, A&A, 425, 849
- Podsialowski et al (1992) Podsialowski Ph., Joss P.C., Hsu J.J.L., ApJ, 391, 246
- Rosa & D’Odorico (1986) Rosa M., D’Odorica S., 1986, in IAU Symposium 116, pp 355-366
- Ryder et al. (1994) Ryder S.D., Dopita M.A., 1994, ApJ, 430, 142
- Ryder (1995) Ryder S.D., 1995, ApJ, 444, 610
- Schaerer & Vacca (1998) Schaerer D., Vacca W.D., 1998. ApJ, 497, 618
- Schild et al (2003) Schild H., Crowther P.A., Abbott J.B., Schmutz W., 2003, A&A, 397, 859
- Seaton (1979) Seaton M.J., 1979, MNRAS, 187, 73P
- Smartt (2009) Smartt S.J., 2009, AR&A, 47, 63
- Smartt et al (2004) Smartt S.J., Maund, J.R., Hendry M.A., Tout C.A., Gilmore G.F., Mattila S., Benn C.R., 2004, Science, 303, 499
- Smartt et al (2009) Smartt S.J., Eldridge J.J., Crockett R.M., Maund J.R., MNRAS, 395, 1409
- Smith et al. (1996) Smith L.F., Shara M.M., Moffat A.F.J., 1996, MNRAS, 281, 163
- Smith et al. (2011) Smith N., Li W., Filippenko A.V., Chornock R., 2011, MNRAS, 421 1522
- Stetson (2000) Stetson P. B., 2000, PASP, 112, 925
- Tody (1986) Tody D., 1986, SPIE, 627, 733
- Vacca (1994) Vacca W.D., 1994, ApJ, 421, 140
- Li et al (2011) Li W., Chornock R., Leaman J., Filippenko A.V., Pozanski D., Wang X., Ganeshalingam M., Mannucci F., 2011, MNRAS, 412, 1473
- Woosley & Bloom (2006) Woosely, S.E., Bloom, J.S., 2006, ARA&A, 44, 507
- Zaritsky, Kennicutt & Huchra (1994) Zaritsky D., Kennicutt Jr.R.C., Huchra J.P., 1994, ApJ, 420, 87