A success story: 3C 454.3 in the gamma-ray energy band
Abstract
Since 2007, the blazar 3C 454.3 has become the most active and the brightest -ray source of the sky, deserving the nickname of Crazy Diamond. The short-term variability in the -ray energy band and the extremely high peak fluxes reached during intense flaring episodes make 3C 454.3 one of the best targets to investigate the blazar jet properties. We review almost four years of observational properties of this remarkable source, discussing both short- and long-term multi-wavelength campaigns, with particular emphasis on the recent flaring episode which occurred on 2010 November 20, when 3C 454.3 reached on a daily time-scale a -ray flux ( MeV) higher than photons cm-2 s-1, about six times the flux of the brightest -ray steady source, the Vela Pulsar.
I INTRODUCTION
Among the FSRQs detected at energies above 100 MeV, 3C 454.3 (PKS 2251158; ) is certainly one of the most active at high energy. In the EGRET era, it was detected in 1992 during an intense -ray flaring episode (Hartman1992:3C454iauc, ; Hartman1993:3C454_EGRET, ) when its flux was observed to vary within the range photons cm-2 s-1. In 1995, a 2-week campaign detected a -ray flux of its historical maximum (Aller1997:3C454_EGRET, ).
In 2005, 3C 454.3 underwent a major flaring activity in almost all energy bands Giommi2006:3C454_Swift . In the optical, it reached mag (vil06, ) and it was detected by INTEGRAL at a flux111Assuming a Crab-like spectrum. level of photons cm-2 s-1 in the 3–200 keV energy band (Pian2006:3C454_Integral, ). Since the detection of the exceptional 2005 outburst, several monitoring campaigns were carried out to follow the source multifrequency behavior (vil06, ; vil07, ; rai07, ; rai08a, ; rai08b, ). During the last of these campaigns, 3C 454.3 underwent a new optical brightening in mid July 2007, which triggered observations at all frequencies.
During 2007 – 2010, AGILE detected and investigated several -ray flares (Vercellone2008:3C454_ApJ, ; Vercellone2008:3c454:ApJ_P1, ; Donnarumma2009ApJ_P2, ; Vercellone2010ApJ_P3, ; Pacciani2010ApJ_3c454, ; Striani2010ApJ_3c454, ; Vercellone2011:ApJL_3C454_nov2010, ). These observations allowed us to establish a possible correlation between the -ray (0.1 –10 GeV) and the optical (R band) flux variations with no time delay, or with a lag of the former with respect to the latter of about half a day. Moreover, the detailed physical modeling of the spectral energy distributions (SEDs) when 3C 454.3 was at different flux levels provided an interpretation of the emission mechanism responsible for the radiation emitted in the -ray energy band, assumed to be inverse Compton scattering of photons from the broad line region (BLR) clouds off the relativistic electrons in the jet, with bulk Lorentz factor .
In this Paper, we review the main results of both long- and short-term observations, with particular emphasis on the recent flaring episode which occurred on 2010 November 20.
II LONG-TERM MONITORING
AGILE detected 3C 454.3 since the very beginning of its operation, during the Science Verification Phase.
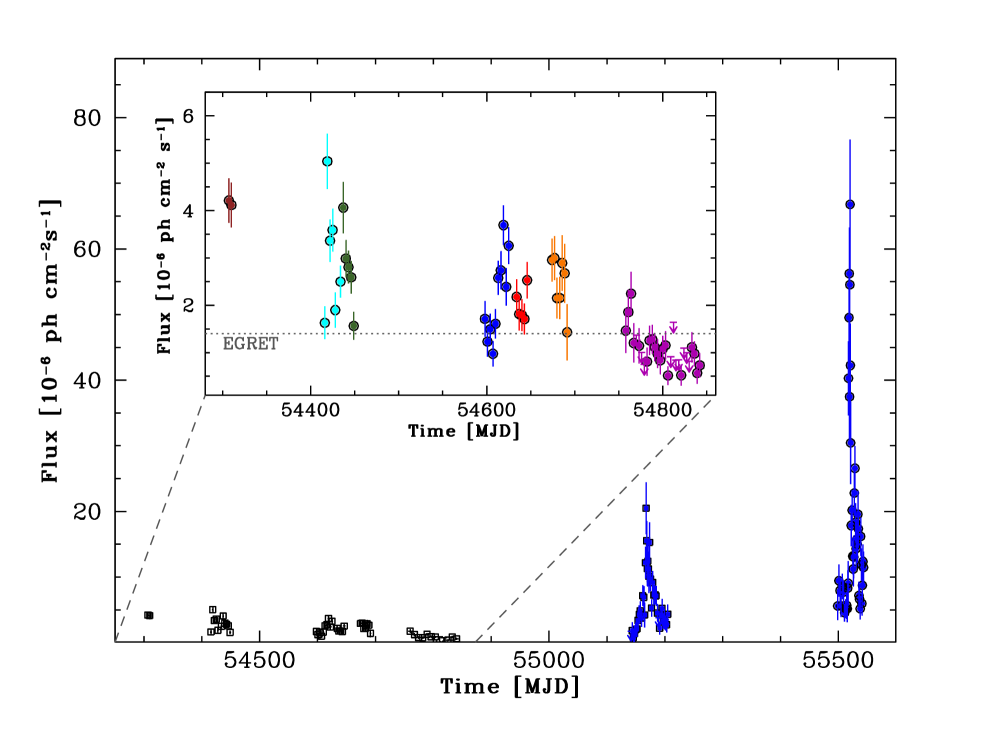
Figure 1 shows the -ray light-curve accumulated during the period 2007 July 15 – 2010 December 15, with particular emphasis on the -ray super-flares which occurred on 2009 December and 2010 November (blue points), when 3C 454.3 reached a -ray flux of photons cm-2 s-1 Striani2010ApJ_3c454 and photons cm-2 s-1 Vercellone2011:ApJL_3C454_nov2010 , respectively. We clearly note that the dynamic range in the -ray flux is of the order of a factor on 100, assuming as a low state the flux value during the Fall/Winter 2008 and as the maximum flux level the super-flare on 2010 November 20. We note that during the 2007 - 2008 campaign (see the inset for a more detailed view) the -ray flux level was, for most of the time, higher than the maximum flux detected by EGRET (dotted gray line). The fast AGILE data analysis system Bulgarelli2009:ASPC_DataAnalysis allowed us to perform several multi-wavelength campaigns almost simultaneous with respect to the -ray flares, involving both space- (e.g., Swift, INTEGRAL, RXTE, Spitzer) and ground-based observatories (GASP–WEBT).
Figure 2 shows the 18-months coverage in the optical (-band), millimeter (230 GHz), and -ray ( MeV) energy bands.
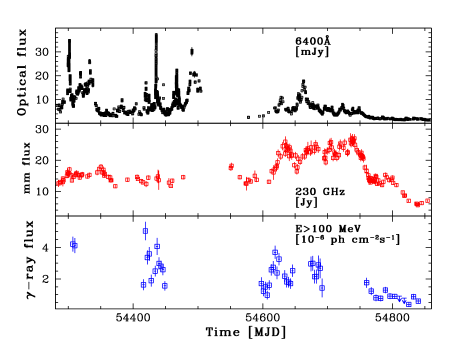
The different variability behavior at different wavelengths can support the hypothesis of a change in orientation of a curved jet, yielding different alignment configurations within the jet itself. In particular, during 2007 the inner portion of the jet seems to be the more beamed one, because of the co-ordinated optical and -ray variability. On the contrary, during 2008, the more extended region of the jet seems to be more aligned with respect to the line of sight, as suggested by the enhanced millimeter variability and by the optical and -ray dimming trend. Recently, a detailed model supporting this interpretation has been presented in rai11 .
Moreover, the long-term optical and -ray coverage allowed us to investigate possible time-lags between the two energy bands. We obtain (see Vercellone2008:3c454:ApJ_P1 ; Donnarumma2009ApJ_P2 ; Vercellone2010ApJ_P3 ) that the emission in the optical band appears to be (weakly) correlated with that at -ray energies above 100 MeV, with a lag (if present) of the -ray flux with respect to the optical one of less than 1 day.
Another remarkable result obtained by investigating all the available X-ray data accumulated during the time-span 2007–2010 is shown in Figure 3.
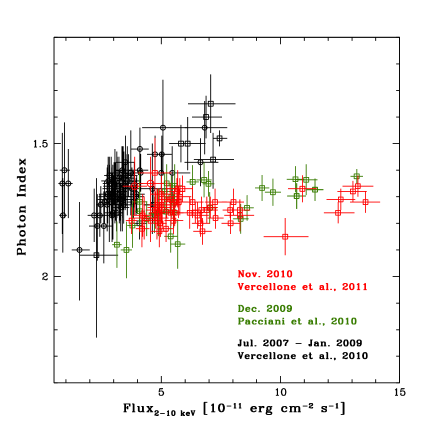
During the 18-months AGILE campaign, Vercellone2010ApJ_P3 found a clear trend, in particular for fluxes above (1–2) erg cm-2 s-1 . We can describe the harder-when-brighter trend in terms of a dominant contribution of the external Compton (EC) off the disk seed photons, EC(Disk), over the synchrotron self-Compton (SSC) component, probably due to an increase of the accretion rate. The constant X-ray photon index during the extreme -ray flares in 2009 and 2010 can be interpreted in terms of a balance of the SSC contribution with respect to the EC(Disk), due to the possible increase of during the super-flares with respect to the value during the less energetic -ray flares Vercellone2011:ApJL_3C454_nov2010 . The net result is a roughly achromatic increase of the X-ray emission.
III SHORT-TERM MONITORING
Detailed multi-wavelength campaigns were carried out during -ray flares in order to investigate the jet properties and to shed light on the radiation mechanisms responsible for the emission at the different wavelengths.

Figure 4 shows the spectral energy distributions (SEDs) during the 2010 November super-flare (color points and lines) compared with the SED during a low -ray state in 2008 Fall (black points and line). As noted in Section II, the dynamic range in the -ray energy band spans about two orders of magnitude, while the SSC peak dynamic range is about one order of magnitude. The super-flare SEDs modeling have to take into account also the flux variability at different wavelengths. About 10 days prior to this super-flare, we detected a so-called “-ray-orphan” optical-UV flare, as shown in Figure 5.

A possible explanation of this complex behavior is as follows: 1) an energetic particle ignition causes the first optical flare at MJD 55510. 2) Subsequently, the blob moves away by cm ( d), toward a region with a denser external photon field in which a doubling in the optical flux can be followed by a stronger EC counterpart, as observed during the -ray enhanced emission at MJD 55517. 3) Since the blob is moving in a region with enhanced density of external seed photons, the optical and -ray flux variations have similar dynamic range (as observed at MJD 55520), until the blob leaves this denser region. 4) Subsequently, as observed in the post-flare SED, the -ray emission decreases because of both the radiative cooling and the decrease of the external photon field due to the blob escaping the enhanced density region. In our modeling, the -ray dissipation region lies within the broad-line region (BLR).
IV CONCLUSIONS
The extreme -ray variability (see e.g., Foschini2011:fsrq_variab ) of 3C 454.3 is still to be fully understood, and different models with respect to the one presented here can be invoked to explain the observed SEDs (see e.g., Jorstad2010:3C454MW ; Bonnoli2011:3c454 ). An intriguing possibility to explain such an extreme behavior is to invoke the presence of a super-massive binary black-hole, as suggested in Qian2007:3C454_smbbh . This hypothesis is one of the possible challenges for future long-term projects.
Acknowledgements.
We acknowledge financial contribution from the agreement ASI-INAF I/009/10/0. The AGILE Mission is funded by the Italian Space Agency (ASI) with scientific and programmatic participation by the Italian Institute of Astrophysics (INAF) and the Italian Institute of Nuclear Physics (INFN). We acknowledge ASI contract I/089/06/2.References
- (1) R. C. Hartman, et al., IAU Circ. 5477, 2 (1992).
- (2) R. C. Hartman, et al., Astrophys. J. Letters 407, L41–L44 (1993).
- (3) M. F. Aller, et al., “Radio to gamma Ray Observations of 3C 454.3: 1993-1995,” in Proceedings of the Fourth Compton Symposium, edited by C. D. Dermer, M. S. Strickman, and J. D. Kurfess, 1997, vol. 410 of American Institute of Physics Conference Series, p. 1423.
- (4) P. Giommi, et al., Astron. & Astrophys. 456, 911–916 (2006).
- (5) M. Villata, et al., Astron. & Astrophys. 453, 817–822 (2006).
- (6) E. Pian, et al., Astron. & Astrophys. 449, L21–L25 (2006).
- (7) M. Villata, et al., Astron. & Astrophys. 464, L5–L9 (2007).
- (8) C. M. Raiteri, et al., Astron. & Astrophys. 473, 819–827 (2007).
- (9) C. M. Raiteri, et al., Astron. & Astrophys. 485, L17–L20 (2008).
- (10) C. M. Raiteri, et al., Astron. & Astrophys. 491, 755–766 (2008).
- (11) S. Vercellone, et al., Astrophys. J. Letters 676, L13–L16 (2008).
- (12) S. Vercellone, et al., Astrophys. J. 690, 1018–1030 (2009).
- (13) I. Donnarumma, et al., Astrophys. J. 707, 1115–1123 (2009).
- (14) S. Vercellone, et al., Astrophys. J. 712, 405–420 (2010).
- (15) L. Pacciani, et al., Astrophys. J. Letters 716, L170–L175 (2010).
- (16) E. Striani, et al., Astrophys. J. 718, 455–459 (2010).
- (17) S. Vercellone, et al., Astrophys. J. Letters 736, L38+ (2011).
- (18) A. Bulgarelli, M. Trifoglio, F. Gianotti, G. Di Cocco, and M. Tavani, “AGILE-GRID Automated Web-based Analysis System for Fast Detection of Gamma-ray Transients,” in Astronomical Data Analysis Software and Systems XVIII, edited by D. A. Bohlender, D. Durand, & P. Dowler, 2009, vol. 411 of Astronomical Society of the Pacific Conference Series, pp. 362–+.
- (19) C. M. Raiteri, et al., Astron. & Astrophys. 534, A87+ (2011).
- (20) L. Foschini, G. Ghisellini, F. Tavecchio, G. Bonnoli, and A. Stamerra, Astron. & Astrophys. 530, A77+ (2011).
- (21) S. G. Jorstad, et al., Astrophys. J. 715, 362–384 (2010).
- (22) G. Bonnoli, G. Ghisellini, L. Foschini, F. Tavecchio, and G. Ghirlanda, Mon. Not. R. Astron. Soc. 410, 368–380 (2011).
- (23) S.-J. Qian, et al., Chinese J. of Astron. & Astrophys. 7, 364–374 (2007).