The Formation of Galaxies Hosting Quasars
Abstract
We investigate the formation and properties of galaxies hosting quasars, in the gigaparsec scale cosmological hydrodynamical simulation: MassiveBlack , which includes a self-consistent model for star formation, black hole accretion and associated feedback. We show that the MassiveBlack reproduces current estimates of the galaxy stellar mass function . We find that quasar hosts in the simulation are compact gas rich systems with high star formations rates of SFR consistent with observed properties of Sloan quasar hosts in the redshift range . We show that the star-forming gas in these galaxies predominantly originates from high density cold streams which are able to penetrate the halo and grow the galaxy at the center. MassiveBlack predicts a deviation from the local and relation implying that black holes are relatively more massive for a given stellar host at these redshifts.
keywords:
galaxies: active - galaxies: formation - galaxies: evolution - methods: numerical quasars: general - black hole physics1 Introduction
Supermassive black holes (SMBH) are now ubiquitously found in the nuclei of local galaxies. Tight correlations have been observed between the central black hole and its host galaxy (Magorrian et al., 1998; Ferrarese & Merritt, 2000; Gebhardt et al., 2000; Graham et al., 2001; Tremaine et al., 2002; Häring & Rix, 2004; Marconi & Hunt, 2003), implying that the growth of the quasar, powered by the SMBH, is intimately linked to the formation of its host galaxy. At and above the most direct constraint on the evolution of SMBHs comes from observations of luminous quasars in the Sloan Digital Sky Survey (Fan et al., 2006; Jiang et al., 2009). Recently a detection has been confirmed for a quasar at (Mortlock et al., 2011). These quasars are mainly optically selected and represent the bright end of the quasar population at this epoch. They are rare with number densities of a few Gpc-3 and extremely luminous with inferred masses of , suggesting that they are harboured in rare halos of mass at these redshifts. Observations in other bands, far infrared (FIR)-radio, suggest that the spectral energy distributions (SED) of these quasars are similar to those of their low redshift counterparts (Wang et al., 2008). This means that black holes are fully developed and already in place even when the Universe was relatively young ( years at ).
Reprocessed thermal dust continuum emission in the FIR provides a clean method for deriving the total star formation rates in galaxies (Dale & Helou, 2002). Bright quasars also add to the FIR luminosity, , and one needs to correct for it to estimate the star formation rate (SFR) of the host galaxy. The excess (corrected) for a sample of quasar hosts suggests a massive starburst origin (SFR yr-1) for them (Wang et al., 2010, 2011). These authors also detected large reservoirs of molecular gas, with mass , in these galaxies through the emission of redshifted carbon monoxide (CO) line, further corroborating the result that the observed large star formation activity in these galaxies are sustained through an abundant supply of molecular gas, the fuel for star formation. The cold gas in these galaxies is localised within a radius of a few kpc (Walter et al., 2004, 2009; Wang et al., 2010). The relation between CO luminosity, , and for these galaxies are similar to those of typical star-forming systems at lower redshift.
However the relation between the black hole mass, and the bulge velocity dispersion of its host, , is seen to be above the local relation(Wang et al., 2010), indicating that the relation is evolving. This is true even when some of the assumptions, like degeneracy of with inclination angle are considered. Even though there is still significant debate whether there may be observational biases influencing these results (Lauer et al., 2007).
Recent observations with the refurbished Hubble Space Telescope (HST) have yielded a considerably larger sample of more typical galaxies at . The newly installed Wide Field Camera (WFC3/IR) and the Advanced Camera for Surveys (ACS) on the HST have been used to detect much fainter galaxies out to . These provide strong constraints on the UV luminosity function of galaxies (Bouwens et al., 2011a, b) at these redshifts. In addition WFC3/IR+ACS in combination with the Spitzer telescope has been used to detect the highest redshift () galaxy till date (Bouwens et al., 2011c; Oesch et al., 2011). The UV luminosity function at these redshifts has been used to estimate the galaxy stellar mass function (GSMF) from (González et al., 2011).
These observations of high redshift galaxies impose strong constraints on theoretical models of galaxy formation. Hydrodynamic simulations (with models for star formation) have been carried out for studying the global properties of high redshift galaxies (Salvaterra, Ferrara, & Dayal, 2011; Jaacks, Choi, & Nagamine, 2011). They are able to reproduce the observed UV luminosity of these galaxies with some assumptions for extinction due to dust. However the shape of the GSMF (Jaacks, Choi, & Nagamine, 2011) is found to be inconsistent with those inferred from observations (González et al., 2011). These simulations do not model the growth of black holes and their feedback on the surrounding environment and are typically small in volume being incapable to host rare high-sigma peak objects.
The requirement for large volumes and significant resolution to follow galaxy formation (gas inflows into relatively small scales) has made numerical studies of the growth of the first quasars extremely challenging. A number of approaches have resorted to ’constrained’ simulations. In a pioneering study, (Li et al., 2007) high-resolution merger simulations with subgrid models for star formation and growth of black holes have been used to study the formation of quasars. This work extracted merger trees from large, coarse dark matter only simulations and identified the most massive halo candidate at . To simulate at high resolution the merger trees were populated with isolated galaxies which undergo the corresponding mergers and are then endowed with gas and models for star formation and black hole growth.
This approach qualitatively reproduces the properties of the quasar SDSS J1148+5251 and its host at . Fully cosmological re-simulations of selected halos from the Millenium run were also carried out in a more recent study by Sijacki, Springel, & Haehnelt (2009). This approach also finds that the most massive halos are consistent with being the first quasar hosts.
In order to study directly how and where the first quasars assemble, without a pre-imposed choice of halo, large cosmological volumes () for capturing rare high-sigma peaks are required and sufficiently high-resolution in order to resolve kpc scales. High resolution is also necessary when including subgrid models for star-formation, black hole accretion and related feedback processes. Keeping these constraints in mind we have run the largest (currently feasible) hydrodynamic simulation of its kind, MassiveBlack , which includes gravity, hydrodynamics and subgrid models for star-formation, black hole growth and associated feedback processes. It was run in a cosmological volume of with billion particles (dark matter + gas) and a uniform gravitational softening of , with the code P-GADGET which has been extensively modified from the public code GADGET2 (Springel, 2005) to run optimally on a large number of multicore processors. The simulations were carried out on cores of Kraken at NICS111http://www.nics.tennessee.edu. MassiveBlack has the same mass and force resolution (as well as similar subgrid models for star formation, black hole growth and associated feedback processes) as that of the resimulated halo of Li et al. (2007), however it does not rely on an imposed merger scenario to produce luminous quasars at and tracks the assembly of galaxies in a more self-consistent manner.
The high redshift observations of galaxies, quasars and their hosts can be used to test standard models of galaxy formation in previously unexplored regimes. Indeed MassiveBlack has been instrumental in reproducing a number of observational properties of high-z quasars,e.g. the formation and abundances of Sloan Digital Sky Survey (SDSS) type black holes of mass at (Di Matteo et al., 2011) and also statistical properties, such as their luminosity function and high-redshift clustering (DeGraf et al., 2011). In this work we study the formation and properties of galaxies hosting quasars and as a sanity check we see how well observed global properties of galaxies compare with those in MassiveBlack . Our paper is organised as follows. We start with by describing the MassiveBlack simulation in section 2. In section 2.1 we compare the GSMF in MassiveBlack with observations and earlier simulations. We next identify a sample of potential quasar host galaxies at and look at their formation and growth in sections 4.1 and 4.2. In section 4.3 we compare properties of these galaxies in MassiveBlack with recent observations. We present our conclusions in section 5.
| 533.333 | 2.78 | 5.65 | 5 |
2 Methods: The Massive Black Simulation
In this section we describe a large hydrodynamic simulation, MassiveBlack , which we have run to study the high redshift Universe. We have used P-GADGET, a significantly upgraded version of GADGET3 (see (Springel, 2005) for an earlier version) which we are developing for use at upcoming Petascale supercomputer facilities. MassiveBlack is a cosmological simulation of a CDM cosmology.
It is worth pointing out that the number density of quasars is extremely small, a few , and that they are hosted by rare massive halos. Therefore in order to simulate and resolve these objects one needs a large cosmological volume as well as high mass and force resolution. MassiveBlack was run with billion particles in a comoving volume of side and a comoving gravitational softening length of , (see table 1 for more details).
The initial conditions were generated with the Eisenstein and Hu power ( spectrum at and the simulation was evolved to . The cosmological parameters used were: the amplitude of mass fluctuations, , spectral index, , cosmological constant parameter , mass density parameter and baryon density parameter .
Along with gravity and smoothed particle hydrodynamics (SPH) P-GADGET incorporates a multi-phase ISM model with star formation (Springel & Hernquist, 2003) and black hole accretion and feedback (Di Matteo, Springel, & Hernquist, 2005; Springel, Di Matteo, & Hernquist, 2005).
2.1 Subgrid model for black hole accretion and feedback
 |
Black holes are modelled as collisionless sink particles within newly collapsing halos in our simulation, which are identified by a friends-of-friends (FOF) (Davis et al., 1985) halofinder called on the fly at regular time intervals. A seed black hole of mass is inserted into a halo with mass if it does not already contain a black hole. The seeding recipe is chosen to match the expected formation of SMBHs by gas directly collapsing to black holes with (Bromm & Loeb, 2003; Begelman, Volonteri, & Rees, 2006) or by massive primordial stars collapsing into mass black holes (Bromm & Larson, 2004; Yoshida et al., 2006) at . Once seeded, black holes grow by accreting surrounding gas or by merging with other black holes. Gas is accreted with an accretion rate (Hoyle & Lyttleton, 1939; Bondi & Hoyle, 1944; Bondi, 1952), where is the local gas density, is the local sound speed and is the relative velocity of the black hole and the surrounding gas. We limit the accretion rate to mildly super-Eddington consistent with Begelman, Volonteri, & Rees (2006); Volonteri & Rees (2006) to prevent artificially high values. The black hole radiates with a bolometric luminosity which is proportional to the accretion rate, (Shakura & Sunyaev, 1973), where is the radiative efficiency and its standard value of 0.1 is kept throughout, and is the speed of light. Some of the liberated energy is expected to couple thermally to the surrounding gas. In the simulation 5% of the radiated energy does this. This energy is deposited isotropically on gas particles that are within the black hole kernel (32 nearest neighbours) and acts as a form of feedback energy (Di Matteo, Springel, & Hernquist, 2005). The value of 5% is the only parameter in the model and was set using galaxy merger simulations(Di Matteo, Springel, & Hernquist, 2005) to match the normalisation in the observed relation. Black holes also grow by merging with other black holes once they come within the spatial resolution with a relative velocity below the local gas sound speed.
This model for the growth of black holes has been developed by Di Matteo, Springel, & Hernquist (2005); Springel, Di Matteo, & Hernquist (2005). It has been implemented and studied extensively in cosmological simulations (Sijacki et al., 2007; Li et al., 2007; Colberg & Di Matteo, 2008; Di Matteo et al., 2008; Croft et al., 2009; Booth & Schaye, 2009; Sijacki, Springel, & Haehnelt, 2009; Degraf, Di Matteo, & Springel, 2010, 2011; Degraf et al., 2011; Chatterjee et al., 2011) successfully reproducing basic properties of black hole growth, the observed relation and the black hole mass function (Di Matteo et al., 2008), the quasar luminosity function (Degraf, Di Matteo, & Springel, 2010) as well as the clustering of quasars (Degraf, Di Matteo, & Springel, 2011).
We identify galaxies with the group-finder code SUBFIND (Springel et al., 2001). SUBFIND identifies bound clumps within a FOF halo and properties of galaxies such as position, mass (dark matter, gas, stars and black holes), star formation rate (SFR) among others are stored.
We use a relational database management system developed by Lopez et al. (2011) specifically for this simulation to track the history of black hole properties (e.g. mass, accretion rate, position, local gas density, sound speed, velocity, and black hole velocity relative to local gas) which are saved for each black hole at every timestep. For a complete summary of the database format and its efficiency, the reader is referred to Lopez et al. (2011).
3 Results
3.1 The Galaxy Stellar Mass Function
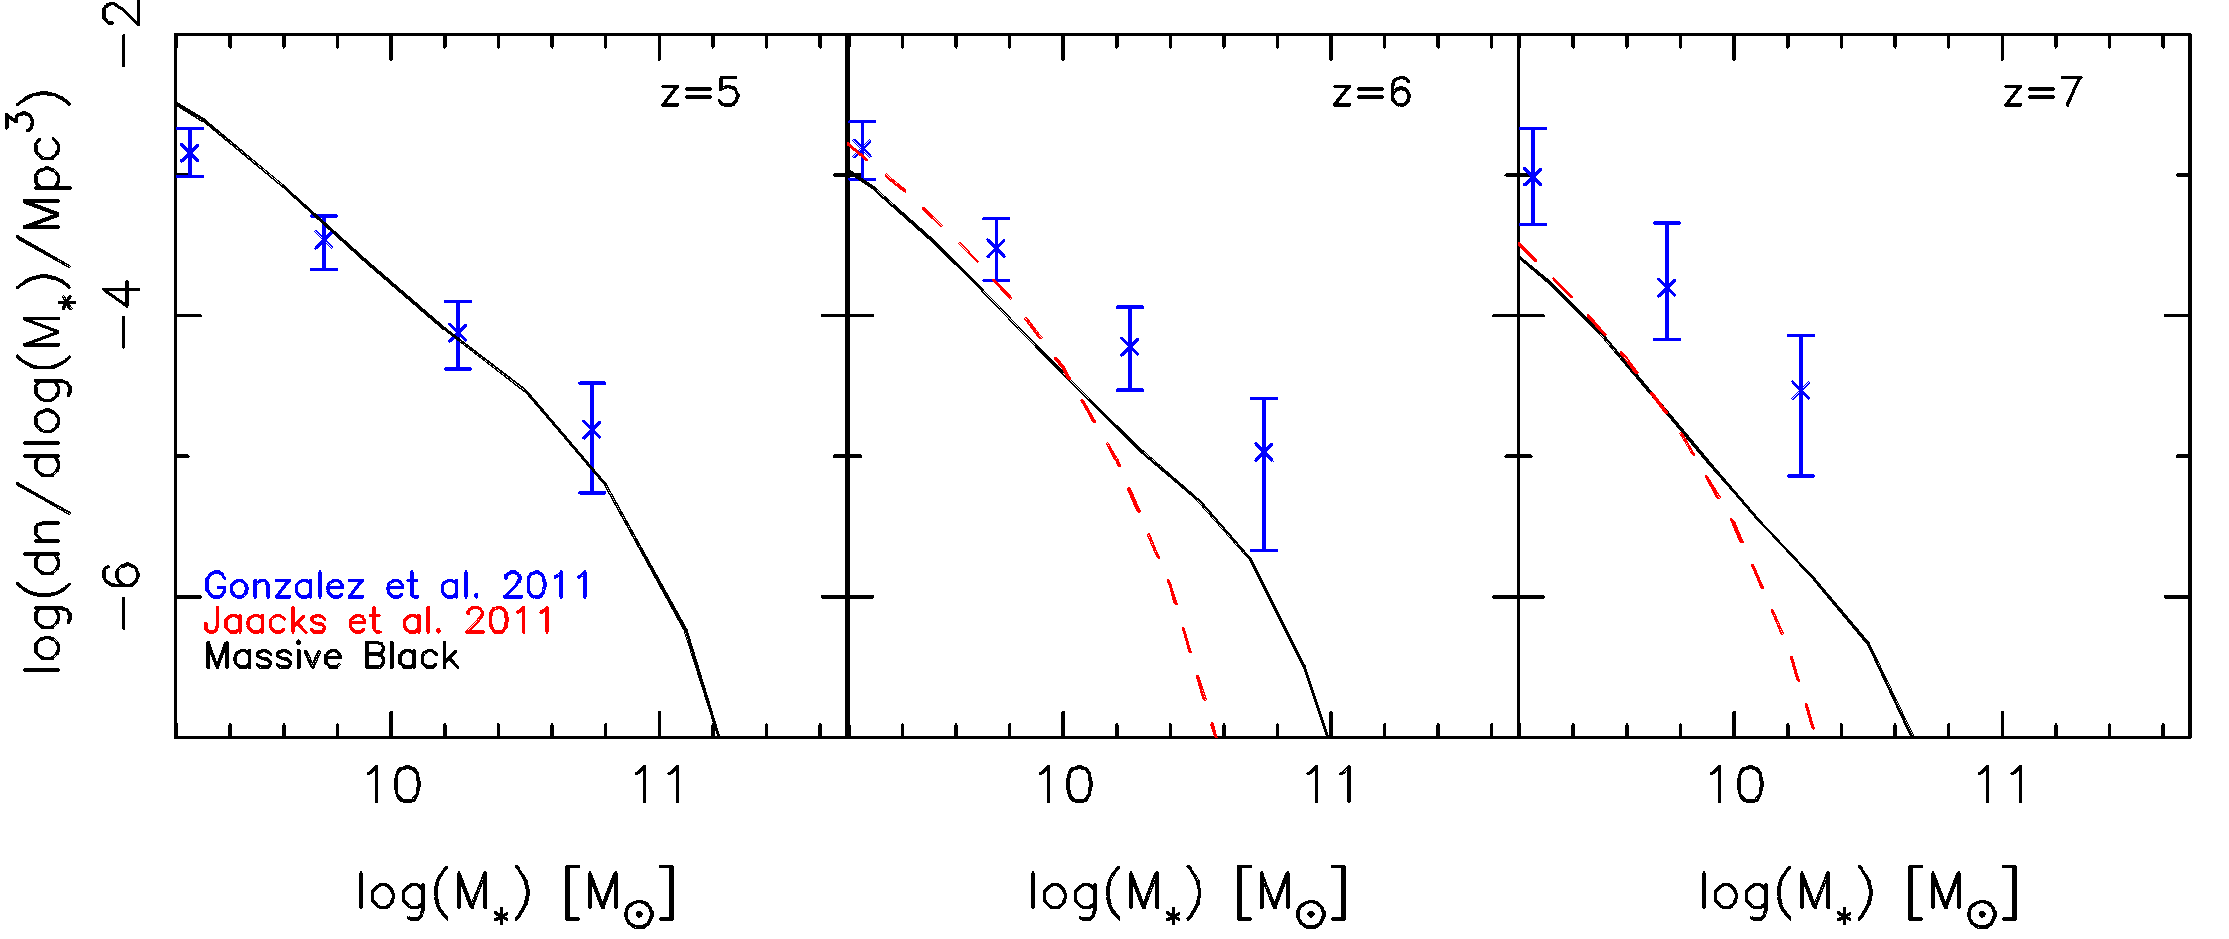
We start by looking at the global properties of galaxies at high redshift in the MassiveBlack simulation. We use the halo catalogues generated by SUBFIND and pick all halos with more than 40 star particles to construct a galaxy stellar mass function (GSMF) from to . This translates to a minimum stellar mass of galaxies of . We compare our GSMF with recent observed mass functions (González et al., 2011) which were derived from the luminosity function at these redshifts (Bouwens et al., 2011a). We also compare our GSMF with those from recent hydrodynamic simulations at these redshifts by Jaacks, Choi, & Nagamine (2011). We note that Jaacks, Choi, & Nagamine (2011) used multiple runs with varying resolution to achieve a larger dynamic range in resolved galaxies, and were run with the same SPH code and cosmological parameters as the MassiveBlack run in this study. Feedback due to AGNs was however not included by Jaacks, Choi, & Nagamine (2011). Two examples of the Jaack et al. runs are the N600L100 (, ) of Jaacks, Choi, & Nagamine (2011) which has exactly the same mass resolution as our MassiveBlack simulation and their N400L10 run (, ) which can probe galaxies masses down to .
Our results (solid line) are shown in figure 1 for and (left to right). The data points are from observations at these redshifts (González et al., 2011). The dashed lines are from Jaacks, Choi, & Nagamine (2011) and were only computed down to . At our results are in good agreement with observations in the mass range that we are able to resolve.
At we slightly underpredict the GSMF for , but a main difference with Jaacks, Choi, & Nagamine (2011) is that their GSMF curve drops off completely for . This may be due to the smaller volume ( times smaller than MB) that they have used. However they are consistent with our estimates for .
At both the theoretical GSMFs underpredict that of the observations in the entire mass range. The source of this discrepancy is at present unclear. This may be due to the relation between mass and light used by (González et al., 2011) which was calibrated at and is consistent with the sample at . At and this correlation is less obvious even though it is consistent, in zero point, with the even smaller sample at these higher redshifts. Our GSMF are evolving but the observations are consistent (within error-bars) with no evolution in the GSMF from to . We will explore these issues as well as the luminosity function of high redshift galaxies, which is the direct observable in a future work.
4 Properties of Host Galaxies of Quasars
We now focus on individual properties of host galaxies of quasars in this section. We look at how these galaxies and the black holes at their center were assembled and compare our results with their observed properties in the latter part of this section.
4.1 Star formation and black hole growth
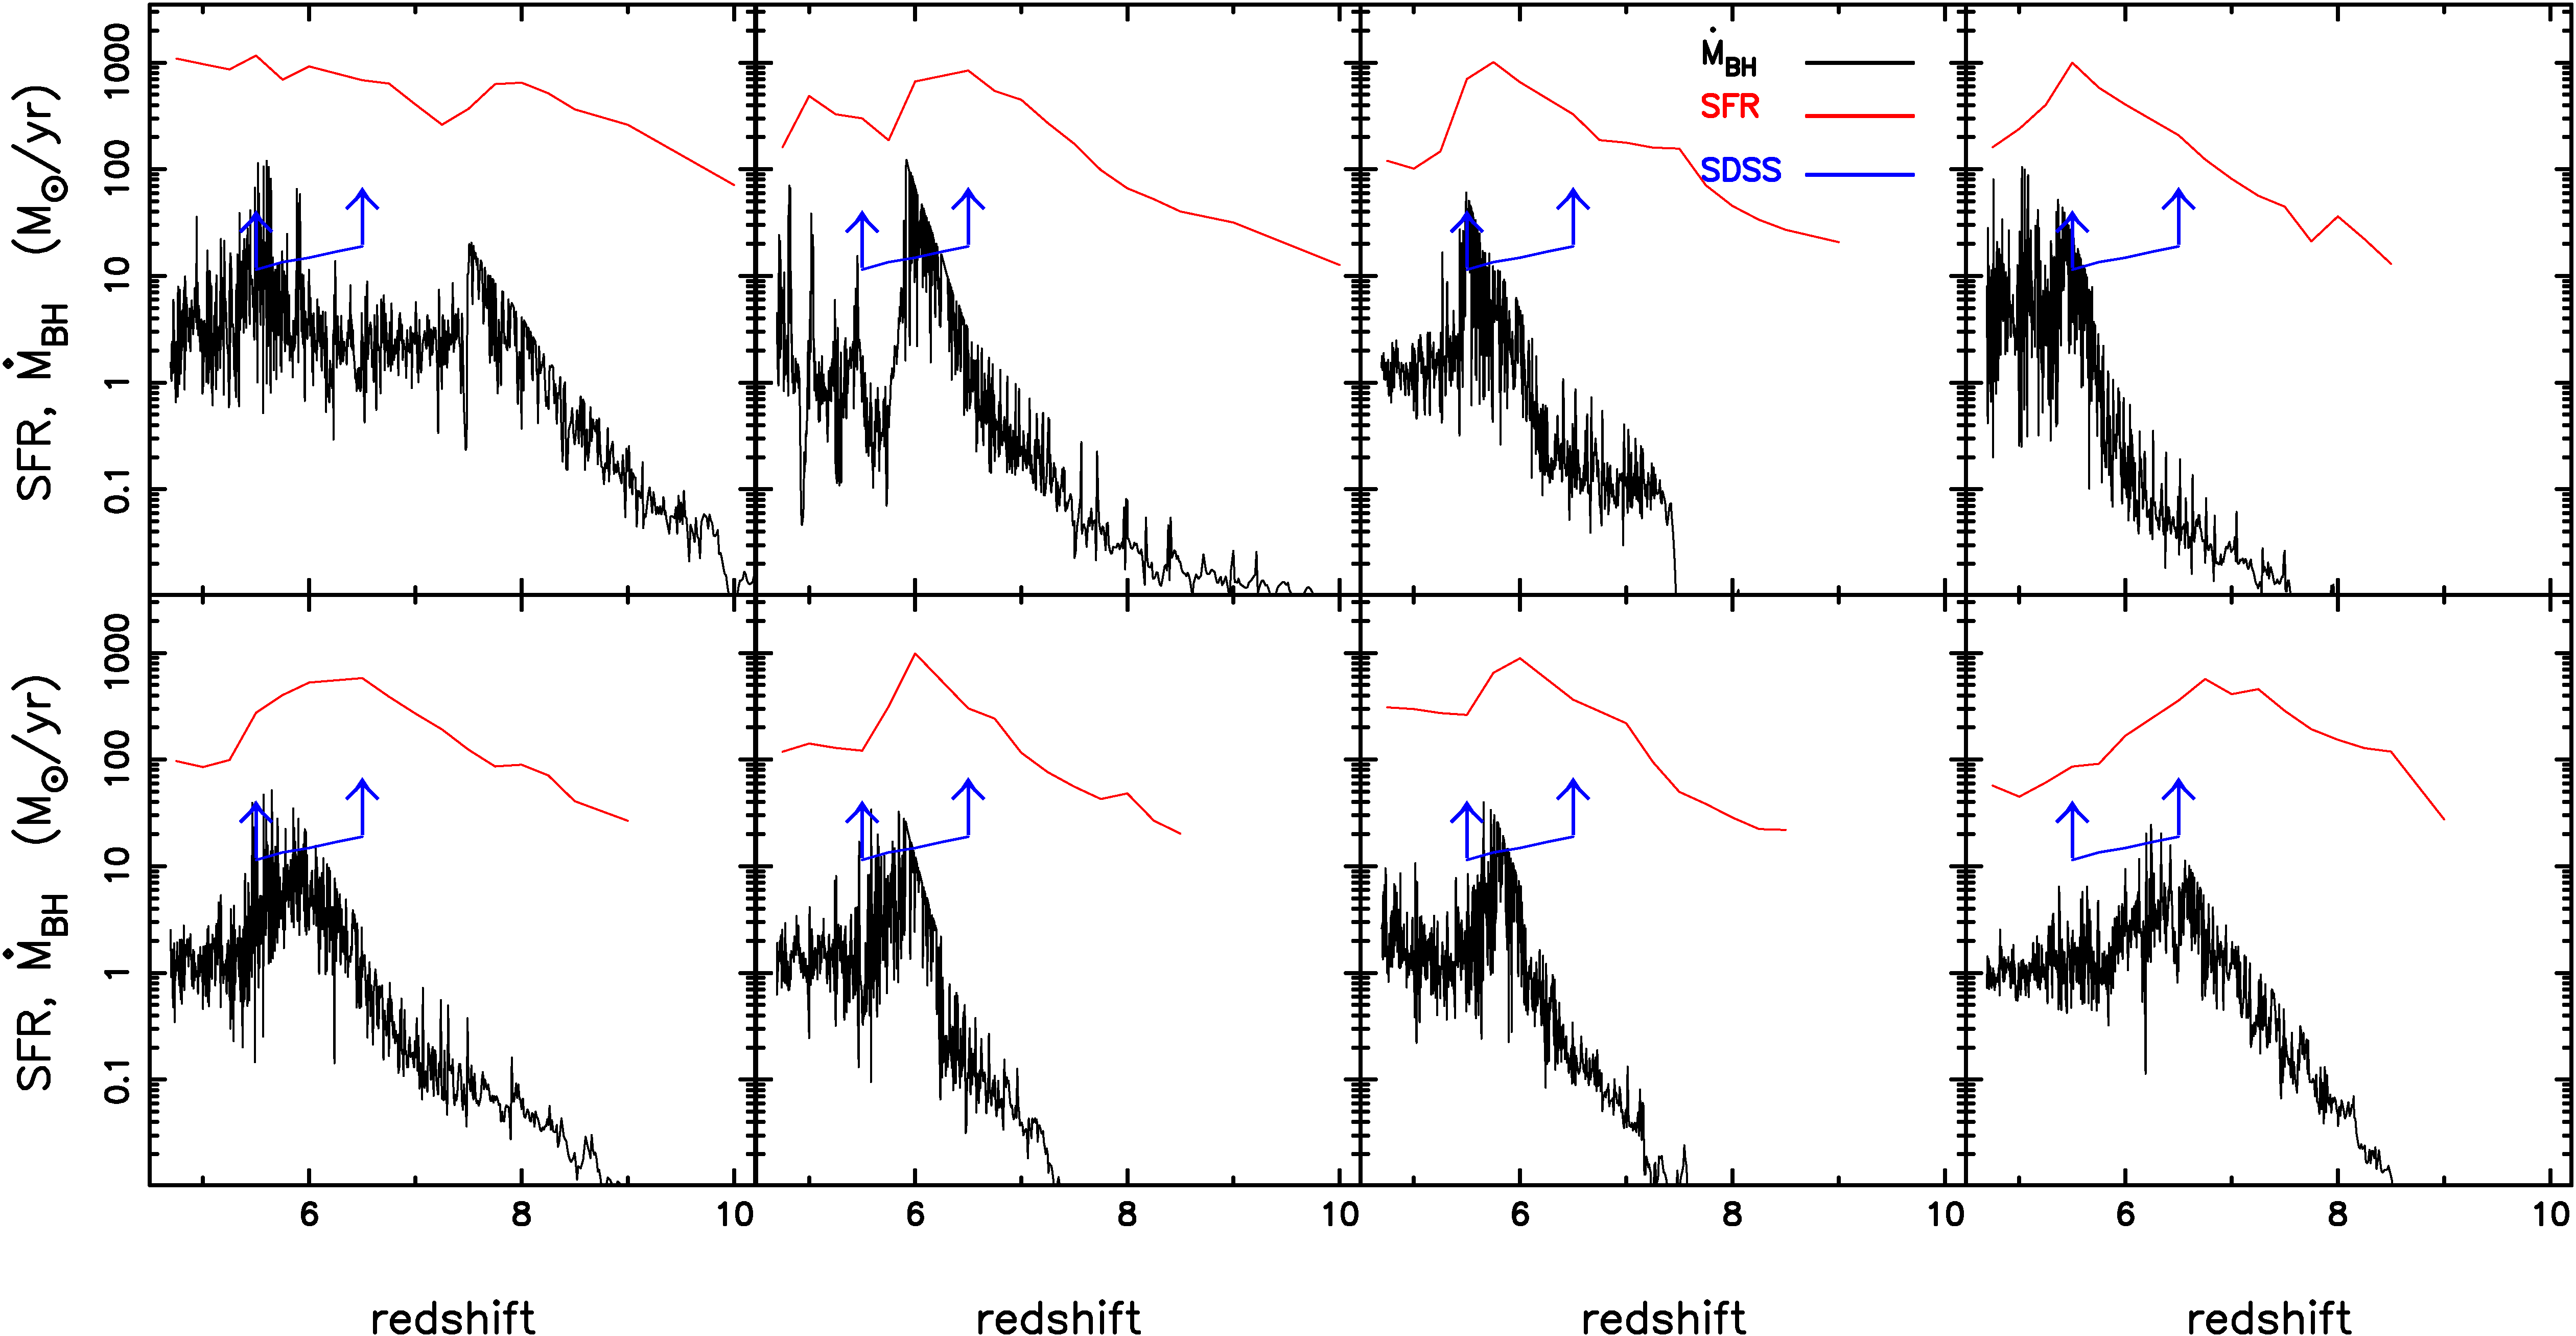 |
Our simulation allows us to follow the growth of supermassive black holes and their host galaxies up to . In Figure 2, we plot the accretion rate of the black hole (black) and the SFR (red) of its host with redshift for a sample of eight luminous quasars selected such that their luminosity is consistent with the magnitude limit for quasars in the Sloan survey. This is the blue line, which is bounded by an -band magnitude limit of for (Shen et al., 2009) and converted to a bolometric luminosity (and then an accretion rate) using the SED of Hopkins, Richards, & Hernquist (2007). This SDSS flux cut roughly corresponds to BH accretion rates of about 10 solar masses per year).
In figure 2 we find that the star formation rate in the galaxy is strongly correlated with the growth of the central black hole. The central black holes grow rapidly through a period of sustained Eddington accretion ( typically between ) and are continuously fed by streams of high density gas (Di Matteo et al., 2011). The mass of the host halos in this sample grow from at to at . Prior to its peak accretion phase the black hole grows more rapidly that the stellar mass in its host. Star formation is regulated by feedback from the black hole, and typically star formation is suppressed just prior to the peak accretion phase of the black hole. This is a typical feature of this model and has been seen in many previous works (Di Matteo, Springel, & Hernquist, 2005; Li et al., 2007; Sijacki, Springel, & Haehnelt, 2009). Once the black hole accretion becomes feedback dominated it deposits enough energy in its vicinity and shuts off further growth by expelling gas in its surrounding star-forming region. At its peak, the SFR of the host galaxy is extremely high, , and is consistent with observations (Wang et al., 2010, 2011) for the SFR of quasar hosts at these redshifts. We make a direct comparison with observations in a later section. Most of the SMBHs fall within the Sloan detection limit when they grow through Eddington limited accretion and attain during this phase. The one exception is the first object which peaks early on at then undergoes a merger (as will become evident in figure 3) at to become a black hole.
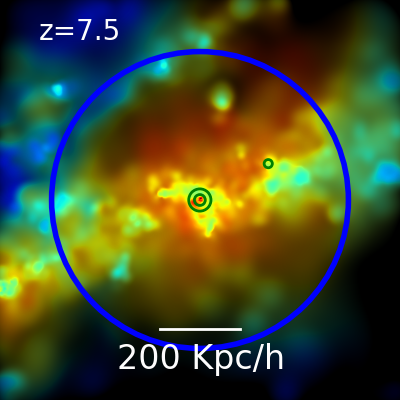
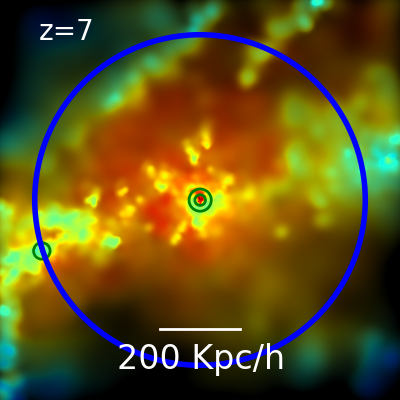
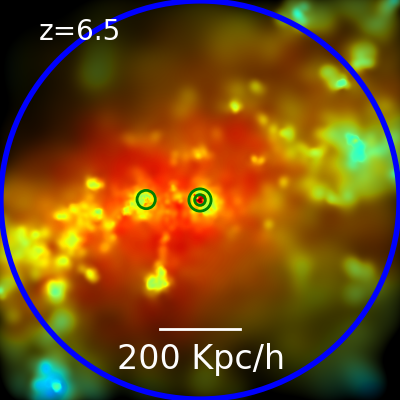
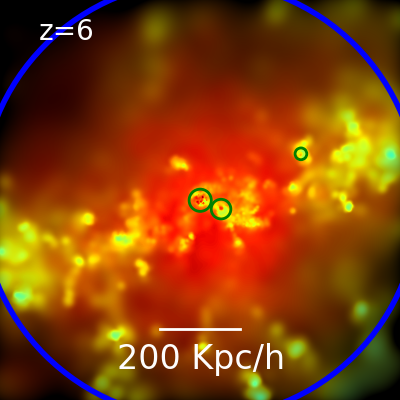
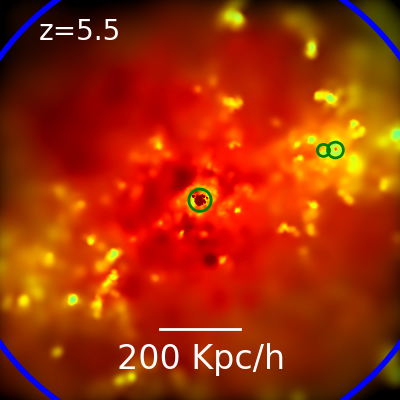
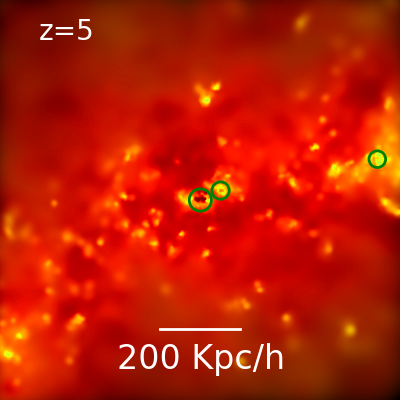
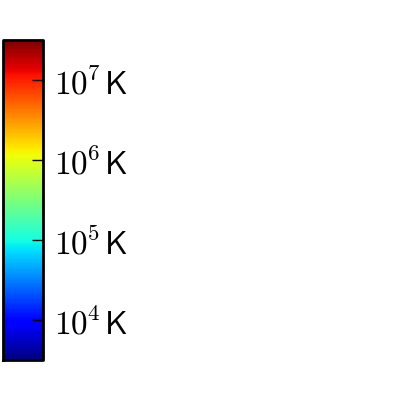
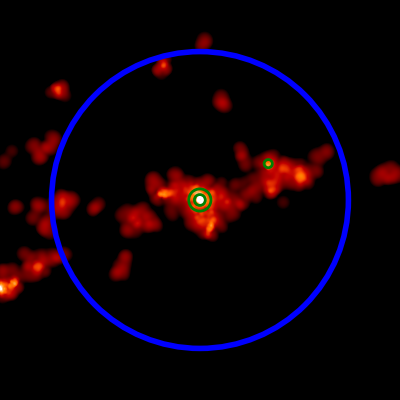
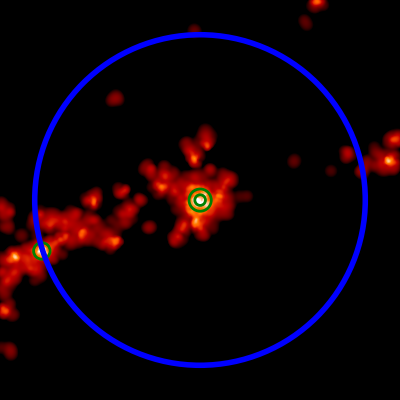
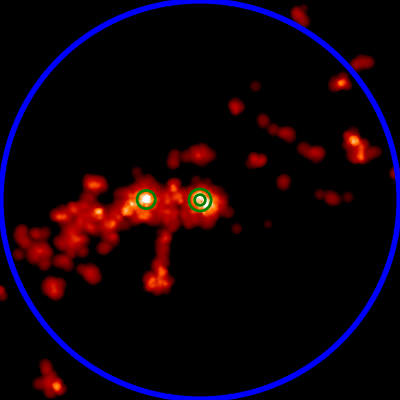
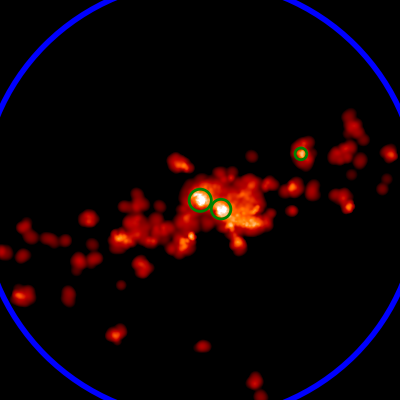
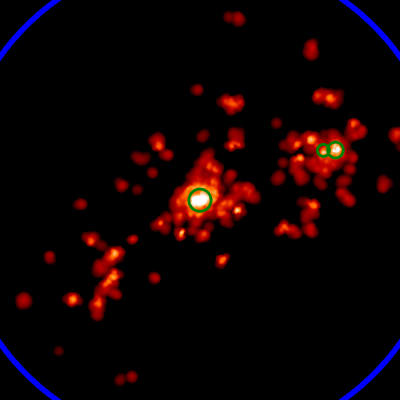
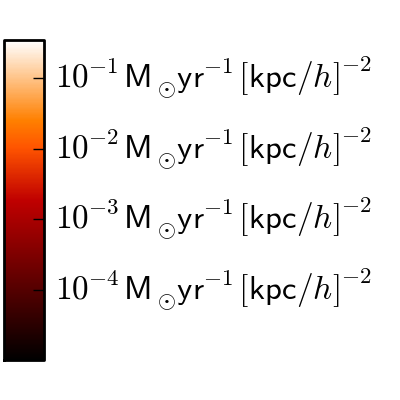
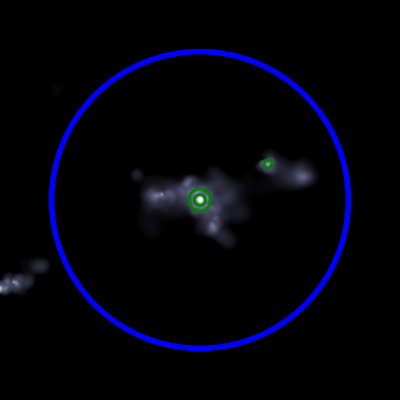
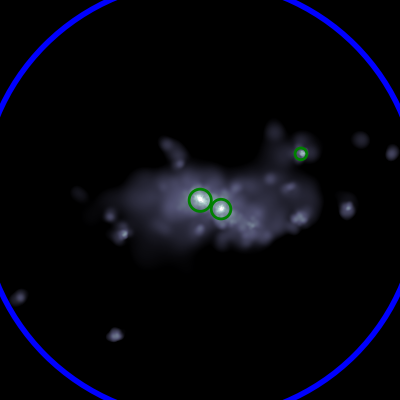
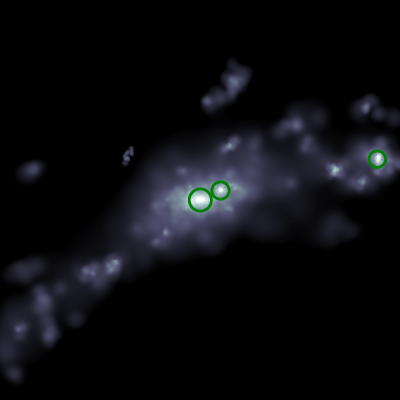
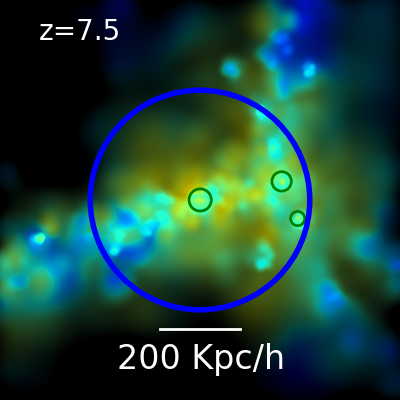
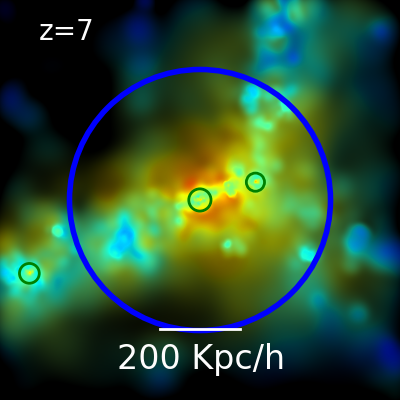
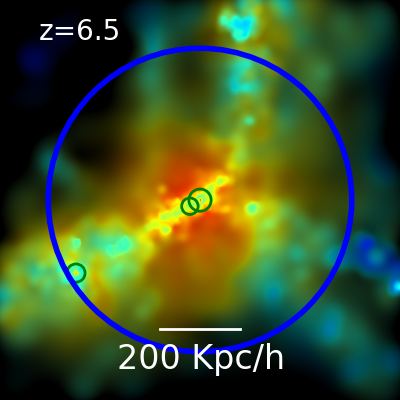
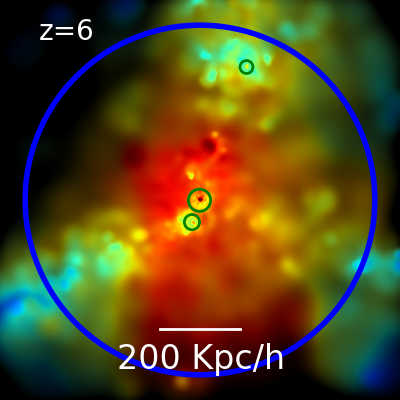
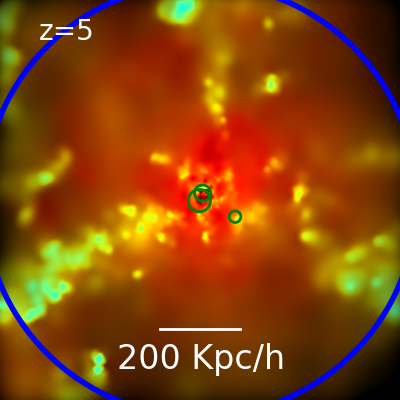
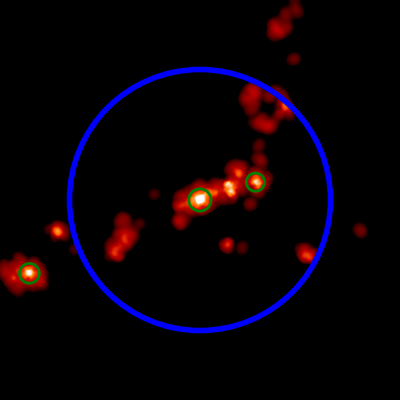
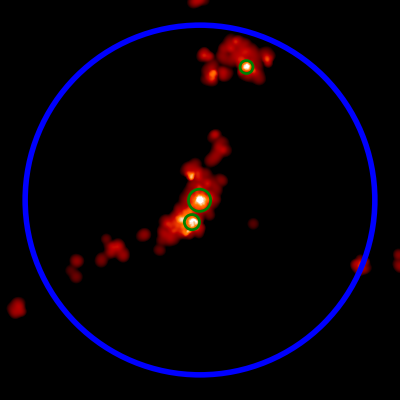
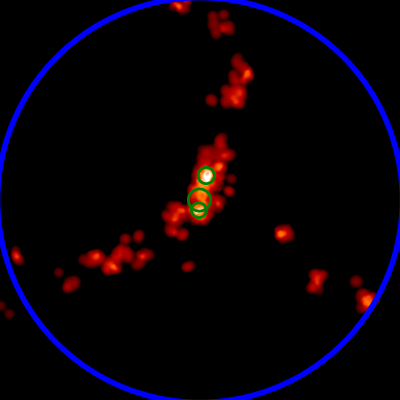
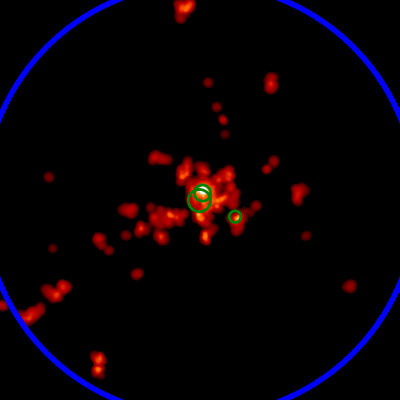
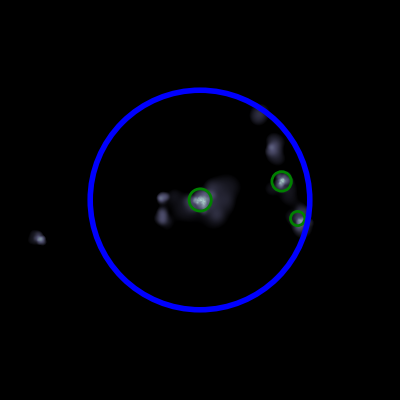
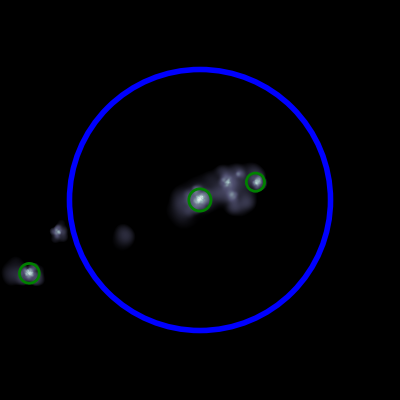
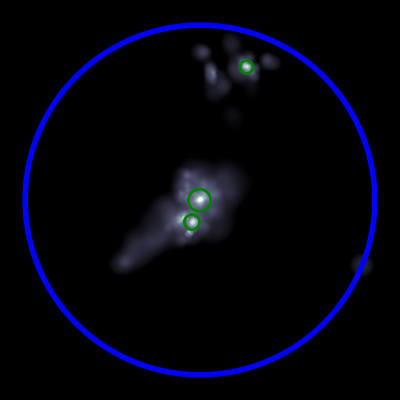
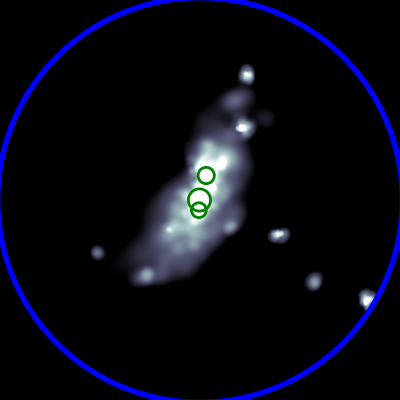
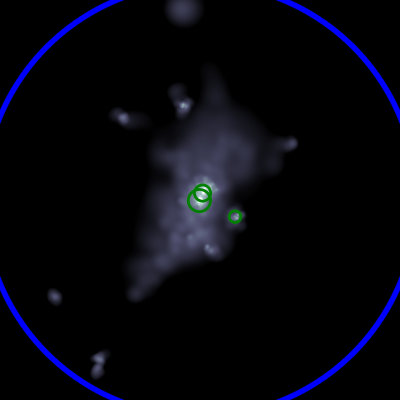
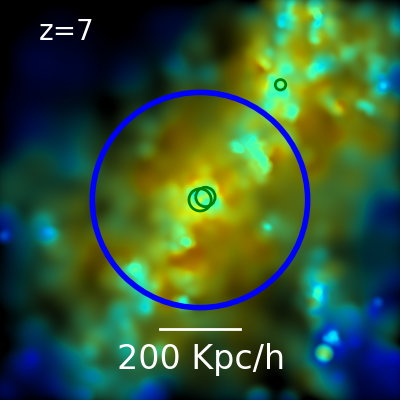
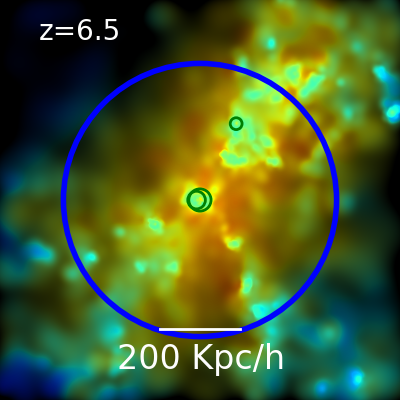
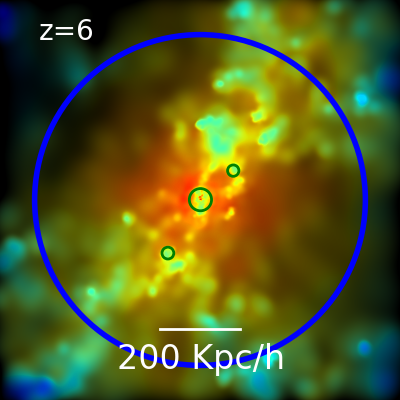
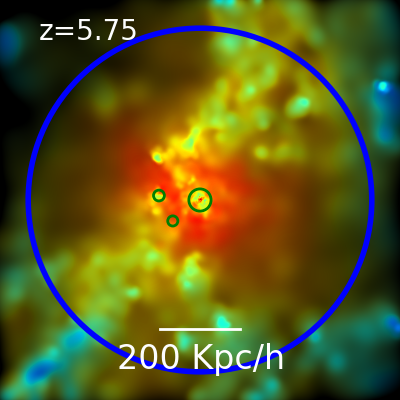
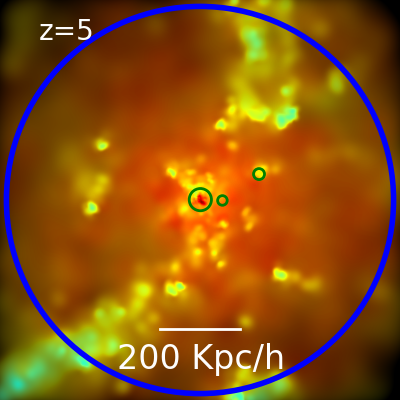
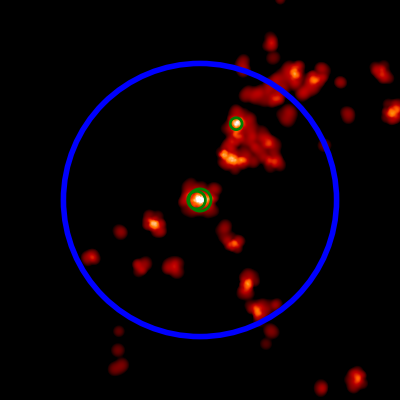
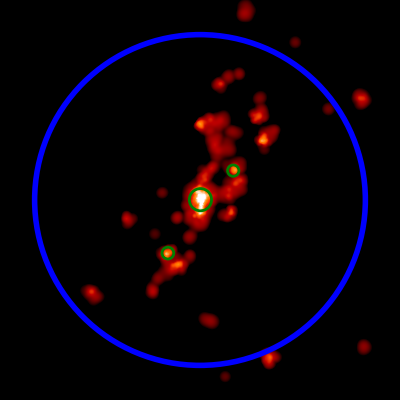
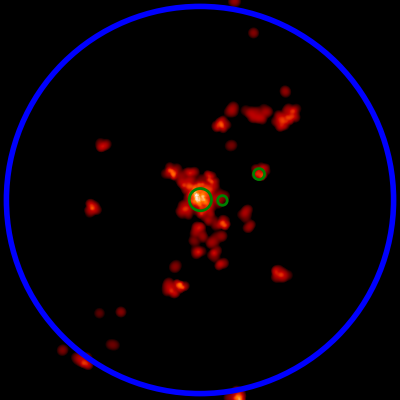
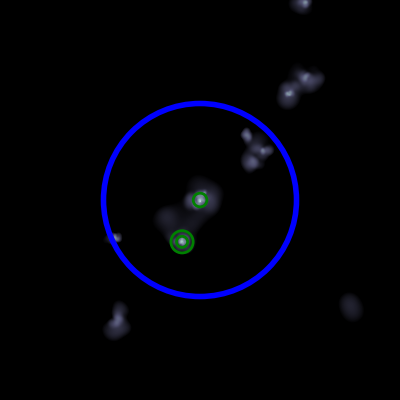
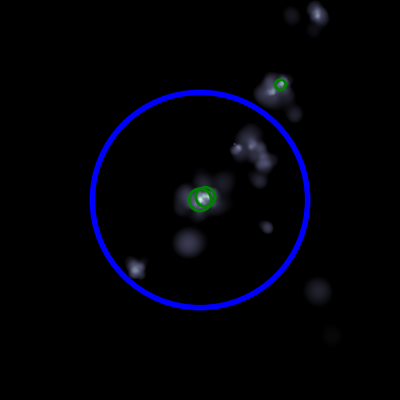
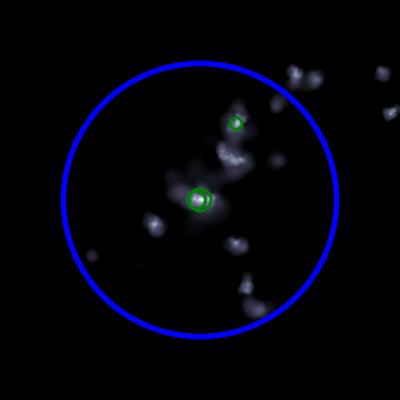
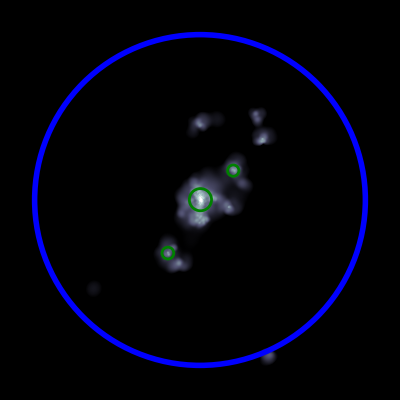
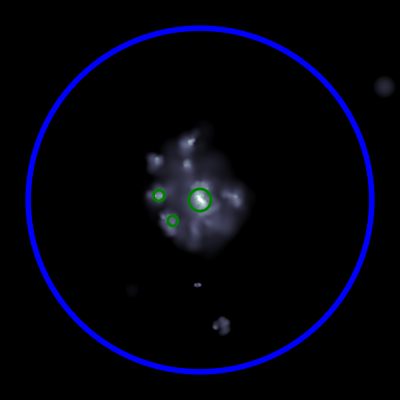
We look at the evolution of the environment around three typical host galaxies (the first three objects in the top row of figure 2) from to in figures 3-5. In the top row of these figures we plot the gas distribution, color coded by temperature. The middle row is the gas distribution color coded by the SFR and the bottom panel is the distribution of stars. The large blue circle denotes the virial radius of the halo and the smaller circles are black holes with the radius proportional to the mass of the black hole.
The SMBH in these examples have different growth histories, e.g. the first SMBH becomes feedback dominated at then grows again due to a merger at seen in figure 3. Apart from this SMBH the others grow to a mass of by Eddington limited accretion by . As seen in figures 4-5 these halos are continuously fed by cold streams down to , prior to the feedback dominated phase. At this redshift feedback from the black hole starts to inject energy but is not able to disrupt the stream. Star formation is still sustained at further down to . By feedback from the black hole starts to destroy the inner structure of the cold streams, inhibiting further growth; the SFR drops down by an order of magnitude of its peak value. There are still pockets of cold star-forming gas around the black hole, however the depleted gas due to star formation is no longer replenished by the cold streams. By the inner part of the smooth cold stream is mostly destroyed, the gas in the central region is heated to K and pushed out and dense subhalos which have been self-shielded from feedback contribute to the growth of the host galaxy and the central black hole, though at a much reduced rate.
|

|


|

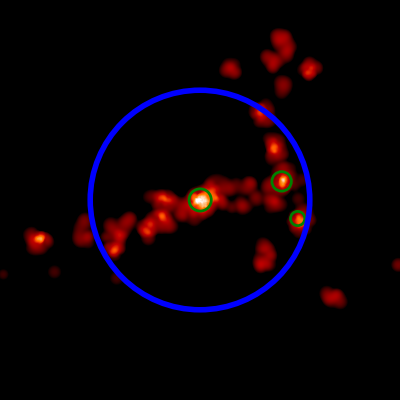


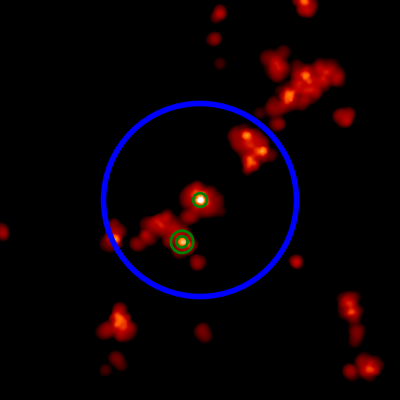
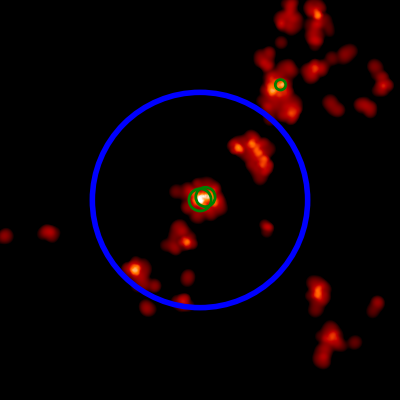


In the middle row of figures 3-5 we again look at the distribution of gas around the same object but now color coded by the SFR. The redshift of each panel is the same as in the top row. We find that the central region of the galaxy is forming most of the stars. Star formation also occurs in dense clumps of gas located on cold filamentary streams though at a much reduced rate. The central region has a sustained period of star formation down to for most objects. During this period the black hole has grown at the Eddington rate through smooth accretion of cold gas. From this inspection it appears that most star formation also occurs in the most centrally-located gas that also feeds the black hole which, as demonstrated previously (Di Matteo et al., 2011) is cold-flow fed.
At the star formation has dropped drastically in the central galaxy due to feedback from the central black hole. It appears that feedback eventually destroys the cold streams inside the halos; star formation still persists though at a reduced level in dense clumps surrounding the black hole. In the bottom row of figures 3-5 we look at the distribution of stars. As expected the locations of stars are preferentially found near star-forming gas particles (middle row). We are unable to accurately predict the morphologies of the galaxies due to the limited resolution of the simulation.
4.2 Growth of Host Galaxies Through Cold Streams
 |
Here we investigate the origin of the star forming gas in the quasar host galaxies. We will in particular test whether most of this star forming gas is indeed entering the halo via cold streams rather than cooling from a shock heated phase. We wish to point out that we do not characterise the redshift of accretion of these star-forming gas particles, but rather look at the origin of all the star-forming gas during the host galaxy’s peak star-forming activity.
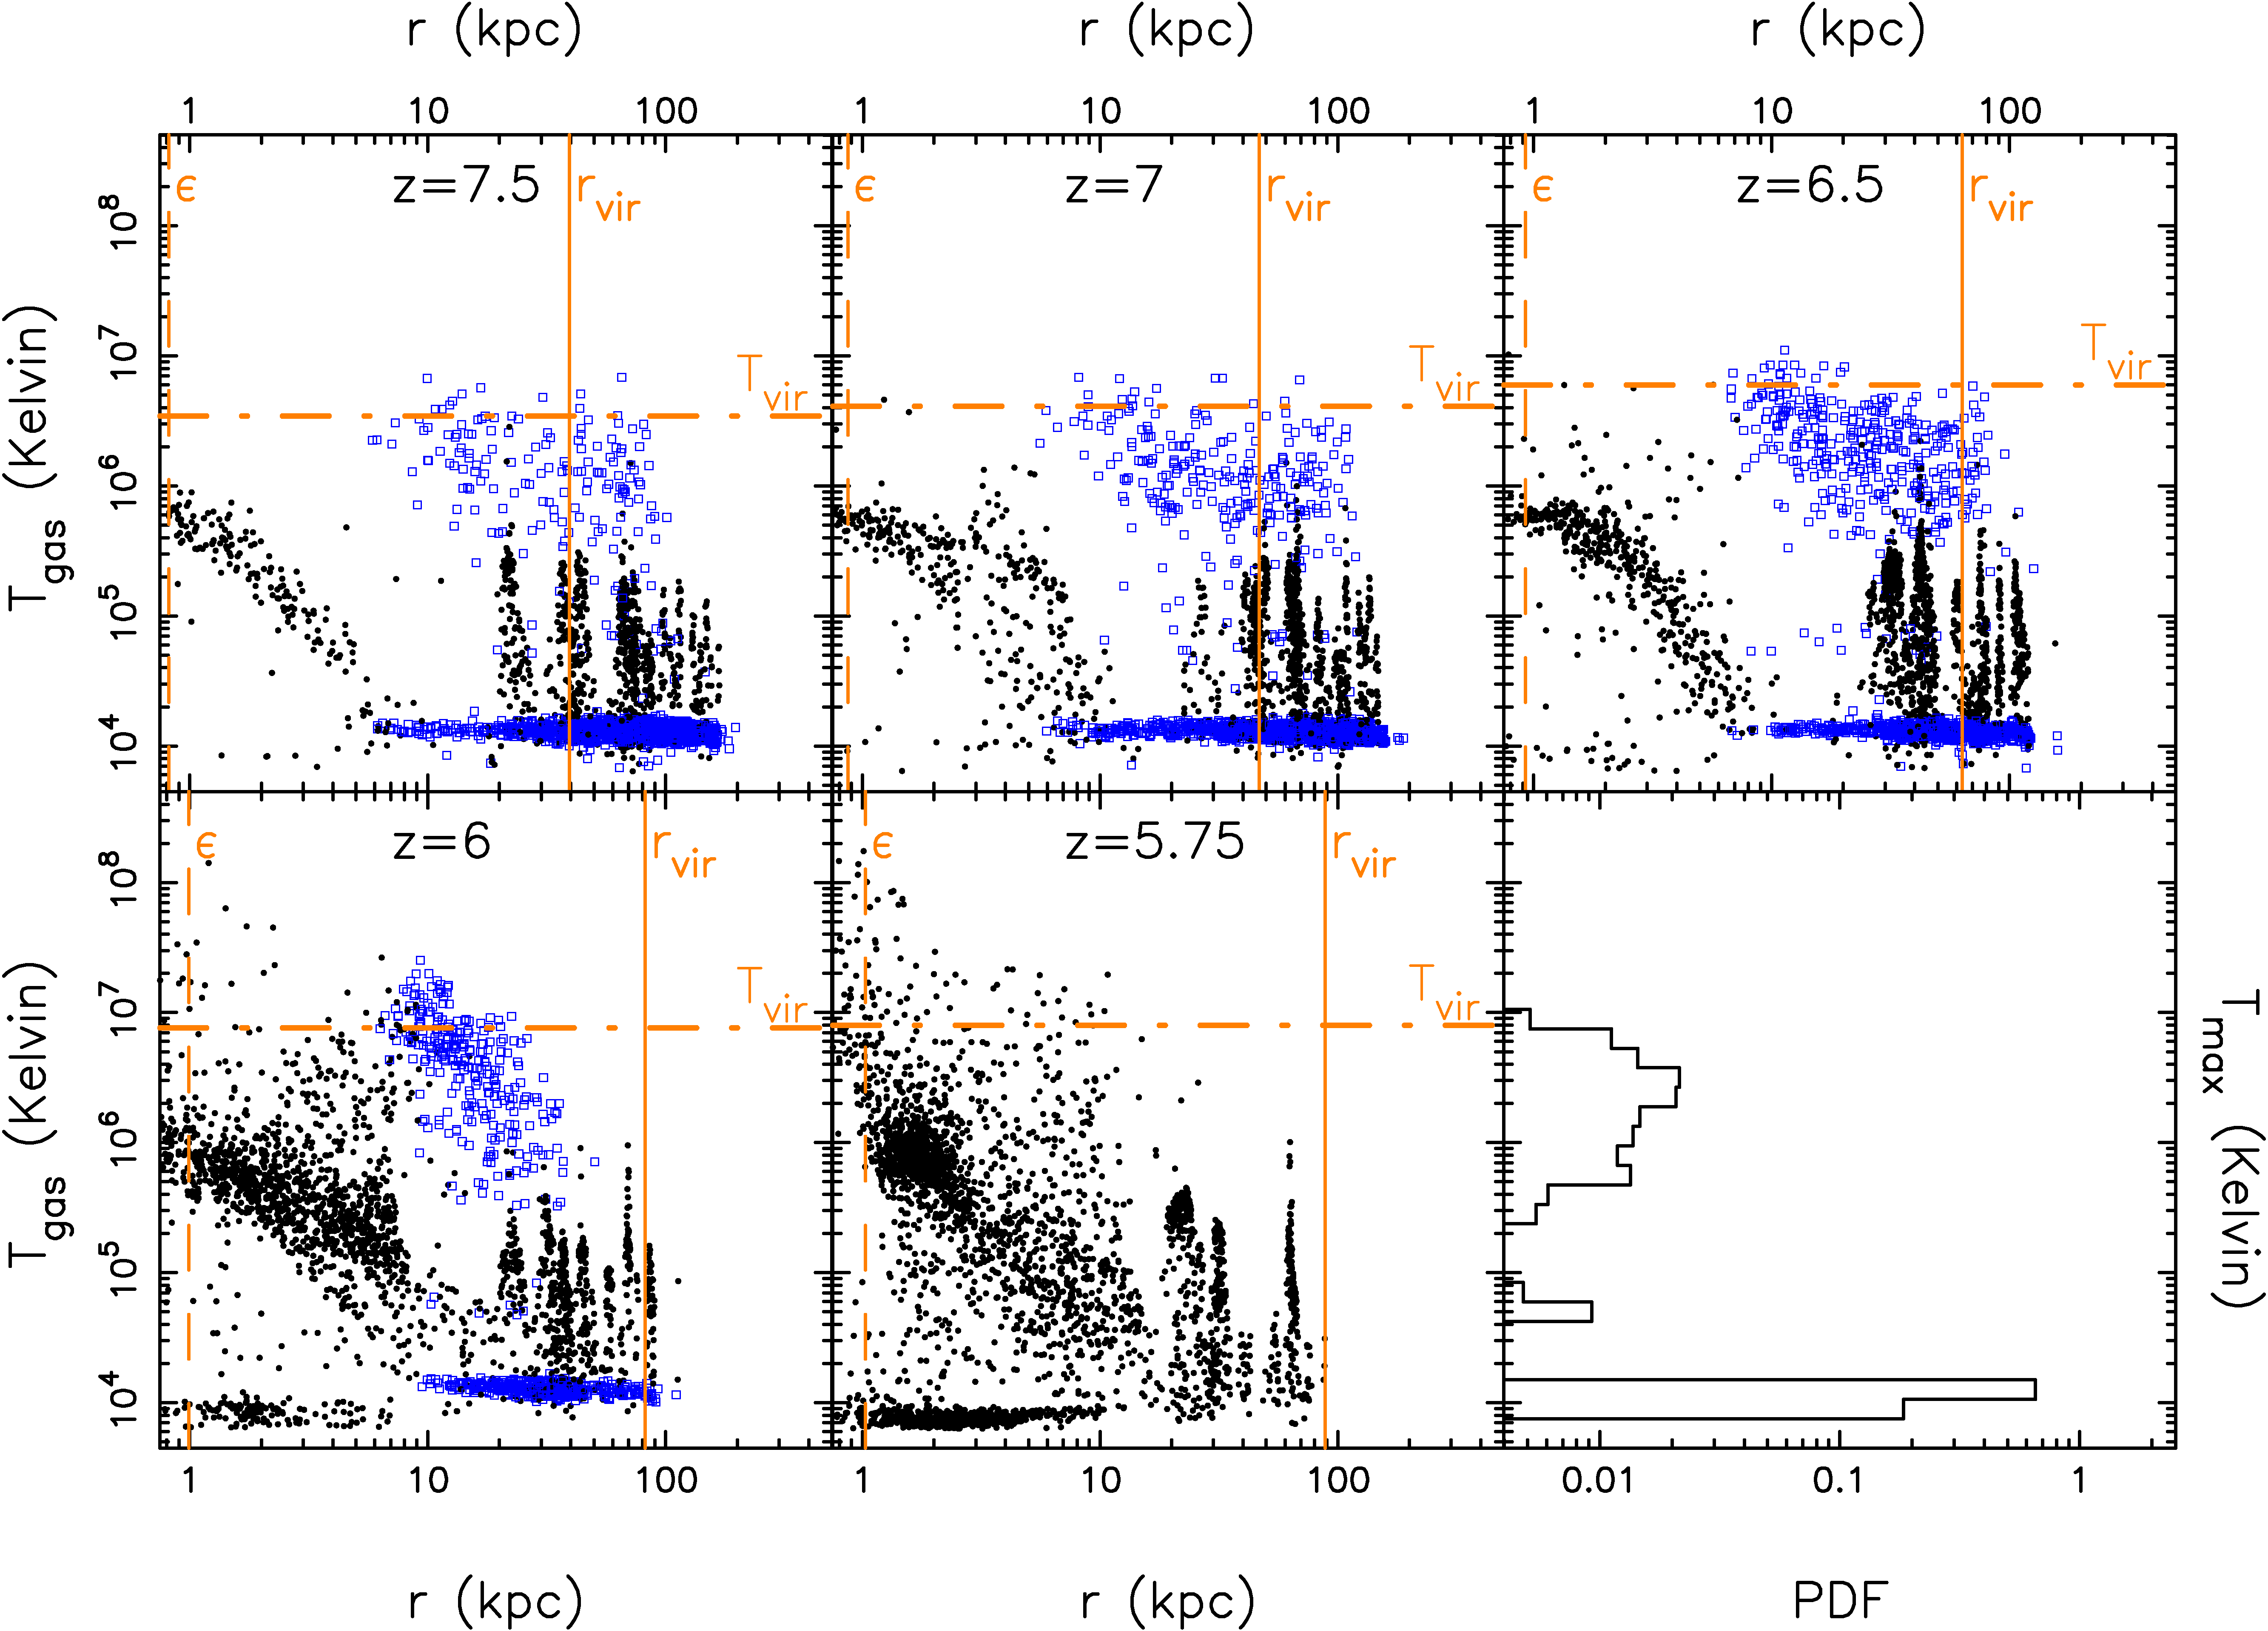
As an example, we look at the object in figure 5. We examine how the star-forming gas in the halo at its peak star-forming activity, i.e. at , was accreted. We trace the temperature histories of these star-forming gas particles back to and plot them as a function of (physical) separation from the SMBH, in figure 6. To make comparison with observations easier, in the discussion that follows all length scales are quoted in physical units. The temperatures represent the effective temperature for star-forming gas particles which are in the two-phase medium (Springel & Hernquist, 2003) and the temperature for non star-forming gas which are in the single phase medium.
In figure 6 the filled black circles denote star-forming gas particles and the open blue squares denotes the gas particles which have zero SFR. The horizontal dot-dashed line is the virial temperature, the vertical solid line is the virial radius and the vertical dashed line is the gravitational softening length. Prior to , one can identify four distinct regimes in the plots of the gas particles which end up forming stars in the halo: (1) a cold stream of non-star forming gas with temperatures of K beyond kpc, (2) clumps of star-forming gas outside kpc with temperatures K, (3) hot non-star forming gas outside kpc with temperatures K and finally (4) dense star-forming gas within kpc with temperatures K. Star formation only occurs in dense environments, i.e. at the centre of the halo and clumps located in filaments, this is also seen in figures 3-5. A further investigation reveals that the cold non star-forming gas (with K) is also located in filaments whereas the hot non star-forming gas is diffuse and spread out across the halo.
As can be seen in figure 6 most of the gas that is star-forming at does not come from the diffuse hot medium. The major mode of gas accretion for the host galaxy is from gas in filamentary streams. The streams have two components, dense star forming clumps and cold non star-forming gas that penetrates deep into the halo well within the 10 kpc region of the central black hole. At this point gas is dense enough to form stars in the central galaxy and also fuel the growth of the black hole. The mass of gas in star forming clumps in the stream is small compared to the cold non-star forming gas in the stream. Feedback from supernovae and the black hole heats up the gas at the centre, so that the temperature systematically increases to K with decreasing separation. This mode of accretion continues down to .
Eventually by the black hole has injected enough energy into the surrounding medium to destroy the cold stream supplying gas to the central galaxy. The black hole’s growth has become self-regulated. The black hole has also regulated the growth of its host. We find little star-formation within 3 kpc of the black hole, but a residual amount of dense gas is still clumped in the region with 10 kpc, so that star-formation still persists in this part of the central galaxy.
A sustained period of cold accretion is largely responsible for the high SFR for most objects. The exception is the first object in figure 2 where a merger at is responsible for increasing the SFR. As seen in figures 3-5 star formation occurs only in dense regions, i.e. mostly in the central halo and at a reduced level in dense clumps within filaments. At its peak, of star formation occurs within the 3 kpc region of the central galaxy. The numbers quoted for this example are representative of those for the full sample, fluctuating by only a few percent for the other galaxies.
We track the entire temperature history of the star-forming gas particles of the host galaxy at its peak star-forming phase, i.e. at . We define as the maximum temperature that a gas particles attains prior to its first star-forming phase, i.e. prior to it first being in a two-phase medium (Kereš et al., 2005, 2009). A distribution of will then indicate whether these gas particles were accreted through the hot or cold mode (Kereš et al., 2005, 2009). This is shown in the bottom right panel of figure 6. As can be seen the majority () of the star-forming gas is accreted through the cold mode, the remaining gas () comes from gas which has been heated while accreting onto the halo and then cools to form stars. These hot gas particles are the same as the diffuse hot non star-forming gas seen in the first four panels of figure 6. The numbers presented here represent a lower bound for cold mode accretion for star-forming gas, since a larger fraction of star-forming gas particles prior to should have accreted onto the halo through the cold mode. We find that if we considered all the gas, not distinguishing between star-forming and non star-forming gas, then of the gas at is accreted cold and is accreted through the hot mode.
The analysis presented here indicates that the quasar host galaxies are forming stars very efficiently. The massive star formation is sustained through a supply of gas mostly from cold streams, that are able to penetrate the halo and reach the center without being heated to the virial temperature of the halo consistent with earlier work at lower redshift (Dekel et al., 2009). A smaller fraction of gas does get heated to to finally cool and form stars. At its peak of the star-formation is occurring within a 3 kpc region of the central halo, consistent with observations (Walter et al., 2004, 2009; Wang et al., 2010).

4.3 Comparison with Observations
In this section, we compare properties of quasar hosts in the MassiveBlack simulation with recent observations (Wang et al., 2010). These observations specifically constrain observables for the host galaxies such as SFR, molecular gas , and the relation. Additionally we look at the relation for the host galaxies in the MassiveBlack simulation and compare it with the local relation in observations.
4.3.1 Star Formation Rates and Cold Gas
The reprocessed emission in the far-infrared (FIR) from star formation-heated dust is used to provide an estimate of the star formation from observations of quasar host galaxies (Wang et al., 2008). The AGN contribution is removed and the remaining FIR luminosities, , are then converted to a SFR (Wang et al., 2010, 2011), using
| (1) |
The sample of quasar host galaxies in the observations of Wang et al. (2010, 2011) fall in the redshift range . We compile the SFR of the quasar hosts in our simulation (the ones in Figure 2) and compare it with the observations in the left panel of Figure 7. We find that most of these host galaxies have a peak SFR in the redshift range , comparable to the observed SFR of quasar host galaxies. However our model seems to lack objects close to the observed SFR of for some host galaxies. It is of course possible that our star formation model is somewhat simplistic, particularly at these redshifts, since we do not model star formation from molecular gas (e.g., Krumholz & Gnedin (2011)). Further investigation of the star formation modelling is beyond the scope of this paper so instead we prefer to compare directly to associated measurements of the cold and molecular gas, which is what the observations can constrain.
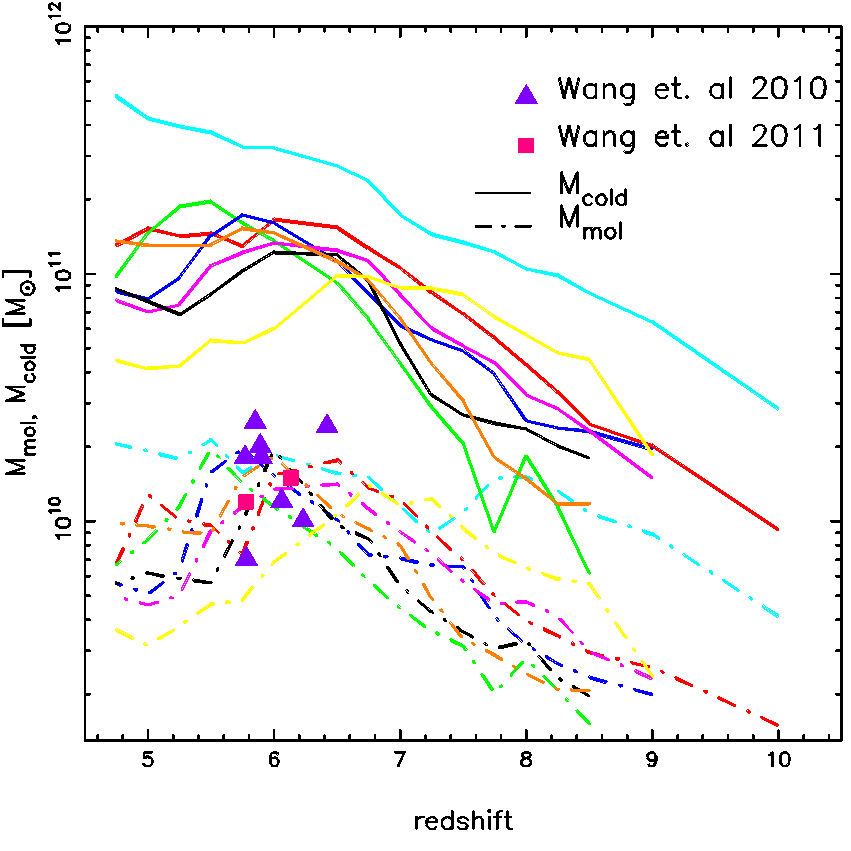
In the right panel of figure 7 we plot the cold gas mass, , of the host. We find that the the evolution of broadly follows the trend seen in the SFR. Observations on the other hand probe the molecular gas mass, of these hosts which are not directly modeled in our simulations.
The size of the cold molecular gas reservoir which fuels star formation in these observed quasar host galaxies has been estimated through redshifted CO emission, (Bertoldi et al., 2003; Walter et al., 2003; Carilli et al., 2007; Wang et al., 2010). These studies indicate molecular gas masses of in these objects. Since our simulations do not model molecular gas instead estimate the amount of molecular gas by using the SFR as a proxy for , i.e. by converting the SFR to , eq. 1 and using the relation between the CO (1-0) line luminosity, , and for local star-forming systems such as local starburst spiral galaxies, Ultra Luminous Infra Red Galaxies (ULIRGs) and high-z submillimeter galaxies (SMGs) (Solomon & Vanden Bout, 2005).
| (2) |

|
can then be converted to a cold molecular gas mass with (Wang et al., 2010). Using these relations we look at the evolution of molecular gas for quasar host galaxies in the MassiveBlack simulation and compare them with observations (Wang et al., 2010, 2011) in the right panel of figure 7 shown as dot-dashed lines. Here again we find that we are able to reproduce the amount of molecular gas in these galaxies at redshifts . The estimates are in better agreement than the observed SFR. Wang et al. (2010) also find that quasar hosts lie above the local - relation and attribute it to unknown AGN contributions to and different dust temperatures and CO line ratios, even though they attempt to correct for AGNs.
The ratio between and is typically 10%. This is much higher than 1% seen in observations of local galaxies (Obreschkow & Rawlings, 2009). This indicates that quasar host galaxies are forming stars mores efficiently than local galaxies.
4.3.2 The and the relation
We now look at the evolution of and the relation between the central black hole and its host galaxy, where is the velocity dispersion of the bulge, for which we use the velocity dispersion of stars within the half-mass radius as a proxy. Given that the black hole grows faster than its host, as seen in figure 2 we expect to see these relations to be steeper than the local relations, e.g. Tremaine et al. (2002); Häring & Rix (2004).
The evolution of the relation (solid line) is shown in the left panel of figure 8 for the MassiveBlack sample. Comparison is made to the best fit local relation (dotted line) (Tremaine et al., 2002) and observations of quasar-host systems (triangles) (Wang et al., 2010). In this panel we show the evolution up to (solid lines) in order to better compare with observations at these redshifts and further down to (dot-dashed lines). Since the inclination angle is degenerate with the CO linewidths, an average inclination angle of was assumed (Wang et al. (2010), filled triangles); the open triangles relax this constraint. As expected we see that the black holes grow more rapidly than their host galaxies and eventually end up above the local relation of (Tremaine et al., 2002). By the relation compares reasonably well with observations which assumes an inclination angle. However observations indicate that there is an object with km/s and even when the assumption of inclination angle is considered. We do not find such an object within our sample and this discrepancy may have to do with the uncertainties in the inclination angle.
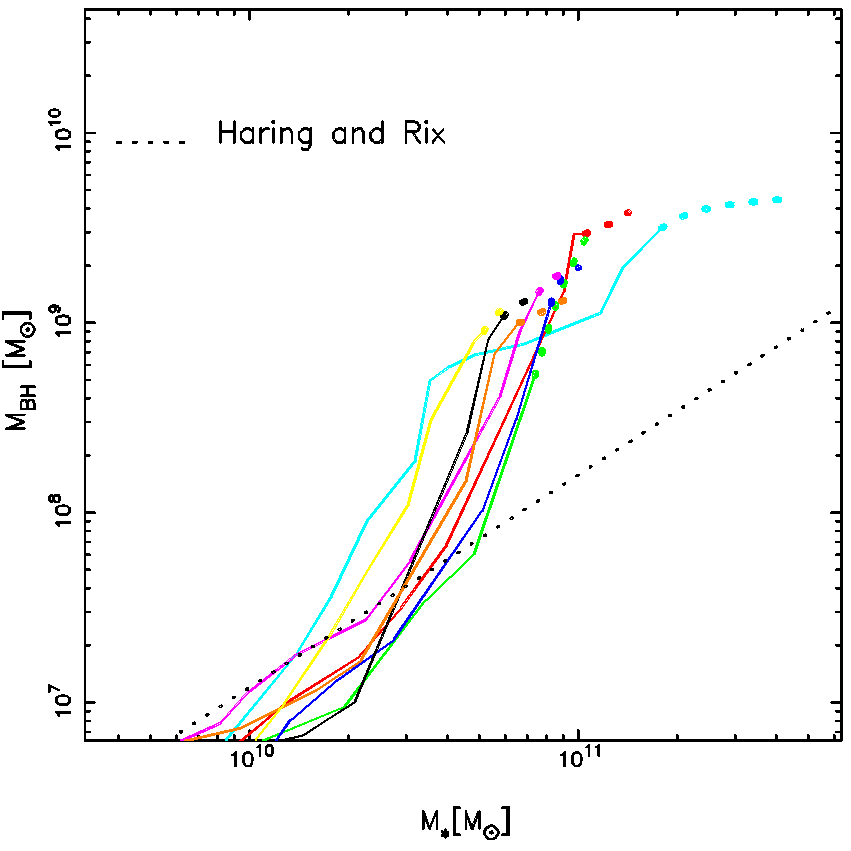
Next we look at the evolution of the relation in the MassiveBlack simulation (solid lines) and compare with the best fit local relation of Häring & Rix (2004) (dotted line) in the right panel of figure 8. Again consistent with previous properties such as the SFR- relation and the relation we find that the black hole is assembled more rapidly than the central host galaxy so that the relation is well above the local relation of Häring & Rix (2004). It would be interesting with future simulations to see what mechanisms eventually drive them to the local relation.
The steep growth of which outpaces the stellar component of the host galaxy is common for all these systems and is again consistent with the fact that the accretion rate of the black hole as a function of redshift has a steeper slope than the SFR. The cyan and red lines in figure 8 correspond to the first two objects of in the top row of figure 2. A closer inspection shows that these objects undergo relatively dry mergers with subhalos in the feedback dominated phase. The subhalo has a larger stellar component compared to gas and therefore during this merger both and grow more rapidly than . This can be seen as a relative flattening of the and relation in figure 8. It is plausible that dry mergers are responsible for eventually bringing the high redshift and relations onto the well constrained local relation (Tremaine et al., 2002; Häring & Rix, 2004)
5 Conclusions
MassiveBlack has been successful in reproducing a number of important properties of quasars at high redshift within observational constraints: (i) the formation and abundances of Sloan-type black holes of mass at (Di Matteo et al., 2011), (ii) statistical properties such as the luminosity function of quasars and its evolution as well as their high-redshift clustering (DeGraf et al., 2011). Importantly MassiveBlack has indicated that cold flows can sustain the growth of black holes at Eddington rates so that they attain masses of in a short time span (Di Matteo et al., 2011).
In this paper we have looked at the formation of galaxies hosting these quasars with the MassiveBlack simulation. We are able to reproduce a number of observational properties of these galaxies. We summarize our findings below:
-
•
We find good agreement between the theoretical GSMF produced by MassiveBlack and observations at and .
-
•
At , black holes are already in place. The growth of the black hole and its host galaxy are strongly correlated. The black hole regulates the growth of its host galaxy.
-
•
Black holes grow faster than the host galaxy and this is reflected in the deviations seen in our study from the local relation and relation; our results are however consistent with observational findings for these deviations at .
-
•
The cold streams that feed the black hole are also responsible for feeding the host galaxy to sustain the excessive starburst in them. The accretion of gas, which eventually form stars in the host, through the hot mode is subdominant ( ), the dominant fraction being accreted cold during their history.
-
•
Host galaxies grow in extreme environments. We are able to reproduce the high SFR of seen in observations in redshifts . Our simulation suggests that the observed galaxies are at the peak of their star-formation activity at these epochs.
-
•
Our derived estimates of molecular gas in these galaxies are consistent with observations. Such large reservoirs of cold molecular gas, are responsible for fuelling star-formation in these galaxies.
-
•
Using the SFR as a proxy for we find that the ratio of molecular and cold gas is larger than seen for local galaxies. This again indicates the host galaxies are forming stars more efficiently than their local counterparts.
- •
-
•
Given that we are able to reproduce observations between our simulations suggests that these quasars and their host galaxies are seen at the peak of their assembly.
From the results presented here we expect that compared to the local Universe the relation is very different in the high redshift Universe. This has been indicated in earlier work (Di Matteo et al., 2008), though the sample was too small to put strong constraints on the relation at and above. Given the large volume and high resolution (hence large sample of galaxies and black holes) MassiveBlack is well suited for predicting the evolution of the and relations at and above. It would also be interesting to look at the mechanisms responsible for their evolution. We will address these issues in subsequent work.
Acknowledgments
This work was supported by NSF award OCI-0749212. This research was supported by an allocation of advanced computing resources provided by the National Science Foundation. The computations were performed on Kraken at the National Institute for Computational Sciences (http://www.nics.tennessee.edu). NK would like to thank Volker Springel for useful comments on the manuscript.
References
- Begelman, Volonteri, & Rees (2006) Begelman M. C., Volonteri M., Rees M. J., 2006, MNRAS, 370, 289
- Bertoldi et al. (2003) Bertoldi F., et al., 2003, A&A, 409, L47
- Bondi & Hoyle (1944) Bondi H., Hoyle F., 1944, MNRAS, 104, 273
- Bondi (1952) Bondi H., 1952, MNRAS, 112, 195
- Booth & Schaye (2009) Booth C. M., Schaye J., 2009, MNRAS, 398, 53
- Bouwens et al. (2011a) Bouwens R. J., et al., 2011, ApJ, 737, 90
- Bouwens et al. (2011b) Bouwens R. J., et al., 2011, arXiv, arXiv:1105.2038
- Bouwens et al. (2011c) Bouwens R. J., et al., 2011, Natur, 469, 504
- Bromm & Loeb (2003) Bromm V., Loeb A., 2003, ApJ, 596, 34
- Bromm & Larson (2004) Bromm V., Larson R. B., 2004, ARA&A, 42, 79
- Carilli et al. (2007) Carilli C. L., et al., 2007, ApJ, 666, L9
- Chatterjee et al. (2011) Chatterjee S., DeGraf C., Richardson J., Zheng Z., Nagai D., Di Matteo T., 2011, arXiv, arXiv:1104.3550
- Colberg & Di Matteo (2008) Colberg J. M., Di Matteo T., 2008, MNRAS, 387, 1163
- Croft et al. (2009) Croft R. A. C., Di Matteo T., Springel V., Hernquist L., 2009, MNRAS, 400, 43
- Dale & Helou (2002) Dale D. A., Helou G., 2002, ApJ, 576, 159
- Davis et al. (1985) Davis M., Efstathiou G., Frenk C. S., White S. D. M., 1985, ApJ, 292, 371
- Dekel & Birnboim (2006) Dekel A., Birnboim Y., 2006, MNRAS, 368, 2
- Dekel et al. (2009) Dekel A., et al., 2009, Nature, 457, 451
- Degraf, Di Matteo, & Springel (2010) Degraf C., Di Matteo T., Springel V., 2010, MNRAS, 402, 1927
- Degraf, Di Matteo, & Springel (2011) Degraf C., Di Matteo T., Springel V., 2011, MNRAS, 413, 1383
- Degraf et al. (2011) Degraf C., Oborski M., Di Matteo T., Chatterjee S., Nagai D., Richardson J., Zheng Z., 2011, MNRAS, 1136
- DeGraf et al. (2011) DeGraf C., Di Matteo T., Khandai N., Croft R., Lopez J., Springel V., 2011, arXiv, arXiv:1107.1254
- Di Matteo et al. (2011) Di Matteo T., Khandai N., DeGraf C., Feng Y., Croft R., Lopez J., Springel V., 2011, arXiv, arXiv:1107.1253
- Di Matteo, Springel, & Hernquist (2005) Di Matteo T., Springel V., Hernquist L., 2005, Natur, 433, 604
- Di Matteo et al. (2008) Di Matteo T., Colberg J., Springel V., Hernquist L., Sijacki D., 2008, ApJ, 676, 33
- Fan et al. (2006) Fan X., et al., 2006, AJ, 132, 117
- Ferrarese & Merritt (2000) Ferrarese L., Merritt D., 2000, ApJ, 539, L9
- Gebhardt et al. (2000) Gebhardt K., et al., 2000, ApJ, 539, L13
- Graham et al. (2001) Graham A. W., Erwin P., Caon N., Trujillo I., 2001, ApJ, 563, L11
- González et al. (2011) González V., Labbé I., Bouwens R. J., Illingworth G., Franx M., Kriek M., 2011, ApJ, 735, L34
- Häring & Rix (2004) Häring N., Rix H.-W., 2004, ApJ, 604, L89
- Hopkins, Richards, & Hernquist (2007) Hopkins P. F., Richards G. T., Hernquist L., 2007, ApJ, 654, 731
- Hoyle & Lyttleton (1939) Hoyle F., Lyttleton R. A., 1939, PCPS, 34, 405
- Jaacks, Choi, & Nagamine (2011) Jaacks J., Choi J.-H., Nagamine K., 2011, arXiv, arXiv:1104.2345
- Jiang et al. (2009) Jiang L., et al., 2009, AJ, 138, 305
- Johansson, Naab, & Burkert (2008) Johansson P. H., Naab T., Burkert A., 2008, AN, 329, 956
- Kereš et al. (2005) Kereš D., Katz N., Weinberg D. H., Davé R., 2005, MNRAS, 363, 2
- Kereš et al. (2009) Kereš D., Katz N., Fardal M., Davé R., Weinberg D. H., 2009, MNRAS, 395, 160
- Krumholz & Gnedin (2011) Krumholz M. R., Gnedin N. Y., 2011, ApJ, 729, 36
- Labbé et al. (2010) Labbé I., et al., 2010, ApJ, 716, L103
- Lauer et al. (2007) Lauer T. R., Tremaine S., Richstone D., Faber S. M., 2007, ApJ, 670, 249
- Li et al. (2007) Li Y., et al., 2007, ApJ, 665, 187
- Lopez et al. (2011) Lopez, J., Degraf C., Di Matteo T., Fu Bin, Fink E. Gibson, G., 2011, in Statistical and Scientific Databases Management Conference (SSDBM), Portland, OR
- Magorrian et al. (1998) Magorrian J., et al., 1998, AJ, 115, 2285
- Marconi & Hunt (2003) Marconi A., Hunt L. K., 2003, ApJ, 589, L21
- Obreschkow & Rawlings (2009) Obreschkow D., Rawlings S., 2009, MNRAS, 394, 1857
- Oesch et al. (2011) Oesch P. A., et al., 2011, arXiv, arXiv:1105.2297
- Mortlock et al. (2011) Mortlock D. J., et al., 2011, Natur, 474, 616
- Salvaterra, Ferrara, & Dayal (2011) Salvaterra R., Ferrara A., Dayal P., 2011, MNRAS, 414, 847
- Shakura & Sunyaev (1973) Shakura N. I., Sunyaev R. A., 1973, A&A, 24, 337
- Shen et al. (2009) Shen Y., et al., 2009, ApJ, 697, 1656
- Sijacki et al. (2007) Sijacki D., Springel V., Di Matteo T., Hernquist L., 2007, MNRAS, 380, 877
- Sijacki, Springel, & Haehnelt (2009) Sijacki D., Springel V., Haehnelt M. G., 2009, MNRAS, 400, 100
- Solomon & Vanden Bout (2005) Solomon P. M., Vanden Bout P. A., 2005, ARA&A, 43, 677
- Springel et al. (2001) Springel V., White S. D. M., Tormen G., Kauffmann G., 2001, MNRAS, 328, 726
- Springel & Hernquist (2003) Springel V., Hernquist L., 2003, MNRAS, 339, 289
- Springel, Di Matteo, & Hernquist (2005) Springel V., Di Matteo T., Hernquist L., 2005, MNRAS, 361, 776
- Springel (2005) Springel V., 2005, MNRAS, 364, 1105
- Tremaine et al. (2002) Tremaine S., et al., 2002, ApJ, 574, 740
- Volonteri & Rees (2006) Volonteri M., Rees M. J., 2006, ApJ, 650, 669
- Wang et al. (2008) Wang R., et al., 2008, ApJ, 687, 848
- Wang et al. (2010) Wang R., et al., 2010, ApJ, 714, 699
- Wang et al. (2011) Wang R., et al., 2011, AJ, 142, 101
- Walter et al. (2003) Walter F., et al., 2003, Natur, 424, 406
- Walter et al. (2004) Walter F., Carilli C., Bertoldi F., Menten K., Cox P., Lo K. Y., Fan X., Strauss M. A., 2004, ApJ, 615, L17
- Walter et al. (2009) Walter F., Riechers D., Cox P., Neri R., Carilli C., Bertoldi F., Weiss A., Maiolino R., 2009, Natur, 457, 699
- Yoshida et al. (2006) Yoshida N., Omukai K., Hernquist L., Abel T., 2006, ApJ, 652, 6