GeV Gamma-ray Emission from the Binary PSR B1259-63/SS2883 During the 2010 Periastron Passage
Abstract
PSR B1259-63/SS2883 is a binary system which consists of a 48-ms radio pulsar and a massive star in a highly eccentric orbit with a period of about 3.4 years. Non-pulsed and non-thermal emissions from this binary have been reported in the radio, X-ray and TeV gamma-ray energy ranges. Light curves in the radio and X-ray bands showed characteristic double-peaked features which can be attibuted to the interactions of the pulsar wind and the Be disk during the crossings by the pulsar. The TeV light curves around periastron differ between 2004 and 2007 observations, and the feature is not conclusive. We report a detection of GeV gamma-ray emission around the periastron passage in December 2010 with Fermi-LAT.
I INTRODUCTION
The PSR B1259-63/SS2883 system is one of a few binary systems detected in TeV gamma-ray energies. Gamma-rays should be emitted via interaction of high-speed wind from the 48-ms pulsar with the Be star wind and disk. The elliptic orbit with long (3.4-yr) period offers a unique experimental field of wind interaction with varying distance between the pulsar and the Be star Kaw04 ; Oka11 . In 2004 and 2007, H.E.S.S. detected TeV gamma-rays as a marginal pre-periastron peak and a clear post-periastron peak Aha05 ; Ace09 . We studied the 2010 periastron (December 14) passage in GeV gamma-rays using the Fermi-LAT data and compared the result with SPH simulation Oka11 .
II FERMI-LAT OBSERVATION
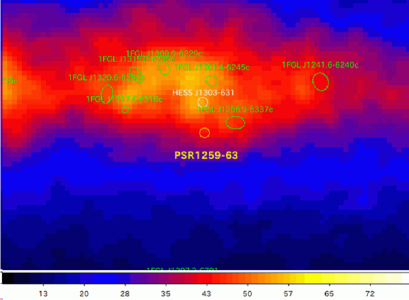
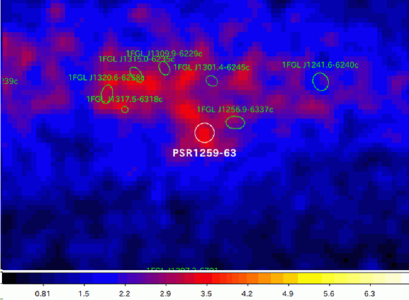
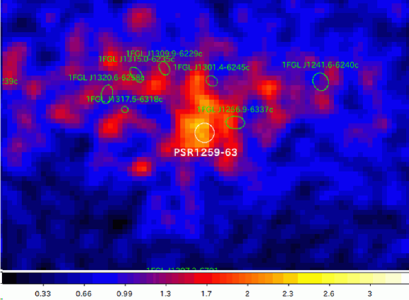
Fermi-LAT data were obtained via Fermi Science Support Center and analyzed using the Fermi Science Tools (v9r17p0) with P6_V3_DIFFUSE instrument response function by the standard pipeline FSSC . Examples of countmaps are shown in Figures 1 to 3. For the whole observation period (August 4, 2008 – February 9, 2011) the gamma-ray signal from PSR 1259-63/SS2883 is not signifincant (Figure 1). Howerver, in the month after the periastron passage (December 22, 2010 – January 21, 2011) there is a hint of signal (Figure 2) with a TS (test statistic) value of 5 (which means it is significant at level) and in the following month (January 21, 2011 – February 9, 2011) the gamma-ray signal is highly significant (Figure 3) with a TS value of 58 ( level).
III LIGHT CURVES
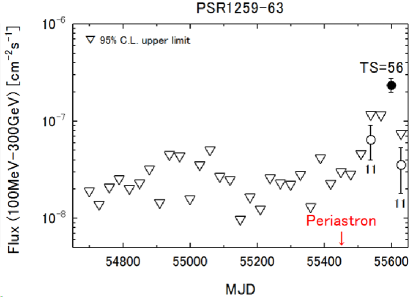
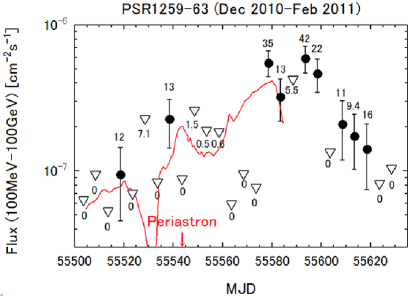
Light curves in 30-day bins and 5-day bins (assuming spectrum) are calculated with the help of Tools as shown in Figures 4 (30-day bin) and 5 (5-day bin). We detected gamma-ray signal between 30 days and 65 days after the periastron, although there is a hint of emission 20 days and 5 days before the periastron. We can compare the light curve with a predicted curve shown in red lines in Figure 5 (arbitrary scaled) which is calculated by SPH simulation of interaction between the pulsar and the Be star Tak11 . The general tendency of the observed light curve is not inconsitent with prediction.
IV DISCUSSION
We found a significant GeV gamma-ray signal from this system between 30 days and 65 days after the periastron. Emission in this epoch should be related to the time-varying geometry of this system. We will compare the gamma-ray light curves and spectra with simulation Tak11 to understand the emission from this binary system.
After the analysis presented here has been completed, we found similar results from Fermi-LAT data have been reported Tam11 ; Abd11 .
Acknowledgements.
This work is supported in part by the Grant-in-Aid from the Ministry of Education, Culture, Sports, Science and Technology (MEXT) of Japan, No. 22540315.References
- (1) Kawachi, A., Naito, T., Patterson, J.R. et al., ApJ, 607, 949 (2004)
- (2) Okazaki, A.T., Nagataki, S., Naito, T., Kawachi, A., Hayasaki, K., Owocki, S.P. and Takata, J., PASJ 63, 893 (2011)
- (3) http://fermi.gsfc.nasa.gov/ssc/
- (4) Aharonian, F. et al., A&A, 442, 1 (2005)
- (5) Acero, F. et al., A&A, 507, 389 (2009)
- (6) Takata, J., Okazaki, A.T., Nagataki S., Naito, T., Kawachi, A., Lee S.-H., Mori, M., Hayasaki, K., Yamaguchi, M.S., Owocki, S.P., submitted for publication
- (7) Tam, P.H. et al., ApJ 736, L10 (2011)
- (8) Abdo, A.A. et al., ApJ 736, L12 (2011)