Radio Variability Studies of Gamma-Ray Blazars with the OVRO 40 m Telescope
Abstract
Since late 2007, we have been monitoring a large sample of known and likely gamma-ray–loud blazars at 15 GHz twice per week with the Owens Valley Radio Observatory (OVRO) 40 m Telescope. Our initial sample included the 1158 sources above declination from the Candidate Gamma-Ray Blazar Survey (CGRaBS), and we have since added nearly 400 more sources, including all blazars associated with Fermi Large Area Telescope (LAT) detections in the First AGN Catalog (1LAC). Here, we describe the new sample and present results for 2008 through early 2011. Using statistical likelihood analyses, we compare the variability amplitude for various sub-populations within our sample. These include comparisons of gamma-ray–loud versus gamma-ray–quiet objects, BL Lac objects versus flat-spectrum radio quasars, and a study of the variability amplitude trend with redshift. We also describe KuPol, the new digital Ku-band receiver being constructed for the 40 m telescope. This new receiver will provide total intensity and linear polarization measurements over the 12–18 GHz band, with 16 MHz spectral resolution.
I INTRODUCTION
Blazars are the most extreme class of active galactic nuclei (AGN), probably resulting when an AGN is viewed along its relativistic jet axis. Although a variety of models have been proposed, and despite decades of observation, many fundamental questions about blazars and AGN physics remain open. Among them:
-
•
How are jets launched, accelerated, collimated, and confined?
-
•
Of what are the jets composed?
-
•
Where in the jet are the observed photons emitted?
-
•
What are the details of the emission mechanisms?
Gamma-rays are our best tool for probing the most extreme processes within AGN, and coordinated multiwavelength observations are crucial to the interpretation of gamma-ray data.
I.1 OVRO 40 m Program
Since late 2007, we have undertaken a continuous, fast-cadence (twice weekly per source) monitoring program beginning with the systematically-selected sample of 1158 blazars north of from the Candidate Gamma-Ray Blazar Survey (CGRaBS) healey_cgrabs:all-sky_2008 . The sample has grown to more than 1550 sources, including all 454 “clean” AGN associations from the first-year Fermi Large Area Telescope (LAT) AGN catalog (1LAC) abdo_first_2010 . Newly LAT-detected AGN are added to the sample as well. Results for the CGRaBS sample during the 2008–2009 period are presented and analyzed and the program is described in detail in richards_blazars_2011 . Radio light curves for the CGRaBS sample are available to the public for download from http://www.astro.caltech.edu/ovroblazars.
II RADIO VARIABILITY
To provide a robust measure of the amplitude of variability observed in a light curve, we introduced the intrinsic modulation index, , where and are the standard deviation and mean that would be measured for a light curve using a noiseless receiver with perfect sampling. In richards_blazars_2011 we derive a likelihood method for estimating and its uncertainty from an observed light curve. Unlike the various measures of variability amplitude commonly used in the literature, the intrinsic modulation index provides a rigorous measure of its uncertainty which is essential for statistical comparisons.
We computed for each CGRaBS source using two years of data in richards_blazars_2011 . Using 3.2 years of data, we find that the intrinsic modulation index for each source is typically either consistent within uncertainties or is found to be larger with the longer data set. An examination of the sources with the most significant changes shows that the significant increases typically occur in sources that demonstrated no or little variability during the first two years and subsequently exhibited a major flare or change in brightness. This suggests that the two-year data set was simply not long enough to capture the full range of variability behavior of the sources. Previous findings indicate that 4–6 year or longer timescales for flaring activity are common in blazars (e.g., hovatta_statistical_2007, ), so further increases in the modulation indices are likely as the monitoring program continues.
II.1 Population Studies
In richards_blazars_2011 , we found strong () evidence that the gamma-ray–loud subset of CGRaBS (i.e., those sources that appeared in the 1LAC catalog) was, on average, more variable at 15 GHz than was the gamma-ray–quiet subset (see Figure 1). This trend persists in the longer data set with similar significance. This establishes the first rigorous demonstration of a connection between gamma-ray emission and radio variability amplitudes in blazars.

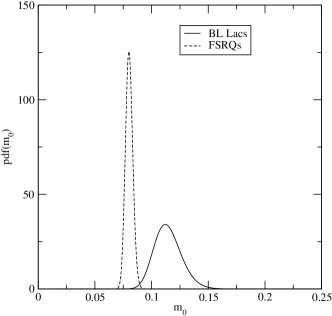
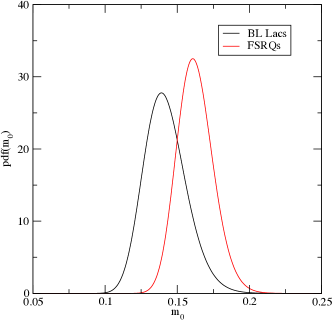
In Figure 2, we compare the two-year variability amplitudes for CGRaBS sources identified as BL Lac objects with those identified as flat-spectrum radio quasars (FSRQs). The BL Lac objects are found to vary more strongly than the FSRQs with significance. A similar result is found with the longer data set for CGRaBS sources. However, for the 1LAC sample, using 3.2 years of data we find the BL Lac objects and FSRQs to be consistent with the same variability amplitude within (see Figure 3). Further study of this effect in richards_thesis_2012 suggests that the gamma-ray–loud FSRQs are much more radio variable than gamma-ray–quiet FSRQs whereas BL Lac objects display similar radio variability whether or not gamma-ray–loud.
II.2 Redshift Trend
To examine the relationship between radio variability amplitude and redshift, we restrict our sample to the FSRQs. This is necessary because the lack of optical lines in BL Lac objects makes redshift determination difficult, resulting in or less redshift completeness in our sample. This also prevents the difference in variability already found between BL Lac objects and FSRQs from contaminating our comparison. In richards_blazars_2011 , we found an apparent trend of decreasing variability amplitude with increasing redshift, shown in Figure 4. A comparison of bright () FSRQs at with those at found the lower-redshift FSRQs to be more variable with significance richards_blazars_2011 .
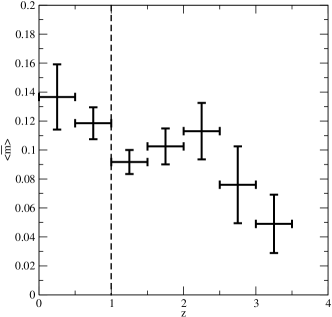
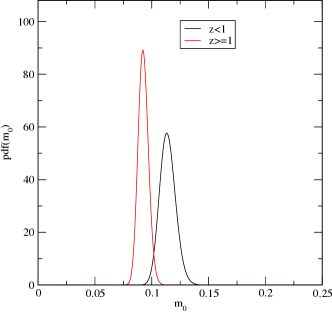
While this trend continues with the 3.2 year CGRaBS data, the significance of the difference is less with the additional data. We also find that FSRQs within the 1LAC sample do not show a significant difference in variability between the high and low redshift subsamples (Figure 5). In richards_thesis_2012 , we find that this significance continues to decrease with additional data, suggesting that this observed difference is likely spurious. If real, however, a number of competing effects must be removed to determine whether the observed trend reflects any intrinsic variability trend with redshift.
II.3 Cross-Correlation
A major aim of the OVRO monitoring program is the detailed cross-correlation of radio light curves with gamma-ray light curves from the LAT. Peaks in the cross-correlation function could identify the relative locations of gamma-ray and radio emission within a blazar jet. However, establishing the physical significance of an apparent correlation is a major challenge. Typical methods for computing the significance of a cross-correlation peak do not account for correlation between points within each light curve and, as a result, seriously overestimate the significance of an apparent peak. We have developed a Monte Carlo method to evaluate the significance of apparent correlations more accurately. This method and early results are described in more detail in max-moerbeck_relation_2010 and in Max-Moerbeck et al. in these proceedings. A detailed study of cross-correlation between OVRO 15 GHz light curves and LAT gamma-ray light curves is forthcoming max-moerbeck_forthcoming .
III KUPOL RECEIVER UPGRADE
Blazars characteristically exhibit polarized radio emission which can reveal the configuration of the magnetic field in the synchrotron emission regions. As a result, monitoring radio polarization in addition to intensity can add valuable information and provide an additional channel to study the relationship between emission in the radio and other bands. To this end, we have designed and begun construction of a new Ku-band (15 GHz) receiver, “KuPol,” with both linear polarization and total intensity measurement capabilities. Using a correlation receiver architecture and digital back-end, KuPol provides 16 MHz spectral resolution over a total bandwidth from 12–18 GHz using the same beam-differenced optical design as the current program. Construction of KuPol is nearly complete and commissioning is planned for early 2012.
IV CONCLUSIONS
We are actively and continuously monitoring a sample of more than 1550 blazars, including all Fermi gamma-ray blazars north of twice per week at 15 GHz. We have rigorously demonstrated a connection between gamma-ray emission and the strength of radio variability in our sample, an important prerequisite for establishing the physical significance of correlations between radio and gamma-ray light curves. In addition, we have developed and begun applying a Monte Carlo method for accurately evaluating the statistical significance of apparent peaks in the discrete cross-correlation function between radio and gamma-ray light curves. In addition to continuing our monitoring program, we will soon deploy KuPol, adding an increased bandwidth, spectral resolution, and linear polarization monitoring to our radio monitoring program. These tools and the ever growing data sets will enable detailed study of the connection between radio and gamma-ray emission in blazars.
Acknowledgements.
This work is supported in part by NASA grants NNX08AW31G and NNG06GG1G and NSF grant AST-0808050.References
- (1) Abdo, A. A. et al. 2010, ApJ, 715, 429.
- (2) Healey, S. E. et al. 2008, ApJS, 175, 97.
- (3) Hovatta, T. et al. 2007, A&A, 469, 899.
- (4) Max-Moerbeck, W. et al. 2010, “The Relation Between the Radio and Gamma-Ray Emission in Blazars from 15 GHz Monitoring with the OVRO 40 m Telescope and Fermi-GST Observations,” in Proceedings of the Workshop “Fermi Meets Jansky: AGN in Radio and Gamma-Rays,” Bonn (Germany), 21–23 June 2010, p. 77.
- (5) Max-Moerbeck, W. et al., 2011, in preparation.
- (6) Richards, J. L. et al. 2011, ApJS, 194, 29.
- (7) Richards, J. L. 2012, Ph.D Thesis, California Institute of Technology.