X-ray Signatures of Circumnuclear Gas in AGN
Abstract
X-ray spectra of AGN are complex. X-ray absorption and emission features trace gas covering a wide range of column densities and ionization states. High resolution spectra show the absorbing gas to be outflowing, perhaps in the form of an accretion disk wind. The absorbing complex shapes the form of the X-ray spectrum while X-ray reverberation and absorption changes explain the spectral and timing behaviour of AGN. We discuss recent progress, highlighting some new results and reviewing the implications that can be drawn from the data.
Keywords:
galaxies:Seyfert, X-rays:
98.541 Introduction
Spectroscopic data from the X-ray, UV and optical regimes have established the presence of significant columns of material outflowing from supermassive black holes in active galactic nuclei (AGN). Studying these outflows offers insight into the observed relationship between the black hole and its host galaxy (e.g. Gebhardt et al., 2000). Given the short duty-cycle of accretion that seems to exist for AGN (King, 2010), epochs of significant nuclear outflow must occur for AGN to build the supermassive black holes observed in the Universe. The most promising models for X-ray outflows consider mass loss via an accretion disk wind (e.g. Sim et al., 2010). The X-ray band carries information about the material flow very close to the black hole, and offers important constraints on fundamental parameters of the system, such as the wind launch radius and acceleration mechanism.
The spatial resolution of current X-ray instruments does not allow us to image the innermost regions of AGN directly, However, recent long X-ray observations, particularly those afforded by Suzaku and XMM-Newton have allowed a significant step forward using spectroscopic and timing analyses. Here, we review our current understanding of AGN absorber systems, highlighting key contributions from the Suzaku satellite.
2 X-ray Absorption in AGN
X-ray grating spectroscopy has allowed more than an order of magnitude improvement in spectral resolution at 1 keV, and a factor improvement at 6 keV, compared with CCD instruments. Accurate measurement of the energies of soft-band absorption lines such as those from O, Ne, Mg, Si and S, first traced relatively low ionization gas, outflowing at hundreds to thousands of km s-1 (Kaspi et al., 2002; Blustin et al., 2005). Such so-called ’warm absorbers’ are common in AGN. The best-studied, local AGN reveal multiple zones of absorbing gas, whose signatures can be separated with grating data. Application of photo-ionization models can yield the ionization-parameter for the gas, and an estimate of the product of density and radial distance from the source. In principle, the gas density may be estimated using sensitive triplet line ratios, however, in practice it has proved difficult to obtain interesting constraints. Absorber variability can also be used to constrain the gas density via consideration of the recombination timescale, although attempts to date have been limited by scant variability measurements.
Estimates of the gas location vary. Some new work considers reverberation analysis within the X-ray band, allowing a constraint on the location of reprocessing gas out of the line of sight. A few cases studied to date place the reprocessor tens to hundreds of gravitational radii from the nuclear source (Miller et al., 2010a). Other methods include measurement of the gas ionization parameter that, combined with velocity constraints and consideration of reasonable limits on the gas geometry, yield radial estimates that range from within the optical broad-line-region (BLR) to outside the putative molecular torus (Blustin et al., 2005).
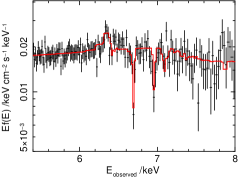
An important development has been the discovery of deep K-shell absorption lines from H-like and He-like species of Fe (e.g. Kaspi et al., 2002; Reeves et al., 2004; Turner et al., 2008). Suzaku has been effective at detection of these lines, owing to its high sensitivity at 6 keV. Importantly, Suzaku data yielded detections of Fe xxv and Fe xxvi in MCG–6-30-15 (Fig. 1), with outflow velocity km s-1 (Young et al., 2005; Miller et al., 2008). In general, measured line depths indicate the presence of very high columns of gas, atoms cm-2 in the line-of-sight, with velocities typically much higher than those detected in the soft X-ray regime (e.g. Risaliti et al., 2005; Miller et al., 2007; Turner et al., 2008). A sample study has found velocities up to c for these high-ionization absorbers (Tombesi et al., 2010) with some systems transporting significant mechanical energy from the nucleus to the host galaxy (Pounds and Reeves, 2009).
Systems detected to date span six orders of magnitude in ionization parameter, and five orders of magnitude in integrated column density. In summary, we have detected absorbing gas over the entire range of parameter-space to which current X-ray instruments are sensitive.
3 Spectral Variability
In light of the obvious importance of complex absorption in MCG–6-30-15, Miller et al. (2008) compiled data from Chandra, XMM-Newton and Suzaku to conduct the most comprehensive broad-band analysis (0.5-45 keV) of a single AGN to date. Spectral variations were decomposed using the SVD-PCA method, showing that spectral variability in MCG–6-30-15 could be fully described with a simple variations of one partial-covering zone of the complex X-ray absorber. The variable-covering absorber suggested for MCG–6-30-15 is of general interest, as it accounts for the spectral variations seen in a number of AGN (Miller et al., 2007, 2008).
In the case of a few sources, such as NGC 3516 (Turner et al., 2008), the data require an additional component of variability in the high-state that may either represent a clear view of the continuum variability, or else may provide evidence for dense clumps of gas ( cm-2) in the absorber system (Turner et al., 2011). Further observations using Suzaku are key to breaking this ambiguity, providing the only method of tracking AGN behavior simultaneously over 0.5 - 50 keV and the only direct way to probe the importance of Compton-thick gas in the absorber complex.
4 Compton-thick gas in the line-of-sight
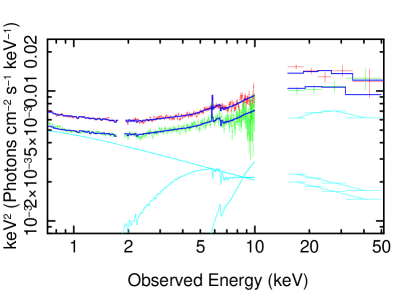
Suzaku observations of 1H 0419–577 and PDS 456 have been key in reshaping our view of AGN. For both sources, a marked ‘hard excess’ of counts was detected in the PIN data relative to the predicted flux based on model fits below 10 keV (Turner et al., 2009; Reeves et al., 2009). The high PIN-band flux (Fig. 2) can be modeled with a layer of Compton-thick gas (taken as ) that covers of the continuum (after correction for scattering losses). What is remarkable is that this Compton-thick gas exists in the line-of-sight to the nucleus. The type 1 classification of 1H 0419–577 implies that the Compton-thick gas lies within the BLR, or that the BLR is observed through holes in the absorbing medium. Both possibilities challenge current models for AGN and necessitate a reconsideration of the true intrinsic luminosity distribution of the population.
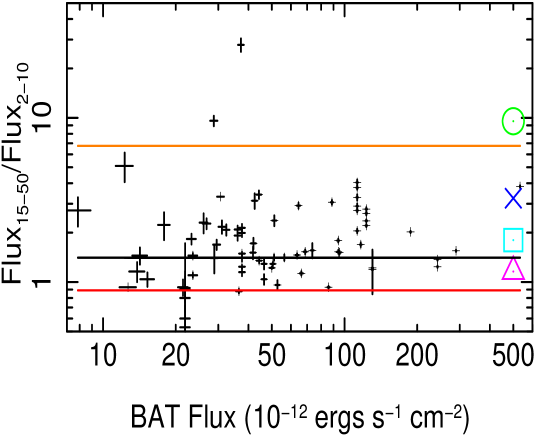
These observations prompted a follow-up study. The Swift BAT survey provides a survey of the X-ray sky that is unbiased up to column densities . Tatum et al. (in prep) selected a sample of type 1 AGN from the 58-month BAT catalog. To understand the sample, we required simultaneous medium and hard-band X-ray data, and so the BAT list was cross-correlated with the Suzaku archive, yielding a sample comprising 65 observations of 50 objects. The energy flux was measured in the 15–50 keV and 2–10 keV bands using the simultaneous XIS and PIN data. The results are shown in Fig. 3. The weighted mean ratio is shown as a black solid line; surprisingly, 1H0419–577 is consistent with the sample mean, having a hardness ratio . The red line represents the sum of a powerlaw () plus reflection from a thin disk of neutral material subtending steradians to the illuminating continuum. To characterize the reflector we used the pexrav model in xspec, assuming no cut-off of the continuum, an inclination angle of 60o and solar abundances. The distribution of measured ratios are generally much harder than that model.
The solid orange line represents the hardness ratio for the same reflector, this time assuming the illuminating continuum is hidden from view (pure reflection). While a pure reflection spectrum might be expected for type 2 AGN, such an explanation is at odds with a sample of type 1 AGN given the current model for these systems. Markers on the right side of the plot represent the ratios expected for the case where a neutral column of Compton-thick gas partially covers the continuum source. Several covering fractions are denoted: 98% (green), 90% (dark blue), 70% (light blue) and 50% (magenta). In the context of this simple partial-covering model, a remarkable 70% of the sample are found to have significant covering by Compton-thick gas in the line-of-sight. While some Compton-thick AGN have been identified in previous BAT-selected samples of AGN (Winter et al., 2009), our approach, using only the simultaneous constraints provided by the Suzaku XIS and PIN, has shown the enormous importance of partially-covering Compton-thick gas in the local population of type 1 AGN.
It is clear that studies below 10 keV have greatly underestimated the intrinsic luminosity of a large fraction of the local AGN population (Tatum et al in prep.) and that a reconsideration of the structure of the inner regions of AGN is unavoidable. Results such as this illustrate the enormous value the broad-band coverage of Suzaku offers to the astronomical community.
5 Broad Components of Fe K emission
Compelling evidence for Compton-thick gas in the line-of-sight, combined with the certainty that the X-ray absorber is outflowing, has motivated detailed calculation of the signatures from a Compton-thick flow (Sim et al., 2008, 2010). Consideration of high wind densities predicts a strong Fe K emission line should be observed from the wind. This line is broadened by a combination of electron scattering and velocity effects. Calculations assume the wind is launched beyond and so relativistic blurring does not contribute to the predicted line width, indeed the predicted line widths are not extreme, having typical values FWHM keV. Case studies of Mrk 766 (Sim et al., 2008) and PG1211 (Sim et al., 2010) showed that a Compton-thick wind can describe the Fe xxv and Fe xxvi absorption lines and the broad Fe emission component with a single flow.
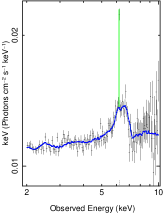
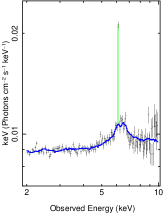
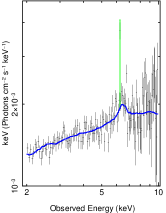
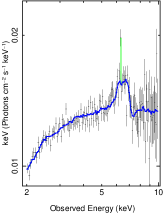
To follow up on those results, Tatum et al (in prep.) have taken an exploratory sample of local AGN (see Patrick et al., 2011) that possess moderately-broad components of Fe K emission. Suzaku XIS data were fit over 2–10 keV using a powerlaw continuum modified by a disk wind, plus Galactic absorption. Fig. 4 shows some examples of the results obtained. The solid blue line represents the continuum power-law convolved with absorption and scattering effects from the wind (convolved with the effect of Galactic absorption). The green line shows the narrow component of Fe K emission that was required in all sources, likely representing reprocessing in distant material, not necessarily associated with the wind. The wind model provided a satisfactory fit to all of the broad lines observed, indicating that winds may explain both the dominant absorption and emission properties of Seyfert type AGN (Tatum et al in prep.).
6 Timing Analysis
Measurement of reverberation signals is a powerful technique for constraining the size-scale of astronomical systems. Reverberation signatures are measured by cross-correlating two time series and searching for time delays between them. To perform this technique within the X-ray band, one must understand the contributions of direct and reprocessed signatures in each of the bands considered.
Miller et al. (2010a, b) have developed a maximum-likelihood approach to investigate time delay signatures in Fourier space. This method finds the power-spectra and cross-power-spectra that best fit the time-domain data, with full consideration of data sampling and noise, and using estimated measurement uncertainties that account for the variance of the source from observation to observation.
A key part of the timing analysis consists of construction of a “lag spectrum” that shows the time lags between two time series as a function of the frequency of the source variation. Analysis of the lag spectrum yields information about the geometry and size scale of the reprocessor. Consider a thin spherical shell of material surrounding an active nucleus, where the directly-viewed continuum is emitted from a central point source and measured in one time series, while light scattered from the shell is measured in a second time series. If the shell has holes “partial-covering” in the sight-line to the observer, and also on the opposite side of the continuum source from the observer, then the gas appears somewhat like a ring seen end-on to the observer. One can construct the lag spectrum for such a reprocessor. At high frequencies, where the variability mode is significantly shorter than the light travel time across the shell, scattering from different parts of the shell add incoherently over a wide range of phases, so the observed net time delay tends to zero. One also observes some oscillations that depend on the details of the shell structure. At low frequencies, where the source variability period is much longer than the light travel time across the shell, the scattered light adds mostly coherently and a mean time delay is observed for the shell. At a frequency where the time period equals the light travel time across the shell, a sharp transition is observed between these two regimes and the measured time delay may become negative for some ranges of frequency. While all the scattered light signals actually are delayed, the negative lag appears in Fourier space if the phases wrap around by more than radians. Thus, the detailed oscillatory structure in the lag spectrum tells us about the structure, geometry and size-scale of the reprocessor. Note that if the shell were symmetric and full-covering, the time delays oscillate but stay positive.


Fig. 5 shows some examples of lag spectra having clear transitions from positive lags (hard band lagging soft) at low frequencies to zero or negative lags at high frequencies. The observed transitions are broader than expected for a thin-shell reprocessor, indicating that the reverberating material has significant depth Miller et al. (2010a). The observed time delays have values of hundreds of seconds at low variation frequencies but fall to values close to zero at high frequencies. A typical transition frequency is Hz, indicating the reprocessor to be a few light hours from the central source, equivalent to a fews tens to a few hundreds of gravitational radii, depending on the black hole mass.
The interpretation of large-scale X-ray reverberation is supported by a substantial body of spectral evidence Turner and Miller (2009). Zones of partially-covering, absorbing circumnuclear material shape the X-ray timing and spectral properties of AGN. Both spectral and timing analyses indicate that the global covering factor of the reprocessor must be high (%) in order to achieve a sufficient amount of scattered light to explain the observations. Further work is needed to create models that reproduce both the timing behaviour and the observed high resolution spectra.
References
- Gebhardt et al. (2000) K. Gebhardt, R. Bender, G. Bower, A. Dressler, S. M. Faber, A. V. Filippenko, R. Green, C. Grillmair, L. C. Ho, J. Kormendy, T. R. Lauer, J. Magorrian, J. Pinkney, D. Richstone, and S. Tremaine, ApJ 539, L13–L16 (2000), arXiv:astro-ph/0006289.
- King (2010) A. R. King, MNRAS 402, 1516–1522 (2010), 0911.1639.
- Sim et al. (2010) S. A. Sim, L. Miller, K. S. Long, T. J. Turner, and J. N. Reeves, MNRAS 404, 1369–1384 (2010), 1002.0544.
- Kaspi et al. (2002) S. Kaspi, W. N. Brandt, I. M. George, H. Netzer, D. M. Crenshaw, J. R. Gabel, F. W. Hamann, M. E. Kaiser, A. Koratkar, S. B. Kraemer, G. A. Kriss, S. Mathur, R. F. Mushotzky, K. Nandra, B. M. Peterson, J. C. Shields, T. J. Turner, and W. Zheng, ApJ 574, 643–662 (2002), arXiv:astro-ph/0203263.
- Blustin et al. (2005) A. J. Blustin, M. J. Page, S. V. Fuerst, G. Branduardi-Raymont, and C. E. Ashton, A&A 431, 111–125 (2005), arXiv:astro-ph/0411297.
- Miller et al. (2010a) L. Miller, T. J. Turner, J. N. Reeves, A. Lobban, S. B. Kraemer, and D. M. Crenshaw, MNRAS 403, 196–210 (2010a), 0912.0456.
- Reeves et al. (2004) J. N. Reeves, K. Nandra, I. M. George, K. A. Pounds, T. J. Turner, and T. Yaqoob, ApJ 602, 648–658 (2004), arXiv:astro-ph/0310820.
- Turner et al. (2008) T. J. Turner, J. N. Reeves, S. B. Kraemer, and L. Miller, A&A 483, 161–169 (2008), 0803.0080.
- Young et al. (2005) A. J. Young, J. C. Lee, A. C. Fabian, C. S. Reynolds, R. R. Gibson, and C. R. Canizares, ApJ 631, 733–740 (2005), arXiv:astro-ph/0506082.
- Miller et al. (2008) L. Miller, T. J. Turner, and J. N. Reeves, A&A 483, 437–452 (2008), 0803.2680.
- Risaliti et al. (2005) G. Risaliti, S. Bianchi, G. Matt, A. Baldi, M. Elvis, G. Fabbiano, and A. Zezas, ApJ 630, L129–L132 (2005), arXiv:astro-ph/0508608.
- Miller et al. (2007) L. Miller, T. J. Turner, J. N. Reeves, I. M. George, S. B. Kraemer, and B. Wingert, A&A 463, 131–143 (2007), arXiv:astro-ph/0611673.
- Tombesi et al. (2010) F. Tombesi, M. Cappi, J. N. Reeves, G. G. C. Palumbo, T. Yaqoob, V. Braito, and M. Dadina, A&A 521, A57+ (2010), 1006.2858.
- Pounds and Reeves (2009) K. A. Pounds, and J. N. Reeves, MNRAS 397, 249–257 (2009), 0811.3108.
- Turner et al. (2011) T. J. Turner, L. Miller, S. B. Kraemer, and J. N. Reeves, ApJ 733, 48–+ (2011), 1103.3709.
- Turner et al. (2009) T. J. Turner, L. Miller, S. B. Kraemer, J. N. Reeves, and K. A. Pounds, ApJ 698, 99–105 (2009), 0903.4347.
- Reeves et al. (2009) J. N. Reeves, P. T. O’Brien, V. Braito, E. Behar, L. Miller, T. J. Turner, A. C. Fabian, S. Kaspi, R. Mushotzky, and M. Ward, ApJ 701, 493–507 (2009), 0906.0312.
- Winter et al. (2009) L. M. Winter, R. F. Mushotzky, C. S. Reynolds, and J. Tueller, ApJ 690, 1322–1349 (2009), 0808.0461.
- Sim et al. (2008) S. A. Sim, K. S. Long, L. Miller, and T. J. Turner, MNRAS 388, 611–624 (2008), 0805.2251.
- Patrick et al. (2011) A. R. Patrick, J. N. Reeves, D. Porquet, A. G. Markowitz, A. P. Lobban, and Y. Terashima, MNRAS 411, 2353–2370 (2011), 1010.2080.
- Miller et al. (2010b) L. Miller, T. J. Turner, J. N. Reeves, and V. Braito, MNRAS 408, 1928–1935 (2010b), 1006.5035.
- Emmanoulopoulos et al. (2011) D. Emmanoulopoulos, I. M. McHardy, and I. E. Papadakis, MNRAS 416, L94–L98 (2011), 1106.6067.
- Turner and Miller (2009) T. J. Turner, and L. Miller, A&A Rev. 17, 47–104 (2009), 0902.0651.