Detection of Outflowing and Extraplanar Gas in Disks
in an Assembling Galaxy Cluster at
Abstract
We detect ionized gas characteristics indicative of winds in three disk-dominated galaxies that are members of a super-group at that will merge to form a Coma-mass cluster. All three galaxies are IR-luminous () and lie outside the X-ray cores of the galaxy groups. We find that the most IR-luminous galaxy has strong blue and redshifted emission lines with velocities of and a third, blueshifted () component. This galaxy’s line-widths (H, [OIII]5007, [NII], H) correspond to velocities of . We detect extraplanar gas in two of three galaxies with SFR whose orientations are approximately edge-on and which have IFU spaxels off the stellar disk. IFU maps reveal that the extraplanar gas extends to kpc; [NII] and H line-widths correspond to velocities of in the disk and decrease to above the disk. Multi-wavelength observations indicate that the emission is dominated by star formation. Including the most IR-luminous galaxy we find that of supergroup members with SFR show ionized gas characteristics indicative of outflows. This is a lower limit as showing that gas is outflowing in the remaining, moderately inclined, galaxies requires a non-trivial decoupling of contributions to the emission lines from rotational and turbulent motion. Ionized gas mass loss in these winds is for each galaxy, although the winds are likely to entrain significantly larger amounts of mass in neutral and molecular gas.
Subject headings:
galaxies:evolution – galaxies:groups:general – galaxies:starburst – galaxies:clusters:general1. Introduction
Star formation can drive winds that transport gas to large distances from the parent galaxy. These outflows are nearly ubiquitous in infrared luminous galaxies with star formation rates (Rupke et al., 2005a). In the local universe, extraplanar emission line gas is observed in most galaxies with star formation rates and in many cases there is evidence that this gas is outflowing (Veilleux et al., 2005). Simulations increasingly incorporate outflows in order to match a wide range of galaxy and intergalactic gas observables (Davé et al., 2011a, b).
Starburst driven outflows are composed of multi-phase gas. A tenuous, hot ( K) plasma created by stellar winds and supernovae ejecta is thought to carry most of the energy and metals in the outflow (Chevalier & Clegg, 1985; Strickland & Heckman, 2007) while neutral and molecular interstellar gas clouds entrained in the hot outflow contribute the majority of the mass (Sturm et al., 2011; Rupke et al., 2005b). Optical emission lines are thought to be produced by turbulent mixing layers on the surface of the cool entrained clouds as well as by diffuse ( K) ionized gas (Westmoquette et al., 2009).
The fate of the ejected multi-phase gas is likely to depend on the galaxy mass as well as environment. For example, massive, isolated galaxies are able to retain their hot, X-ray emitting gas reservoirs while low-mass galaxies are not (Mulchaey & Jeltema, 2010). Hot gas winds from galaxies in groups and clusters may be confined by the dense intergalactic gas in these systems (Brown & Bregman, 2000) or stripped away by it (Kawata & Mulchaey, 2008; Hester, 2006). Gas which is stripped will enrich the intergalactic medium with metals and entropy (Lloyd-Davies et al., 2000; Davis et al., 1999).
Most galaxies in the local universe are in groups (Geller & Huchra, 1983; Eke et al., 2004) and groups are the building blocks of galaxy clusters (Boué et al., 2008; McGee et al., 2009). As outflows are common among star-forming galaxies, we expect to see many in group and field environments whose star-forming galaxy populations are comparable at (Tyler et al., 2011). We search for outflows from galaxies using integral field unit (IFU) spectroscopic observations of SG1120-1202 (hereafter SG1120), a system of four X-ray bright galaxy groups that will merge to form a cluster comparable in mass to Coma (Gonzalez et al., 2005).
We assume a flat cosmology with , , .
| ID | z | aaDetails on the calculation of stellar masses, infrared luminosities and star formation rates can be found in Tran et al. (2009). | bbThe point source sensitivity is . | ||||
|---|---|---|---|---|---|---|---|
| (J2000) | (J2000) | () | () | () | |||
| S1 | 11 20 10.1 | -12 10 12 | 0.3692 | 4.9 | 31 | 8.8 | 150 |
| S2 | 11 20 10.7 | -12 11 04 | 0.3501 | 1.0 | 1.7 | 0.54 | 9 |
| S3 | 11 20 17.7 | -11 57 57 | 0.3557 | 0.2 | - | 0.50 | 11 |
2. Observations
We used FLAMES/GIRAFFE (Pasquini et al., 2002) on the VLT (PID: 082.B-0765) to take IFU spectroscopy of 60 SG1120 members in February 2009. The instrument places 15 deployable IFUs across the field of view where each IFU is and made of 20 spaxels (). Using the LR08 setup, the spectra cover a wavelength range of nm with spectral resolution of 0.94 Å ( for H at ). The FWHM of the point spread function (PSF) ranged from .
We used the P3D software package (Sandin et al., 2010) to bias correct the CCD images, trace the spectra on the chip, flat field, correct for fiber-to-fiber transmission differences, and optimally extract the object spectra using multi-profile deconvolution. P3D also provides an error spectrum with each extracted object spectrum. We used IRAF to wavelength calibrate and produce spectra interpolated to a dispersion of 0.2 Å . The sky background was subtracted using spectra from 12 dedicated sky fibers on FLAMES. The IFU spectra are reassembled spatially and emission lines are fit with Gaussian components weighted by the associated error spectrum using custom IDL and Supermongo programs. The signal-to-noise (S/N) is calculated for each line component in the fit and only components with S/N are included in our analysis. We fit the central blended IFU spaxels in SG1120-S1 by hand with IRAF/SPLOT using the three components in the [OIII]5007 line from the multi-slit spectroscopy as a guide.
We have multi-slit spectroscopy with broader wavelength coverage of SG1120 (Tran et al., 2009). The multi-slits are all wide and the 2D spectra summed over the brightest along the slit to generate the 1D spectra. We measure systemic redshifts based on stellar absorption lines using the IRAF/RVSAO package and fit the H and [OIII] emission lines by hand with IRAF/SPLOT.
Key to our analysis is our extensive multi-wavelength dataset of SG1120 that includes X-ray imaging from Chandra/ACIS (Gonzalez et al., 2005), total infrared luminosities from Spitzer/MIPS m imaging (Tran et al., 2009), Hubble/ACS F814W imaging, GALEX UV imaging (Just et al., 2011), and a 1.4 GHz radio continuum map from the VLA. The X-ray, UV, mid-infrared, and radio observations are critical for determining whether the velocity structure detected in the optical spectroscopy is driven by star formation or by AGN.
About a third of the SG1120 spectroscopically confirmed members (with ) are detected in Spitzer m imaging with star formation rates (Tran et al., 2009). Of these IR detected galaxies 17 have SFR (, hereafter ). We will discuss three of these galaxies, referred to arbitrarily as S1, S2 and S3 in this paper.
3. Evidence of Outflowing and Extraplanar Gas in Group Galaxies
3.1. Luminous Infra-Red Galaxy: SG1120-S1
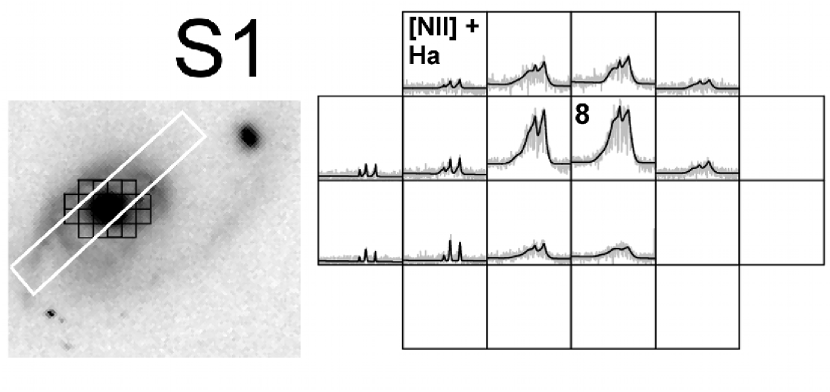
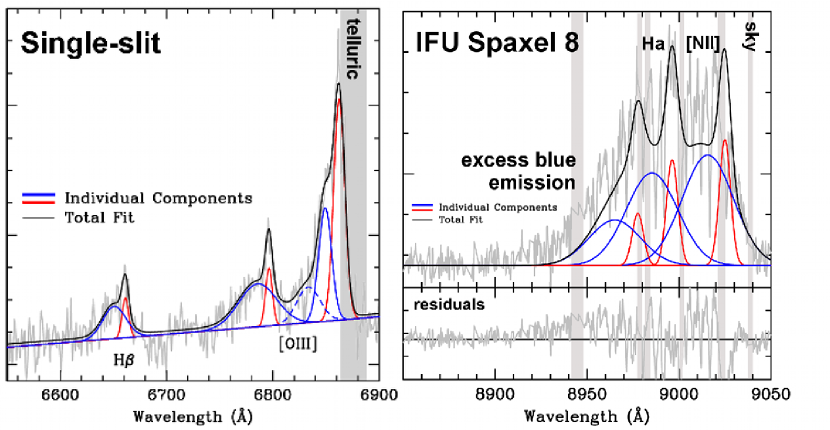
SG1120-S1 is a massive super-group galaxy with an infrared luminosity of , i.e. nearly a ULIRG (Ultra-Luminous Infra-Red Galaxy). Morphologically disturbed and connected to a nearby companion ( kpc) with a stellar tidal tail, SG1120-S1 is a poster child for merger-driven star formation. We find evidence of a strong gas outflow in SG1120-S1’s nucleus in both our IFU and single slit spectroscopy. The -wide single slit spectrum (Figs. 1 & 2) samples the galaxy’s inner 5 kpc and shows blue and redshifted components in H and [OIII] that differ from the systemic velocity by . By forcing the profile shapes of the H and [OIII]4959 lines to be consistent, we find an additional broad component in the [OIII]5007 line that is blueshifted by ; note this broad component is much weaker than the other two components and thus below our detection threshold for both H and [OIII]4959. This second blueshifted component is also necessary when fitting the blended spaxels in the IFU data as the emission extends farther to the blue than would be expected for only the single blueshifted component. The line widths for H, [OIII]4959, and [OIII]5007 are also broad and range from for the blue component to for the red component. The combination of both blue and redshifted components in the single-slit spectroscopic data indicate we may be viewing both sides of a bipolar outflow, an expanding bubble, or an outflow plus infalling tidal debris.
Our IFU spectroscopy maps the kinematics of the ionized gas as traced by [NII] & H and reveals a complex of broad lines over multiple spaxels (Fig. 1). There appears to be a single bright central spaxel that is broadened into neighboring spaxels by the telescope PSF as indicated by the unchanging red edge of the [NII]6583 line. We show the IFU data for illustration and use the single-slit data for all quantitative measurements of outflow dynamics. Beyond the galaxy’s core ( kpc), the [NII]-H FWHM line-widths decrease and the velocity offsets are consistent with rotation (). In spaxels with unblended lines we measure line ratios ( [NII]/H) that are best explained by shocked gas as is commonly seen in the extranuclear regions of ULIRGS (Monreal-Ibero et al., 2006). Note that the true gas velocities are likely to be higher because we are measuring only the motion along the line-of-sight.
Our multi-wavelength observations indicate that SG1120-S1 does not have a significant AGN component (Table 1): our 1.4 GHz and m measurements show that the galaxy falls on the infrared-radio relation for local star-forming galaxies (Yun et al., 2001). SG1120-S1 is X-ray detected but with an X-ray luminosity of , any embedded AGN must be Compton thick (Nardini & Risaliti, 2011). For comparison, most U/LIRGs in this merger stage with similar are starburst or composite systems (Yuan et al., 2010). Star formation in U/LIRGs also tends to be concentrated in the central kpc (Soifer et al., 2001, 2000) which corresponds to less than one spaxel in our IFU maps. The lines in the core spaxels are emitted primarily by gas that is participating in the outflow and their line ratios appear to be dominated by shock excitation as is commonly seen in starburst galaxies (Sharp & Bland-Hawthorn, 2010). We conclude that SG1120-S1 is not AGN dominated, thus the strong gas outflows detected in both the IFU and single slit spectroscopy are driven primarily by star formation.
3.2. Disk-dominated Members: SG1120-S2 & SG1120-S3
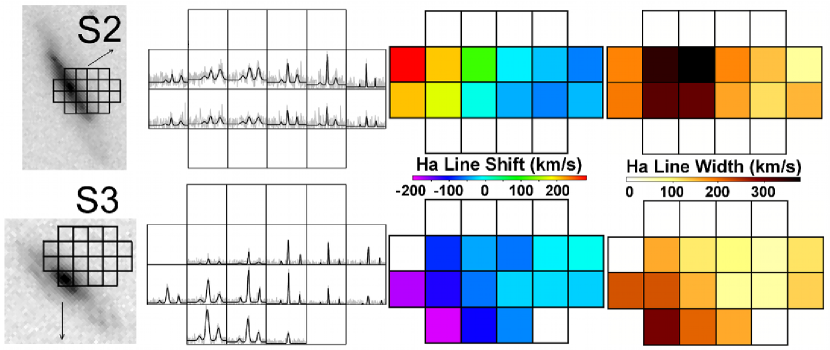
In the local universe extraplanar gas is detected in most highly inclined galaxies that have total infrared luminosities (; Veilleux et al., 2005). Our IFU observations include three such super-group galaxies and we discover that two have extraplanar emission with H and [NII] FWHM line-widths of (Fig. 3).
SG1120-S2 is a disk-dominated member viewed nearly edge-on that lies on the infrared-radio relation for local star-forming galaxies and is not detected with Chandra (Table 1). We detect [NII] and H emission in the disk and, surprisingly, also at projected heights of kpc above the disk (Fig. 3). In the spaxels sampling the disk, the [NII]/H ratios of 0 to 0.2 are consistent with shocked gas and the measured line-widths correspond to gas velocities of . In the extraplanar spaxels ( kpc), the [NII]/H ratios of -0.2 to -0.4 are consistent with photoionization by starlight and the line-widths correspond to gas velocities of . Our multi-wavelength observations indicate that as with SG1120-S1, the shocked gas in the central region of SG1120-S2 is due to star formation and not an AGN.
SG1120-S3 is also an inclined disk-dominated member with comparable IR luminosity to SG1120-S2 (Table 1); it is not detected in the radio nor X-ray observations. The IFU maps show [NII] and H emission in both the disk and extraplanar spaxels ( kpc), and the line-ratios are consistent with photoionization by starlight. The FWHM line-widths correspond to velocities of in the disk spaxels and decrease to above the disk. With no signs of an AGN, the gas motion is most likely driven by the ongoing star formation.
In both group members where we detect extraplanar ionized gas, the emission lines vary in terms of relative velocity and width from spaxel to spaxel indicating that there is no PSF broadening in these sources. As with SG1120-S1, we measure only motion along the line-of-sight while the gas is likely to be primarily moving perpendicular to the disk, i.e. the true gas velocities are likely to be higher. We cannot determine a net flow direction for the extraplanar gas because the errors on the systemic velocity () for these two galaxies are large compared to the velocity shifts () in their extraplanar spaxels. However, we do confirm the existence of ionized gas at large scale heights above the disk of both members.
4. Outflow Gas Masses and Disk Gas Depletion Timescales
To determine what happens to the gas in these three members, we first estimate how much ionized gas is in the observed outflow. For SG1120-S1, using the H lines from our single-slit data and the relation in Holt et al. (2006)111This estimate is subject to modulation by a filling factor due to the clumpiness of the gas and assumes a spherical outflow., we assume case B recombination (Osterbrock, 1989) and an electron density222Electron densities of are observed between kpc for starburst superwinds (Heckman et al., 1990). We cannot measure the electron density directly because the [SII] lines are blended. of to estimate a total ionized gas mass of in the two components of the H line (). Next we estimate an outflow rate () for the ionized gas by comparing the mass inferred from the H emission to a dynamical timescale. Using the single-slit data we assume a radius of 1 kpc, consistent with the extent of the emission lines, and an outflow velocity of from the most blueshifted component on the [OIII]5007 line, giving us yr. For SG1120-S1, ; this is a lower limit because we cannot correct for extinction.
We stress that while the mass of ionized gas in the outflow is relatively modest, the outflow is likely to contain larger amounts of neutral and molecular gas. We cannot directly trace with our observations the multi-phase gas entrained in the outflow, but we note that SG1120-S1 has an intermediate between the LIRG and low-z ULIRG samples in Rupke et al. (2005b) for which typical outflows of neutral gas are, on average, . SG1120-S1 has a similar star-formation rate and low AGN contribution to IRAS 13120-5453 for which observations reveal a molecular gas outflow rate of (Sturm et al., 2011).
As SG1120-S1 loses gas through winds, it is also using up its reservoir of dense molecular gas through strong star formation. We can estimate the molecular gas content of these galaxies using the relation (Sanders et al., 1991; Genzel et al., 2010). SG1120-S1 has a molecular gas reservoir of (using the Galactic conversion factor). We calculate a star formation rate for this galaxy of , independent of its infrared emission, using its 1.4 GHz radio continuum luminosity (Bell, 2003). Assuming it maintains this star formation rate and does not accrete new gas, SG1120-S1 will consume all of its molecular gas in Myr. If, as indicated above, SG1120-S1 is expelling molecular gas at a rate comparable to its star formation rate then it will run out of gas in half that time, or Myr.
For SG1120-S2 and SG1120-S3, we estimate the mass of ionized extraplanar gas using the H emission from our IFU observations (Nesvadba et al., 2006). Adopting the same electron density as for SG1120-S1 of , we estimate an ionized gas mass of for SG1120-S2 and for SG1120-S3. Assuming a moderate outflow velocity of consistent with winds from highly inclined galaxies in the local universe (Lehnert & Heckman, 1996) the dynamical timescale for the outflow to reach 10 kpc is yr, thus the mass loss rate is . Both galaxies are likely to have of molecular gas and will consume all of this gas in the next Myr if they maintain their current star formation rates and do not accrete new gas.
There are very few measurements of molecular outflows rates in galaxies which are not ULIRGs. In M82 (; Sofue et al., 1992) whose is similar to SG1120-S2 and SG1120-S3, the molecular gas mass in the outflow is (Walter et al., 2002). It is in NGC 253 (, ; Bailin et al., 2011; Sturm et al., 2011). Thus, SG1120-S2 and SG1120-S3 may also be expelling significant quantities of molecular gas.
5. Conclusions
Using single-slit and IFU spectroscopy, we map the kinematics of ionized gas in galaxies that are part of an assembling galaxy cluster at . Here we present results on three IR-luminous, disk-dominated members that have ionized gas characteristics indicative of outflows.
SG1120-S1 is the most IR-luminous super-group member (, SFR of ). The H and [OIII] emission lines in our single-slit data reveal gas that is blue and redshifted from the systemic velocity by . We find a third, weaker component in the [OIII] emission that is blueshifted by but lies below the noise in the [OIII] and H lines. The combination of both blue and redshifted components in the single-slit spectroscopic data indicate we are viewing both sides of a bipolar outflow or an expanding bubble, or an outflow plus infalling tidal debris.
In the local universe extraplanar gas is detected in most highly inclined galaxies that have star formation rates (Veilleux et al., 2005). Our IFU maps target four highly inclined super-group members with SFR of which two show extraplanar gas. The IFU maps for SG1120-S2 and SG1120-S3 reveal extraplanar [NII] and H emission that is detected to at least kpc above the disk.
Our radio, IR, and X-ray observations indicate that all three galaxies are dominated by star formation. If they maintain their current star formation rates, and do not accrete new fuel, they will run out of fuel in Gyr. We estimate that the wind in each of the three galaxies drives a relatively modest ionized gas mass flow of . As discussed in §4, these galaxies may be ejecting molecular gas at a rate comparable to their star formation rate.
It remains unclear how future star formation in these galaxies will be affected by these winds. In simulations infalling galaxies continue to accrete gas for Gyr after entering the larger halo (Simha et al., 2009) and a number of observed characteristics of satellite galaxies can be explained by a gradual reduction in star formation after infall (Weinmann et al., 2009). A recent study of the super-group S0 population finds no evidence for a recent strong star formation episode which stopped abruptly in these galaxies (Just et al., 2011). If SG1120-2 and SG1120-3 are S0 progenitors whose star formation will be quenched rapidly then they represent a new infalling population.
About a third (31 galaxies) of the SG1120 spectroscopically confirmed members (with ) are detected in Spitzer m imaging with star formation rates () (Tran et al., 2009). Of these IR-detected galaxies 17 have SFR . Three are sources whose orientation is approximately edge-on and which have IFU spaxels off the stellar disk and we detect extraplanar gas in two of them, referred to here as S2 and S3. Including S1 we find that of supergroup members with SFR show ionized gas characteristics indicative of outflows. This is a lower limit as showing that gas is outflowing in the remaining, moderately inclined, galaxies requires a non-trivial decoupling of contributions to the emission lines from rotational and turbulent motion. Furthermore, of the IR-detected members have a SFR and, as a result, are likely to host a wind according to general estimates of the frequency of outflows (Veilleux et al., 2005).
Further identification and study of galactic winds in groups and clusters is needed to better understand their frequency and ability to transform galaxies and intergalactic gas as a function of environment.
References
- Bailin et al. (2011) Bailin, J., Bell, E. F., Chappell, S. N., Radburn-Smith, D. J., & de Jong, R. S. 2011, ApJ, 736, 24
- Bell (2003) Bell, E. F. 2003, ApJ, 586, 794
- Boué et al. (2008) Boué, G., Durret, F., Adami, C., Mamon, G. A., Ilbert, O., & Cayatte, V. 2008, A&A, 489, 11
- Brown & Bregman (2000) Brown, B. A. & Bregman, J. N. 2000, ApJ, 539, 592
- Chevalier & Clegg (1985) Chevalier, R. A. & Clegg, A. W. 1985, Nature, 317, 44
- Davé et al. (2011a) Davé, R., Finlator, K., & Oppenheimer, B. D. 2011a, ArXiv e-prints
- Davé et al. (2011b) Davé, R., Oppenheimer, B. D., & Finlator, K. 2011b, ArXiv e-prints
- Davis et al. (1999) Davis, D. S., Mulchaey, J. S., & Mushotzky, R. F. 1999, ApJ, 511, 34
- Eke et al. (2004) Eke, V. R., Baugh, C. M., Cole, S. et al. 2004, MNRAS, 348, 866
- Geller & Huchra (1983) Geller, M. J. & Huchra, J. P. 1983, ApJS, 52, 61
- Genzel et al. (2010) Genzel, R., Tacconi, L. J., Gracia-Carpio, J. et al. 2010, MNRAS, 407, 2091
- Gonzalez et al. (2005) Gonzalez, A. H., Tran, K., Conbere, M. N., & Zaritsky, D. 2005, ApJ, 624, L73
- Heckman et al. (1990) Heckman, T. M., Armus, L., & Miley, G. K. 1990, ApJS, 74, 833
- Hester (2006) Hester, J. A. 2006, ApJ, 647, 910
- Holt et al. (2006) Holt, J., Tadhunter, C., Morganti, R., Bellamy, M., González Delgado, R. M., Tzioumis, A., & Inskip, K. J. 2006, MNRAS, 370, 1633
- Just et al. (2011) Just, D. W., Zaritsky, D., Tran, K.-V. H., Gonzalez, A. H., Kautsch, S. J., & Moustakas, J. 2011, ArXiv e-prints
- Kawata & Mulchaey (2008) Kawata, D. & Mulchaey, J. S. 2008, ApJ, 672, L103
- Lehnert & Heckman (1996) Lehnert, M. D. & Heckman, T. M. 1996, ApJ, 462, 651
- Lloyd-Davies et al. (2000) Lloyd-Davies, E. J., Ponman, T. J., & Cannon, D. B. 2000, MNRAS, 315, 689
- McGee et al. (2009) McGee, S. L., Balogh, M. L., Bower, R. G., Font, A. S., & McCarthy, I. G. 2009, MNRAS, 400, 937
- Monreal-Ibero et al. (2006) Monreal-Ibero, A., Arribas, S., & Colina, L. 2006, ApJ, 637, 138
- Mulchaey & Jeltema (2010) Mulchaey, J. S. & Jeltema, T. E. 2010, ApJ, 715, L1
- Nardini & Risaliti (2011) Nardini, E. & Risaliti, G. 2011, ArXiv e-prints
- Nesvadba et al. (2006) Nesvadba, N. P. H., Lehnert, M. D., Eisenhauer, F., Gilbert, A., Tecza, M., & Abuter, R. 2006, ApJ, 650, 693
- Osterbrock (1989) Osterbrock, D. E. 1989, Astrophysics of gaseous nebulae and active galactic nuclei, ed. Osterbrock, D. E.
- Pasquini et al. (2002) Pasquini, L., Avila, G., Blecha, A. et al. 2002, The Messenger, 110, 1
- Rupke et al. (2005a) Rupke, D. S., Veilleux, S., & Sanders, D. B. 2005a, ApJ, 632, 751
- Rupke et al. (2005b) —. 2005b, ApJS, 160, 115
- Sanders et al. (1991) Sanders, D. B., Scoville, N. Z., & Soifer, B. T. 1991, ApJ, 370, 158
- Sandin et al. (2010) Sandin, C., Becker, T., Roth, M. M., Gerssen, J., Monreal-Ibero, A., Böhm, P., & Weilbacher, P. 2010, A&A, 515, A35+
- Sharp & Bland-Hawthorn (2010) Sharp, R. G. & Bland-Hawthorn, J. 2010, ApJ, 711, 818
- Simha et al. (2009) Simha, V., Weinberg, D. H., Davé, R., Gnedin, O. Y., Katz, N., & Kereš, D. 2009, MNRAS, 399, 650
- Sofue et al. (1992) Sofue, Y., Reuter, H.-P., Krause, M., Wielebinski, R., & Nakai, N. 1992, ApJ, 395, 126
- Soifer et al. (2000) Soifer, B. T., Neugebauer, G., Matthews, K. et al. 2000, AJ, 119, 509
- Soifer et al. (2001) Soifer, B. T., Neugebauer, G., Matthews, K. et al. 2001, AJ, 122, 1213
- Strickland & Heckman (2007) Strickland, D. K. & Heckman, T. M. 2007, ApJ, 658, 258
- Sturm et al. (2011) Sturm, E., González-Alfonso, E., Veilleux, S. et al. 2011, ApJ, 733, L16+
- Tran et al. (2009) Tran, K., Saintonge, A., Moustakas, J., Bai, L., Gonzalez, A. H., Holden, B. P., Zaritsky, D., & Kautsch, S. J. 2009, ApJ, 705, 809
- Tyler et al. (2011) Tyler, K., Rieke, G. H., Wilman, D. J. et al. 2011, ArXiv e-prints
- Veilleux et al. (2005) Veilleux, S., Cecil, G., & Bland-Hawthorn, J. 2005, ARA&A, 43, 769
- Walter et al. (2002) Walter, F., Weiss, A., & Scoville, N. 2002, ApJ, 580, L21
- Weinmann et al. (2009) Weinmann, S. M., Kauffmann, G., van den Bosch, F. C., Pasquali, A., McIntosh, D. H., Mo, H., Yang, X., & Guo, Y. 2009, MNRAS, 394, 1213
- Westmoquette et al. (2009) Westmoquette, M. S., Gallagher, J. S., Smith, L. J., Trancho, G., Bastian, N., & Konstantopoulos, I. S. 2009, ApJ, 706, 1571
- Yuan et al. (2010) Yuan, T., Kewley, L. J., & Sanders, D. B. 2010, ApJ, 709, 884
- Yun et al. (2001) Yun, M. S., Reddy, N. A., & Condon, J. J. 2001, ApJ, 554, 803