The Fermi-LAT view of cosmic rays and interstellar gas in the Cygnus region: a not so special spot of the Local Arm
Abstract
The Cygnus region hosts the most conspicuous star-forming region close to the Sun, embedded in a giant complex of molecular clouds in the Local Arm. We present an analysis of the Fermi-LAT observations of Cygnus intended to probe the cosmic-ray and interstellar-matter content of the region. From gamma-ray data we estimate a total of of interstellar gas in the complex at a distance of 1.4 kpc. The gamma-ray emission from the atomic gas supports the average spin temperature derived from radio absorption/emission pairs to estimate its column densities. The ratio derived in the massive Cygnus complex is consistent with other LAT estimates for clouds in the Local and Perseus arms. The mass of dark gas, escaping and CO observations but traced by dust and gamma rays, amounts to of the total. We find an average gamma-ray emissivity per interstellar H atom in the 0.1–100 GeV energy band in good agreement with measurements in other segments of the Local Arm. We infer that the cosmic-ray population averaged over a few hundred parsecs is fairly uniform in density and spectrum along the Local Arm. Despite the presence of potential accelerators and much larger interstellar densities in Cygnus compared to the solar neighborhood, their cosmic-ray populations are similar on such a scale.
1 Introduction
Interstellar -ray emission produced by cosmic-ray (CR) interactions with interstellar gas, through nucleon-nucleon collisions and electron Bremmstrahlung, is a tracer of the product of CR and interstellar-matter densities throughout the Galaxy. The data which are being collected by the Fermi Large Area Telescope (LAT) [6] are therefore providing a wealth of new information on the interstellar environment of the Milky Way.
We used LAT data to characterize the CR and gas content of the Cygnus region, which is located around the Galactic longitude , tangent to the Local Arm. A super-massive molecular complex harbors the region of massive star formation known as Cygnus X, at kpc from the solar system [17]. Beyond the Local Arm two segments of the Perseus and outer spiral arms are seen in this direction.
In this contribution we present the global model that was sought for the high-energy -ray emission from Cygnus and we discuss the implications for the properties of CRs and the census of the interstellar medium (ISM) over the scale of the whole complex, i.e. a few hundred parsecs. The innermost Cygnus X region will be discussed in another contribution to this conference [22].
2 LAT Data Analysis
2.1 -ray Data
We used the first two years of the LAT survey applying stringent event selection criteria to limit the background due to misclassified CR interactions in the LAT [4] and the contamination from the Earth’s atmospheric emission. We analysed LAT data in the region at Galactic longitude and latitude . Photons were used to construct maps on a angular grid and over ten bins in energy from 100 MeV to 100 GeV.
The -ray emission from this region is dominated at energies GeV by three bright pulsars: J2021+3651, J2021+4026 and J2032+4127. To increase the sensitivity to diffuse and fainter extended sources at these energies for each pulsar we removed from our data sample the photons detected in the periodic time intervals where the pulsed emission peaks, in a region around the source position with a radius approximately equivalent to the acceptance-averaged point-spread function (PSF) of the LAT as a function of energy.
2.2 Analysis Model
Since the Galaxy is transparent to high-energy -rays and the CR densities are thought to be uniform over the characteristic dimensions of interstellar complexes, we can model to first order emission from gas as a linear combination of gas column densities for the different complexes along the line of sight and the different phases of the ISM.
Column densities of atomic hydrogen, , were derived from the observations of its 21-cm line [12, 13]. Column densities of molecular gas are assumed to be proportional to the integrated intensities of the 2.6-mm line, [7, 8], . and CO data were used to build maps of gas column densities partitioned along the line of sight to separate the Cygnus complex from the spiral arms in the outer Galaxy, according to the method described in [3, 5].
The dark neutral gas which is missed by and CO observations was recovered by a dust excess map [11], namely by the visual extinction estimated from the 2MASS source Catalog [10, 19, 20] minus the best-fit linear combination of the afore described and CO maps.
The emission from interstellar gas is therefore modeled as a linear combination of the , CO and maps with free combination coefficients independently in each energy bin. These combination coefficients are the emissivities, i.e. -ray emission rates, per H atom, , per unit, , and per unit, .
The interstellar emission model is completed by the large-scale Galactic inverse-Compton emission produced by CR electrons interacting with low-energy radiation fields, which was modeled using the GALPROP code111http://galprop.stanford.edu/, run 54_87Xexph7S. An isotropic background component, with free normalization in each independent energy bin, was added to take into account the isotropic -ray emission and the residual background from misclassified CR interactions in the LAT.
Several sources are included in the model: all the sources in the first LAT source Catalog (1FGL) which are identified, associated at high confidence level with Active Galactic Nuclei or show strong variability. We then introduced some extended sources detected with LAT data: the supernova remnants known as the Cygnus Loop [14] and Cygni, the source VER J2019+407 [23] and the extended source in the innermost part of the Cygnus X region discussed in [22]. The remainder of the three bright pulsars, phase-suppressed as described in § 2.1, was modeled for each of them by a point source to take into account the off-pulse emission and by a second source, for which, after folding with the instrument response as described in § 2.3, expected counts were set to null within the exclusion radius introduced in § 2.1, to take into account the spill-over in the PSF tails. For each source the flux was let as a free parameter independently in each energy bin.
2.3 Analysis Method
The standard LAT analysis
software222http://fermi.gsfc.nasa.gov/ssc/data/
analysis/documentation/Cicerone/
was used to calculate the energy-dependent exposure, which was then scaled to take into account the
selection on pulsar phases (§ 2.1). The analysis model described above was corrected for
the exposure and convolved with the PSF, to obtain the number of counts expected from the model in
each pixel of the maps. This was then fit to the LAT data by a maximum-likelihood method based on
Poisson statistics in order
to determine the best model parameters.
The analysis was performed using the Instrument Response Functions (IRFs) of the series P6_V3 [18]. The relative systematic uncertainties described therein are taken into account in the interpretation of the results.
3 Results and Discussion
3.1 The Issue of the Spin Temperature
The preparation of the maps described in § 2.2 requires to account for the optical depth of the gas, which is usually done by assuming a uniform value of the so-called spin temperature, . No simple solutions of the -line transfert equation exist beyond the approximation of uniform . We therefore explored a wide range of possible average temperatures from 100 K to (optically thin medium). The corresponding maximum-likelihood values obtained from the -ray analysis are shown in Fig. 1.
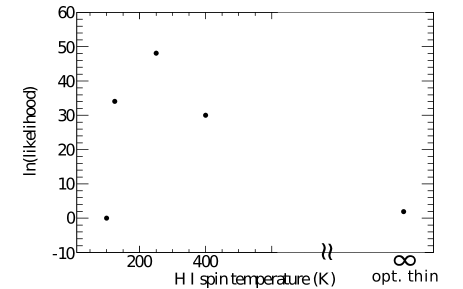
The results support the average values of a few hundred K estimated from radio absorption-emission pairs [9] to estimate the column densities. The spin temperature, however, is known to be not uniform: we used the different values explored to gauge the subsequent uncertainties affecting the results.
3.2 CR Densities in Cygnus and along the Local Arm
Fig. 2 shows the spectrum of -ray emissivity per H atom in the Cygnus complex, which is consistent with the predictions based on the CR spectra directly measured near the Earth and -ray emission from the nearby interstellar space as observed by the LAT [1].
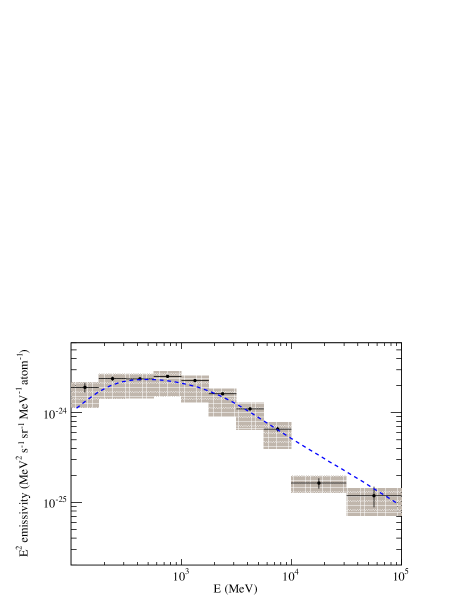
Fig. 3 compares the emissivity integrated above 200 MeV in the Cygnus complex and other segments of the Local Arm and regions toward the outer Galaxy [3, 5, 15].
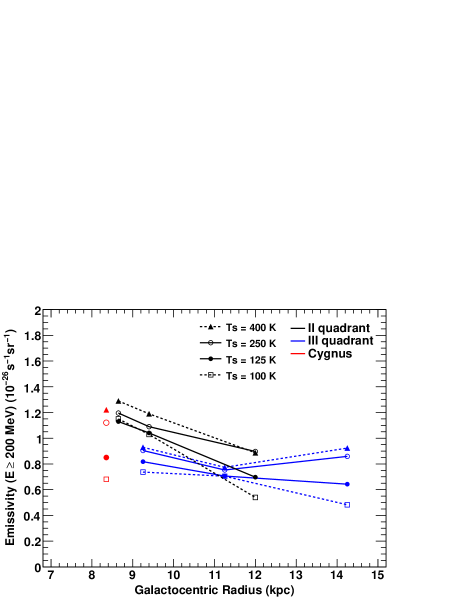
Given the large uncertainties due to the issue of the spin temperature (§ 3.1), Fig. 3 shows that the CR population averaged over a scale of a few hundred pc is uniform within along the Local Arm.
3.3 The Census of the Interstellar Medium
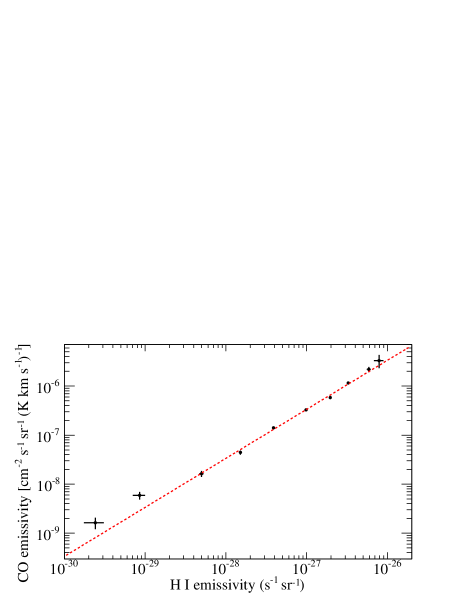
By the definition , we obtain . Assuming that the CR densities are the same in all the phases of an interstellar complex, we expect . We therefore expect the emissivity per unit to linearly scale as the emissivity per H atom, . This is verified in Fig. 4 (left), with good confidence in the 0.1–10 GeV energy range. A small () deviation is seen GeV (i.e. at low emissivities), possibly due to the hard extended emission [22] observed in the innermost Cygnus X region where most of the CO-bright gas is located. From the slope of the best-fit linear relation we can derive and estimate the masses of CO-bright gas.
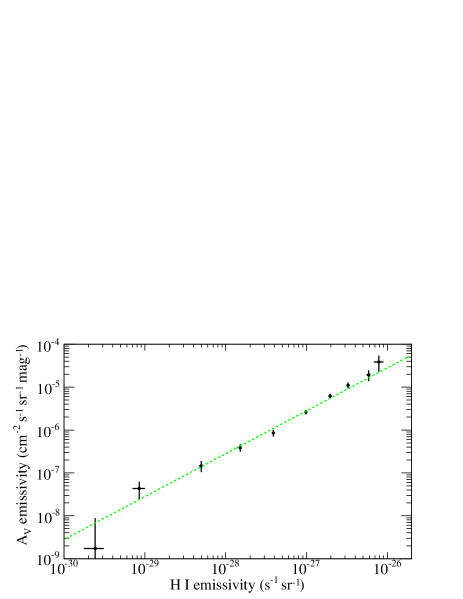
We similarly expect the emissivity per unit to linearly scale as the emissivity per H atom, as we verified in Fig. 4 (right). The linear correlation implies that -ray emission associated to dust excesses and atomic gas is produced by the same physical processes, i.e. that indeed trace interstellar gas. From the best-fit linear relation we can derive the dust-to-gas ratio in the dark neutral phase, , and estimate its mass. Whether the dark neutral gas is CO-quiet molecular gas or atomic gas missed because of the approximations in the handling of the radiative transfert of the line should be investigated in the future.
Assuming a distance of 1.4 kpc from the solar system, the total masses estimated on the basis on the LAT data analysis amount to in the Cygnus complex, of which in the form of atomic gas, in the form of CO-bright molecular gas and in the form of dark neutral gas.
The ratio obtained for the Cygnus complex appears consistent with estimates from LAT data in other segments of the Local Arm and in the Galactic disc over a few kpc beyond the solar circle (Fig 5).
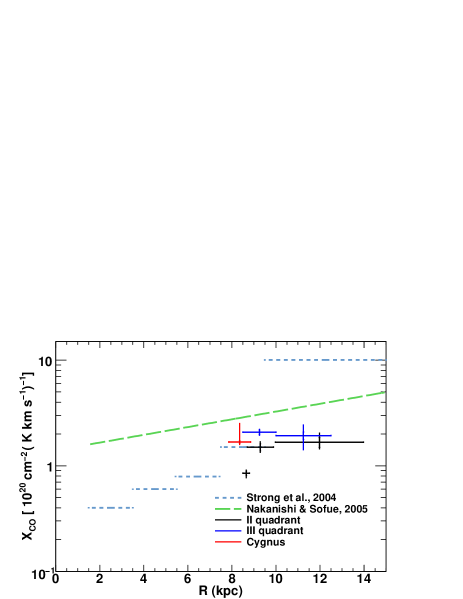
It is significantly larger than the measurement for the nearby clouds of Cassiopeia and Cepheus [3]; the origin of this difference will be investigated in the future.
4 Summary
The Cygnus region appears as a very peculiar segment of the Local Arm because of the large masses of interstellar gas, confirmed by its -ray emission, and the intense massive-star formation activity, and therefore the potential presence of numerous particle accelerators. Despite these peculiarities, the properties of CRs over the scale of the whole complex are similar to those of other segments of the Local Arm studied with LAT data.
Acknowledgments
The Fermi LAT Collaboration acknowledges support from a number of agencies and institutes for both development and the operation of the LAT as well as scientific data analysis. These include NASA and DOE in the United States, CEA/Irfu and IN2P3/CNRS in France, ASI and INFN in Italy, MEXT, KEK, and JAXA in Japan, and the K. A. Wallenberg Foundation, the Swedish Research Council and the National Space Board in Sweden. Additional support from INAF in Italy and CNES in France for science analysis during the operations phase is also gratefully acknowledged.
References
- [1] A. A. Abdo et al., ApJ, 2009, 703: 1249
- [2] A. A. Abdo et al., ApJS, 2010, 187: 460
- [3] A. A. Abdo et al., ApJ, 2010, 710: 133
- [4] A. A. Abdo et al., PRL, 2010, 104: 101101
- [5] M. Ackermann et al., ApJ, 2011, 726: 81
- [6] W. B. Atwood et al., ApJ, 2009, 697: 1071
- [7] T. M. Dame et al., ApJ, 2001, 547: 792
- [8] T. M. Dame, 2011, arXiv:1101.1499
- [9] J. M. Dickey et al., ApJ, 2009, 693: 1250
- [10] D. Fröbrich and J. Rowles, MNRAS, 2010, 406: 1350
- [11] I. A. Grenier et al., Science, 2005, 307: 1292
- [12] M. M. Hanson et al., ApJ, 2003, 597: 957
- [13] P. M. Kalberla et al., A&A, 2005, 440: 775
- [14] H. Katagiri et al., 2011, submitted
- [15] T. Mizuno et al., this conference (0802)
- [16] H. Nakanishi, Y. Sofue, PASJ, 2006, 58: 847
- [17] M. Negueruela et al., A&A, 2008, 487: 575
- [18] R. Rando, 2009, arXiv:0907.0626
- [19] J. Rowles and D. Fröbrich, MNRAS, 2009, 395: 1640
- [20] N. Schneider et al., A&A, 2011, 529: A1
- [21] A. W. Strong et al., A&A, 2004, 422: L47
- [22] L. Tibaldo et al., this conference (0705)
- [23] A. Weinstein et al., 2009, arXiv: 0912.4492