Synchronous imaging for rapid visualization of complex vibration profiles in electromechanical microresonators
Abstract
Synchronous imaging is used in dynamic space-domain vibration profile studies of capacitively driven, thin n+ doped poly-silicon microbridges oscillating at rf frequencies. Fast and high-resolution actuation profile measurements of micromachined resonators are useful when significant device nonlinearities are present. For example, bridges under compressive stress near the critical Euler value often reveal complex dynamics stemming from a state close to the onset of buckling. This leads to enhanced sensitivity of the vibration modes to external conditions, such as pressure, temperatures, and chemical composition, the global behavior of which is conveniently evaluated using synchronous imaging combined with spectral measurements. We performed an experimental study of the effects of high drive amplitude and ambient pressure on the resonant vibration profiles in electrically-driven microbridges near critical buckling. Numerical analysis of electrostatically driven post-buckled microbridges supports the richness of complex vibration dynamics that are possible in such micro-electromechanical devices.
pacs:
87.64.-t, 07.10.Cm, 85.85.+j, 05.45.-aI Introduction
Suspended resonant nano- and micro-electro-mechanical systems (NEMS and MEMS) find use in versatile applications, such as ultra-sensitive mass detectors, rf filters, and switching devices Craig (2000); Roukes1 (2005). As device miniaturization advances, optimization of the overall characteristics in high-frequency MEMS/NEMS resonators becomes increasingly complex and linked with various mechanical, electrical, thermal and optical parameters of the system and its environment. This compounds their seemingly superior sensitivity to environmental conditions, such as the pressure, temperature and chemical composition of the surrounding gas.
In the characterization of NEMS and MEMS under periodic electrical actuation, vibration profile (VP) measurements are important in conjunction with frequency-domain spectral studies Craig (2000); Roukes1 (2005); Pressure_dep (2011); Carr (1999); Max (2000). While the latter yield important mechanical properties, the former can be useful in many applications, including optimization of the excitation parameters, aiding the identification of sites most effective for localized functionalization to enable sensing, and in studies of dissipation effects such as intrinsic and pressure-dependent damping Pressure_dep (2011). Space-domain profiling is crucial in the presence of significant nonlinearities where boundary conditions become critical RonLif (2008). For instance, in typical capacitive electrical drive configuration, the force between the grounded substrate and a device fabricated by patterned suspended poly-crystalline silicon (polySi) film (serving as an electrode) is inherently nonlinear with the drive amplitude and film stress Craig (2000); Roukes1 (2005); Pressure_dep (2011); Carr (1999); Max (2000); RonLif (2008).
With interferometric reflection-mode optical transduction Carr (1999), thermoacoustic effects can significantly modify the effective device stiffness or induce autoparametric optical drive Max (2000). We observe all these effects to be significant in NEMS/MEMS devices defined on films with low compressive residual stress under applied loads near to the Euler critical value Buckled_exp (1999). At the critical point, MEMS devices are most sensitive to changes induced by stress variations in chemically-reactive coatings SensorReview (2011); Darren (2010). Of additional practical interest are possible non-uniformities of mechanical and electrical film properties across the wafer, originating from growth processes and application of anisotropic etch, which directly affect each circumferentially-clamped microresonator (R) Buckled_exp (1999). Fast space-domain visualization of resonant VPs serves as a direct means to study the physics of all these effects on the single device micro-scale during its actuation.
VPs in MEMS are traditionally imaged optically with vibrometric Pressure_dep (2011), interferometric intMZ (2001); intHeterodyne (2008), or stroboscopic Strobo (2002); YL (2010) microscopy. Recently, spatiotemporal evaluation of resonant VPs in high-frequency MEMS Rs was demonstrated using resonant realtime synchronous imaging (RSI) with a pulsed low duty-cycle nanosecond laser YL (2010). The main feature of stroboscopic imaging is a rapid production of time-resolved interference pattern movies and static profiles, as well as the fast evaluation of VPs, thus supplanting scanned motorized probes that are expensive and inherently slow. This technique is applicable with mechanical resonant frequencies up to GHz. In this paper, we use RSI YL (2010) in averaging mode to rapidly characterize the VPs in bridge Rs close to critical stress as a function of the drive amplitude and ambient pressure. The effects of high drive nonlinearity and air damping on the resonator VPs are directly monitored.
II Experimental method
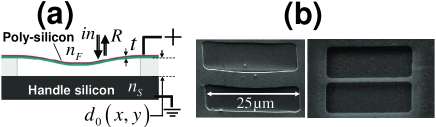
Rs are fabricated by standard top-down micromachining methods, where bridges are defined photolithographically on compressively-stressed n+ doped polySi films, deposited by low pressure chemical vapor deposition over a sacrificial oxide layer and wet-etch released. Upon release of doubly clamped bridges, residual stress is relieved through buckling Buckled_exp (1999); Darren (2010). The devices are driven capacitively with the moving R serving as an electrode and the silicon substrate serving as a bottom ground electrode. The inset in Fig. 1(a) shows the schematics of a buckled R cross section, as well as definitions we use, and Fig. 1(b) shows SEM images of our released bridges.
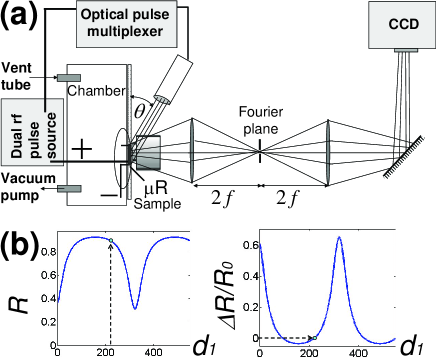
In Fig. 2(a) a schematic of our RSI configuration is illustrated. A dual channel pulse source feeds the R and optical imaging pulse source (=661.5 nm) in synchrony. The collimated illumination at a glancing angle is reflected off the R and collected by an objective lens followed by a lens pair, the latter of which is used for spatial waveform filtering at the Fourier plane with a phase mask Fourier (1978). The outgoing light is finally imaged on a standard CCD camera. Changes in the reflection with respect to the static image of the R, due to resonant motion, are monitored as a function of the rf source frequency , voltage and phase. The pressure within the chamber is set with a vacuum pump and venting tubes, and monitored via a Pirani gauge. In order to calibrate the physical VPs from measured reflection images, an interferometric analysis is carried out in the out-of-plane direction (shown in Fig. 1(a)), as detailed below. Application of a 50% duty-cycle to the imaging pulses (full synchronization with the capacitive drive), high in-phase sensitivity to average differential actuation amplitudes is attained at the expense of lost temporal resolution.
For calibration of the physical VPs from measured reflectivity images, a Fabry-Pèrot interferometer multilayer analysis, as a function of the total elevation Interference_book (1995), is performed using knowledge of the static film elevation profile , thickness , and the refractive indices of the film (n-doped polySi, =3.916) and substrate (single crystal Si, =3.834). The reflectance coefficients are calculated from the effective reflectivity matrix, assuming nearly normal incidence:
| (3) | |||
| (6) |
where is the effective phase of layer and is the wave number. Denoting the reference image of the static reflection, the contrast signal measured during actuation corresponds to:
| (7) |
Under full synchronization of the sampling beam with the drive frequency and phase, the observed average amplitude at transverse position is then:
| (8) |
With full sampling synchronization and a periodic unipolar square wave excitation, the observed average amplitude at transverse position is . The glancing angle of illumination (see Fig. 1(a)) introduces an additional scaling factor . The peak VP average amplitude, as measured away from the static beam position, is then:
| (9) |
giving rise to a normalization factor of 2.83 in our implementation, with . A glancing angle also introduces shadow effects at the resonator edges, which we can easily eliminate with appropriate phase masks at the Fourier plane (see Fig. 1(a)). We consider only reflection variations at the positions of the R itself to constitute its real VPs. An example of the total and differential reflectance curves as function of the total elevations is shown in Fig. 2(b). Using Eqs. (1)-(4), together with the calibration curve, the average maximum amplitude profiles are estimated. Here we will concentrate on characterizations of the fundamental (lowest) resonant mode.
III Results and Discussion
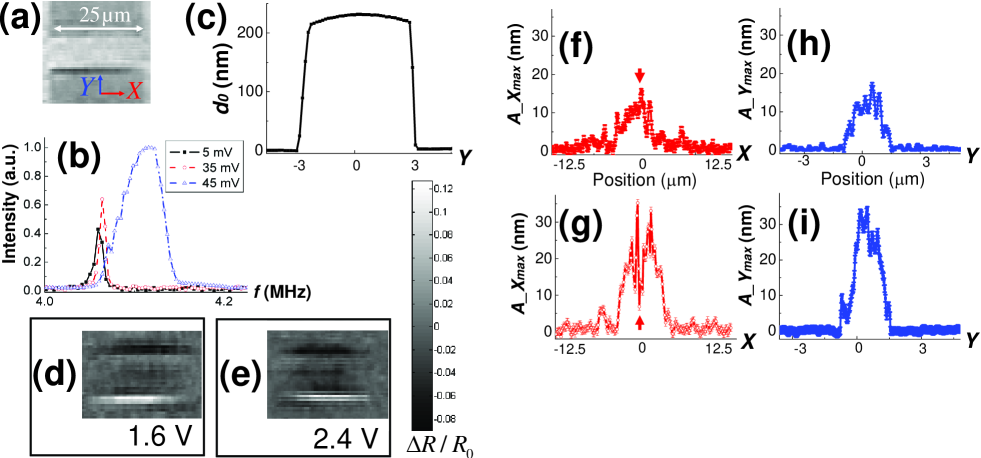
In Fig. 3 we study a R of dimensions (2560.14 m3) and a midpoint elevation of 220 nm under low pressure settings (P1 Torr). The undriven R is almost flat (see Fig. 3(c)) whereas other slightly longer devices exhibit noticeable static upward buckling, suggesting the existence of a compressive force whose magnitude is close to critical load. Highly buckled resonators have been found as hard to drive electrostatically. Figure 3(a) shows a static optical image of the unactuated device in its initial reference configuration. In Fig. 3(b), the frequency response under low-voltage actuation is shown. Even with drive amplitudes as low as 45 mV and a dc bias of 5 V, we observe the formation of Duffing nonlinearity RonLif (2008) and significant spectral broadening, with a sudden frequency detuning between 35 and 45 mV drive voltage. An AFM measurement of the static bridge height profile, in the transverse () direction, is shown in Fig. 3(c), and the profile is uniform in the axial () direction, indicating a shell-like bridge profile. RSI images with intermediate and high ac drive voltages, at a frequency corresponding to the maximum resonant amplitude, optimal phase and a dc bias of 5 V, are shown in Figs. 3(d) and 3(e), respectively. Following the image analysis for amplitude calibration, as detailed in the experimental section, and integration along the beam width (), the peak VP amplitude -profiles are shown in Figs. 3(f) and 3(g), respectively. The peak VP amplitude -profiles, integrated and averaged along , are also shown in Figs. 3(h) and 3(i). With intermediate drive amplitudes the VP shapes are as shown in Fig. 3(f) and 3(h). With high drive amplitudes, central regions on the beam appear to undergo diminished displacement at the original frequency (Fig. 2(g)). However, detuning of the imaging frequency in these cases to values near multiples of the fundamental mechanical frequency and the same phase settings show some tiny components of vibration at these locations. We interpret this observation as resulting from either nonlinear electromechanical processes inducing transfer of energy to higher harmonics at locations of high vibration amplitudes on the R, or from optical nonlinearity due to the measured response crossing extreme reflection points. In any case, positions with diminished signal, such as the one indicated by the vertical arrows in Figs. 3(f),(g) would clearly not be beneficial to employ in phase-locked-loop (PLL) sensing applications, using this class of Rs, at this wavelength. Along the -profiles, slight localization of the motion at the central region of the bridge is also observed with high drives.
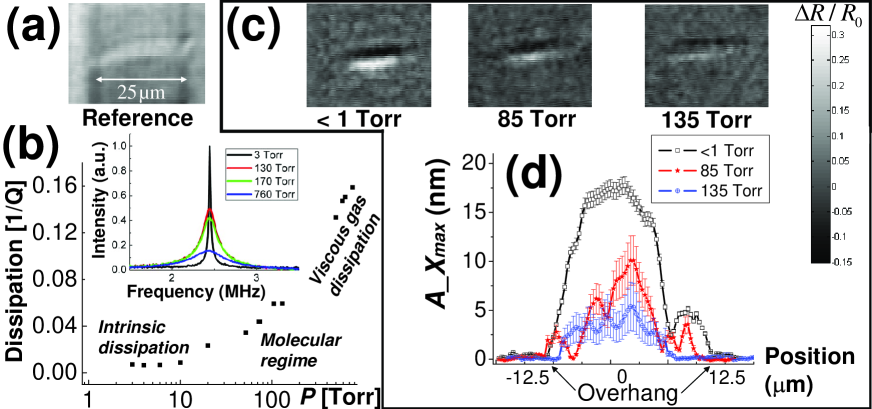
Figure 4 shows studies using a narrow microbridge of dimensions (2510.12 m3) and a midpoint elevation of 660 nm (=120 nm and =660 nm) under varying ambient hydrostatic pressure and constant driving conditions of 1.2 V ac voltage and 5 V dc bias. This bridge is slightly buckled in the upward direction, as observed in the static optical reference image of Fig. 4(a). Figure 4(b) shows the dissipation (inverse quality factor, ) of the fundamental resonant mode as a function of pressure, and corresponding spectra (inset). Different pressure ranges correspond to well-known dominant dissipation mechanismsPressure_dep (2011); Darren2 (2009). The total quality factor is known to approximately scale according to Darren2 (2009):
| (10) |
Where is the intrinsic (material) quality factor, is the coefficient of viscous damping and is the pressure. In the data corresponding to Fig. 4(b), a linear fit yields and in this R.
In the current experiment we have succeeded in recording RSI images of sufficient contrast only at pressures below the viscous (gas-dominated) regime, namely, corresponding to the intrinsic and molecular regimes in Fig. 4(b). It is estimated that the most significant limiting factors are the low spectral signal-to-noise bandwidth (S/N) at low quality factors (below 20) combined with diminished amplitudes of motion under external air damping. Figure 4(c) shows RSI images of the R as a function of increasing pressure, with a transition from intrinsic to molecular damping. Calibrated maximum amplitude -profiles, integrated across the beam width (), are shown in Fig. 4(d). Increased errors in the VP estimations result from diminished available S/N, giving rise to less accurate numerical fits. We consistently find that with increasing pressure, the VPs in this R become suppressed around the regions close to the bridge overhang (see Fig. 4(d)). This edge suppression effect is not observed in repeated experiments under low pressure and drive conditions (0.3 V ac voltage and 5 V dc bias), that yield available signal-to-noise close to the detection limit, with extracted vibration amplitudes comparable to the highest pressure case shown here and with more pronounced motion near the overhang.
IV Numerical Model
The dynamics of a compressively stressed beam are described by the equation Nayfeh (2004); Slava (2011):
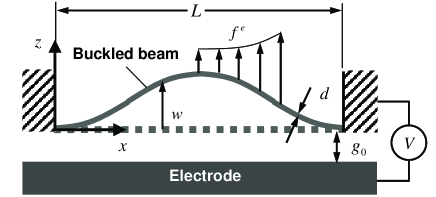
where now is the Young’s modulus of the beam material, is the moment of inertia of the beam cross section, is the sectional area, is the beam length, is the density, and and are the thickness and width of the beam, respectively. In addition, is distance between the ends of the flat side of the beam and the electrode (electrostatic gap), is the vacuum permittivity and is the time-dependent actuation voltage. In accordance with the definitions in Fig. 5, the elevation of the beam , as well as the electrostatic force , which is calculated using the simplest parallel capacitor approximation formula, are considered positive upwards.
Equation (5) has been reduced to the system of coupled nonlinear ordinary differential equations by means of the Galerkin decomposition with linear undamped eigenmodes of a straight beam used as base functions. The equaations were solved numerically using the ODE45-solver implemented in Matlab. The details of the formulation and numerical approach used for the analysis are found in Slava (2011) (see also Nayfeh (2004)).
V Numerical Results
Figures 6-8 show numerical solutions of Eq. (5). In all cases, the actuation voltage contained both ac and dc bias components, such that . Zero initial conditions, corresponding to the post-buckled configuration of the beam in rest, were used. In all cases, Young’s modulus =150 GPa and density =2300 kg/m3 corresponding to polySi were used.
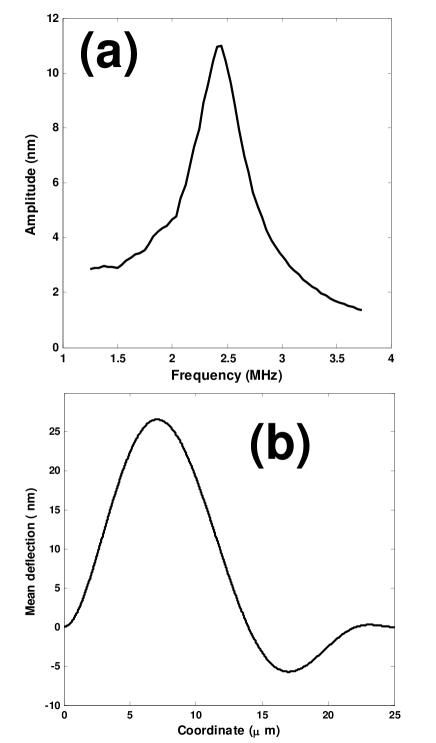
Figure 6(a) shows the resonant response of the beam with dimensions (2510.12 m3) and electrostatic gap =660 nm. The axial force was chosen such that the midpoint elevation of the beam above its ends was 155 nm. The driving voltages were V and V, and the quality factor was =7. It is observed that the fundamental resonant frequency is 2.45 MHz, which is close to the experimentally observed value (Fig. 4(b)). The corresponding resonant displacement profile, averaged over a single period, is shown in Fig. 6(b). Small initial imperfection of 0.05 in the initial buckled height, corresponding to an excitation of the second anti-symmetric mode, was introduced in order to allow non-symmetric mode shapes of the beam. Calculations show that while the actual beam profiles are dominated by the fundamental mode, the resonant deflection profiles (i.e., the differences between the initial buckled shapes and the actual, time dependent shapes of the vibrating beam) could be more complex.

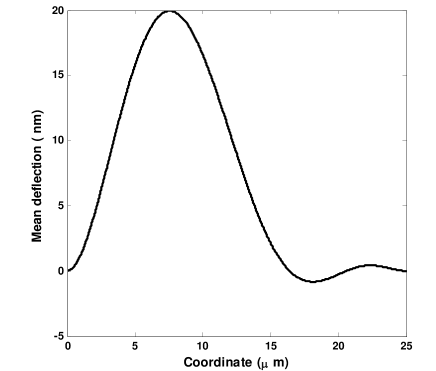
A decrease in the initial separation between the beam and the electrode results in an increased contribution of higher modes in the resonant VPs. Figure 7 shows time-resolved snapshots of the VPs (relative displacements from equilibrium) with the same dimensions as in Fig. 6, but with =220 nm; Figure 8 shows the same vibration profile as averaged over a single period. Small initial imperfection of 0.05 in the initial buckled height, corresponding to a contribution of the second buckled mode, was again used as an initial condition. Complex displacement profiles are clearly observed in this case as well.
VI Conclusion
Synchronous imaging has been demonstrated as a robust method for direct and rapid observations of gradual changes in resonant vibration profiles of electromechanical microresonators under varying conditions of drive and ambient pressure. Synchronous imaging can serve as a useful tool for studying fundamental processes in resonant MEMS/NEMS, as well as for identification of favorable device positions most suitable for sensitive phase-locked applications, such as sensors, filters and switches. Numerical analysis of electrostatically driven post-buckled microbridges supports the richness of the complex resonant vibrations that are possible in these micro-electromechanical systems.
VII Acknowledgments
This research was funded by the National Science Foundation (grants DMR-0908634 and DMR-0520404) and Analog Devices. Fabrication was performed at the Cornell Nanoscale science and technology Facility.
References
- Craig (2000) H. G. Craighead, Science 290, 5496 (2000).
- Roukes1 (2005) K. L. Ekinci and M. L. Roukes, Rev. Sci. Instrum. 76, 061101 (2005).
- Pressure_dep (2011) R. C. Tung RC, J. W. Lee, H. Sumali, and A. Raman, J. Micromech. Microeng. 21, 025003 (2011); R. A. Bidkar, R. C. Tung, A. A. Alexeenko, H. Sumali, and A. Raman, Appl. Phys. Lett. 94, 163117 (2009); H. Sumali, J. Micromech. Microeng. 17, 2231 (2007).
- Carr (1999) D. W. Carr, S. Evoy, L. Sekaric, H. G. Craighead, and J. M. Parpia, Appl. Phys. Lett. 75, 920 (1999).
- Max (2000) M. Zalalutdinov, A. Zehnder, A. Olkhovets, S. Turner, L. Sekaric, B. Ilic, D. Czaplewski, J. M. Parpia, and H. G. Craighead, Appl. Phys. Lett. 79, 695 (2001); B. Ilic, S. Krylov, K. Aubin, R. Reichenbach, and H. G. Craighead, Appl. Phys. Lett. 86, 193114 (2005).
- RonLif (2008) R. Lifshitz and M. C. Cross, Review of Nonlinear Dynamics and Complexity (Wiley, Meinheim, 2008), Vol. I, pp. 1-52.
- Buckled_exp (1999) W. Fang, C.-H. Lee, and H.-H. Hu, J. Micromech. Microeng. 9, 236 (1999).
- SensorReview (2011) A. Boisen, S. Dohn, S. S. Keller, S. Schmid, and M. Tenje, Rep. Prog. Phys. 74, 036101 (2011).
- Darren (2010) D. R. Southworth, L. M. Bellan, Y. Linzon, H. G. Craighead, and J. M. Parpia, Appl. Phys. Lett. 96, 163503 (2010).
- intMZ (2001) G. G. Fattinger and P. T. Tikka, Appl. Phys. Lett. 79, 290 (2001).
- intHeterodyne (2008) K. Kokkonen and M. Kaivola, Appl. Phys. Lett. 92, 063502 (2008).
- Strobo (2002) C. Rembe and R. S. Muller, J. Microelectromech S. 11, 479 (2002).
- YL (2010) Y. Linzon, S. Krylov, B. Ilic, D. R. Southworth, R. A. Barton, B. R. Cipriany, J. D. Cross, J. M. Parpia, and H. G. Craighead, Opt. Lett. 15, 2654 (2010).
- Darren2 (2009) D. R. Southworth, H. G. Craighead, and J. M. Parpia, Appl. Phys. Lett. 94, 213506 (2009).
- Fourier (1978) J. D. Gaskill, Linear Systems, Fourier Transforms, and Optics (Wiley, New York, 1978).
- Interference_book (1995) M. Bass, Handbook of Optics, 2nd ed. (McGraw-Hill, San Francisco, 1995), Vol. I, pp. 42.10-42.14.
- Slava (2011) S. Krylov, B. R. Ilic, and S. Lulinsky, Nonlinear Dyn. 66, 403 (2011).
- Nayfeh (2004) S. A. Emam and A. H. Nayfeh, Nonlinear Dyn. 35, 1 (2004).