Imaging with HST the time evolution of Eta Carinae’s colliding winds 11affiliation: Support for program 12013 was provided by NASA through a grant from the Space Telescope Science Institute, which is operated by the Association of Universities for Research in Astronomy, Inc., under NASA contract NAS 5-26555.
Abstract
We report new HST/STIS observations that map the high-ionization forbidden line emission in the inner arcsecond of Eta Car, the first that fully image the extended wind-wind interaction region of the massive colliding wind binary. These observations were obtained after the 2009.0 periastron at orbital phases 0.084, 0.163, and 0.323 of the 5.54-year spectroscopic cycle. We analyze the variations in brightness and morphology of the emission, and find that blue-shifted emission (400 to 200 ) is symmetric and elongated along the northeast-southwest axis, while the red-shifted emission (100 to 200 ) is asymmetric and extends to the north-northwest. Comparison to synthetic images generated from a 3-D dynamical model strengthens the 3-D orbital orientation found by Madura et al. (2011), with an inclination 138°, argument of periapsis 270°, and an orbital axis that is aligned at the same PA on the sky as the symmetry axis of the Homunculus, 312°. We discuss the potential that these and future mappings have for constraining the stellar parameters of the companion star and the long-term variability of the system.
1 Introduction
Eta Carinae, one of the most luminous, variable objects in our Milky Way, is sufficiently close ( kpc, Smith 2006) that we can study many of its properties throughout the electromagnetic spectrum. As noticed by Damineli (1996), the object exhibits a 5.54-year orbital period characterized by a lengthy high ionization111Low and high ionization are used here to describe atomic species with ionization potentials (IPs) below and above 13.6 eV, the IP of hydrogen. state with multiple high ionization forbidden lines that disappear during months-long low ionization state (Damineli et al. 2008b). Eta Car is considered to be a massive, highly eccentric (, Corcoran 2005; Nielsen et al. 2005) binary consisting of , a luminous blue variable (LBV), and , a hot, less massive companion not directly seen, but whose properties have been inferred from its effects on the wind of and the photoionization of nearby ejecta (Verner et al. 2005; Teodoro et al. 2008; Mehner et al. 2010, hereafter Me10; Groh et al. 2010a, b)
The total luminosity, dominated by , is 5106 L⊙ (Davidson & Humphreys 1997), with the total mass of the binary exceeding 120 M⊙ (Hillier et al. 2001, hereafter H01). Radiative transfer modeling of HST/STIS spatially-resolved spectroscopic observations suggests that has a mass , and a stellar wind with a mass-loss rate of and terminal speed of (Hillier et al. 2001; Hillier et al. 2006, hereafter H06). Models of the observed X-ray spectrum require the wind terminal velocity of to be with a mass-loss rate of 10 yr-1 (Pittard & Corcoran 2002). The spectral type of has been loosely constrained via modeling of the inner ejecta to be a mid-O supergiant (Verner et al. 2005; Teodoro et al. 2008; Me10).
3-D numerical simulations suggest that the wind of strongly influences the very dense wind of , creating a low-density cavity and inner wind-wind collision zone (WWCZ) (Pittard & Corcoran 2002; Okazaki et al. 2008; Parkin et al. 2009). The geometry and physical conditions of this inner region have been constrained from spatially unresolved X-ray (Henley et al. 2008), optical (Nielsen et al. 2007; Damineli et al. 2008a), and near-infrared (Groh et al. 2010a, b) observations.
In addition to the interaction between the two winds in the inner region (at spatial scales comparable to the semi-major axis length, AU = 00067 at 2.3 kpc), the 3-D hydrodynamical simulations predict an outer, extended, ballistic WWCZ that stretches to distances several orders of magnitude larger than the size of the orbit (Okazaki et al. 2008; Madura 2010, hereafter M10). Observational evidence for an extended WWCZ comes from the analysis of previous HST/STIS longslit observations (G09; M10; Madura et al. 2011, hereafter M11) which revealed spatially-extended forbidden line emission from low- and high-ionization species at 01 to 07 (230 to 1600 AU) from the central core. During the high state, [Fe II] line emission extends up to 500 along the STIS slit, while [Fe III] line emission extends to 400 for STIS slit position angles close to 45°. Radiative transfer modeling of the extended [Fe III] emission (\al@madura10,madura11; \al@madura10,madura11) tightly constrains the orbital inclination, , close to the axis of inclination of the Homunculus, and the argument of periapsis 240° ° in agreement with most researchers (Damineli et al. 2008b; Groh et al. 2010a; Parkin et al. 2009 and references therein). This constraint invalidates the claim by several groups (Falceta-Gonçalves & Abraham 2009; Kashi & Soker 2009 and references therein) that periastron occurs on the near side of ().
Here we report new HST/STIS observations, the first that fully map the inner arcsecond high-ionization, forbidden line emission of Eta Car. Maps of [Fe III] 4659.35, 4702.85222All wavelengths are measured in vacuum. and [N II] 5756.19 recorded in early phases following the 2009.0 periastron event show changes in the wind structures excited by FUV radiation from . These results demonstrate that structural changes can be followed using specific forbidden lines, leading to increased knowledge about interacting wind properties, the parameters of the binary orbit and, most importantly, the stellar properties of .
2 Observations
The HST/STIS mapping observations were obtained after the successful repair of STIS during Service Mission 4. The first visit occurred in June 2009 (333All observations are referenced by cycle number relative to cycle 1 beginning 1948 February, following the convention introduced by Groh & Damineli (2004). The phase is zeroed to JD2482819.8 0.5 with period days (Damineli et al. 2008b).) as an early release observation demonstrating the repaired-STIS capabilities (Program 11506 PI=Noll). The second and third visits were scheduled in December 2009 () and October 2010 () under a CHANDRA/HST grant (Program 12013, PI Corcoran).
All observations were performed with the longslit. The strongest, most isolated, high-ionization forbidden emission lines from the inner and outer WWCZs are [Fe III] 4659, 4702 and [N II] 5756 (G09). The STIS gratings, G430M, centered at 4706, and G750M, centered at 5734, provide a spectral resolving power of about 8000.
Spatial mapping was accomplished with the standard STIS-PERP-TO-SLIT mosaic routine using the 52″01 aperture with multiple 01 offset position spacings centered on Eta Carinae. The size of the map, given limited foreknowledge of the extended forbidden emission structure, was adjusted with each visit based upon the anticipated HST/STIS longslit position angle (PA), pre-determined by the HST solar panel orientation. As buffer dumps impact the total integration time, only the central CCD rows, typically 64 (32) or 128 (64), were read out. The PAs for each visit were PA = 79°(), -121°(), and -167°(). Since a full spatial map was obtained during each visit, the PA has little effect on the results presented here (see Figures 1 and 2).
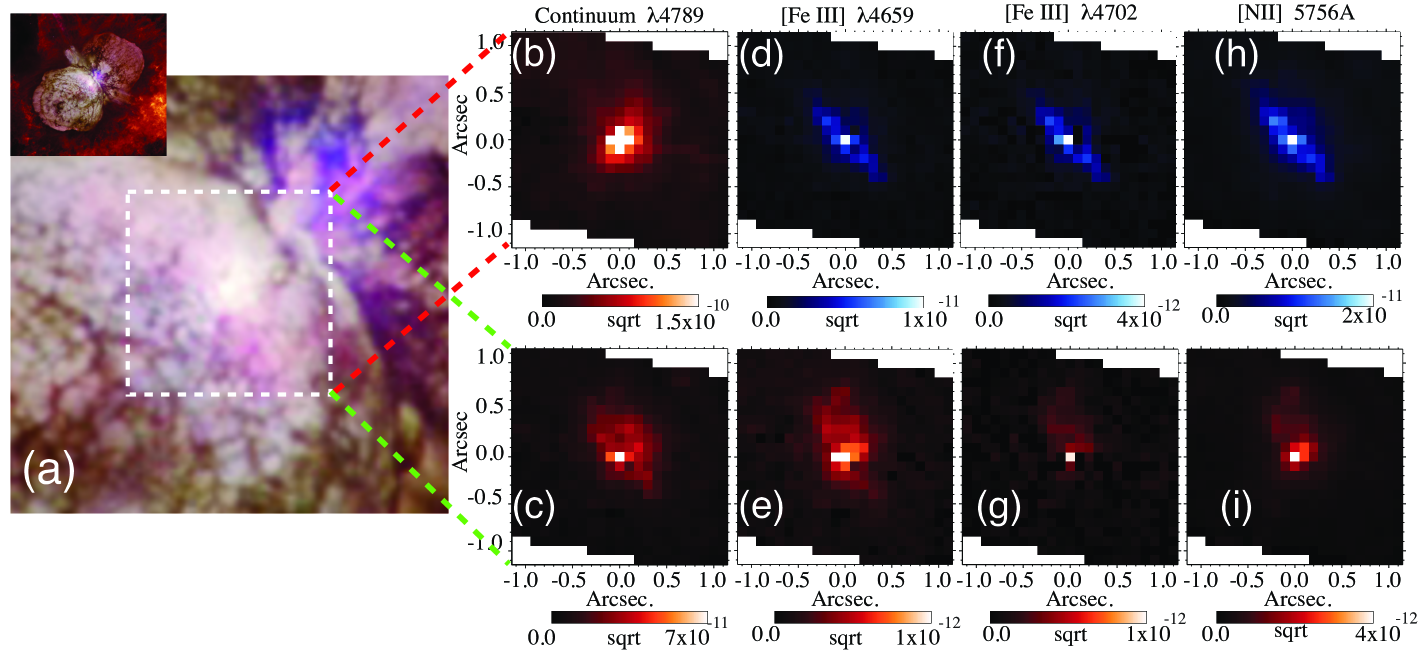
The data were reduced with STIS GTO CALSTIS software. While data quality is similar to previous HST/STIS observations of Eta Car obtained from 1998 to 2004 (Davidson et al. 2005; G09), the CCD detector has increased number of hot pixels, some bad columns, and increased charge transfer inefficiencies. Bright local continuum (Figure 1b) was subtracted from each pixel, isolating the faint forbidden line emission (Figures 1c-i, 2). Velocity channels were co-added to produce blue ( to ), low-velocity ( to ), and red (100 to 200 ) images for each of the high-ionization forbidden lines (Figure 2). Only the high velocity blue and red maps are sensitive to the wind wind interaction that we model in this present work. The low velocity maps are dominated by slow-moving, extended ejecta produced in the 19th century eruptions, and so are not discussed in detail here. A refinement to the current model will include a screen of condensations to account for the low-velocity emission.
3 Results
3.1 Morphology and time evolution of the extended wind-wind collision
For each phase, we compared velocity-separated images of [Fe III] 4659, 4702 and [N II] 5756, and found remarkable similarities in the blue and red images between the three emission lines (see Figure 1 for June 2009, 12.084). Hereafter we focus on the [Fe III] 4659 emission, which cannot be formed by the primary star alone. Emission of [Fe III] requires 16.2 eV photons from , plus thermal collisions at electron densities approaching Ne = 107 cm-3 (\al@gull09,madura10,madura11; \al@gull09,madura10,madura11; \al@gull09,madura10,madura11). By comparison, [N II] emission is produced by 14.6 eV photons at electron densities approaching Ne = 3107 cm-3. As the primary star, , produces significant numbers of 14.6 eV photons (H01), [N II] emission does not fully disappear during periastron (Damineli et al. 2008a; G09). However, the red emission from [Fe III] 4659.35 can be contaminated by blue emission from [Fe II] 4665.75. Likewise, the red emission image of [Fe III] 4702.85 may be depressed by He I 4714.47 absorption. Hence, we examined the [N II] maps to ensure little or no red high-ionization emission is present.
Figure 2 shows the time evolution of the blue, low-velocity, and red components of [Fe III] 4659 at orbital phases , 12.163, and 12.323. The morphology and geometry of the extended [Fe III] 4659 emission resolved by HST/STIS changes conspicuously as a function of velocity and time. The blue emission extends along the NE–SW direction, along , which is similar to what has been suggested from previous sparse HST/STIS long-slit observations obtained at different orbital phases across cycle 11 (G09, Me10, M10, M11). At 12.084, the linear structure is nearly symmetrical about the central region, but at later phases becomes more diffuse, shifting to the S and SE. The red emission is fuzzier, asymmetric and extends primarily to the NNW at each phase. In contrast, the low-velocity structure is larger and extends diffusely northward. The low-velocity emission is heavily dominated by emission from the Weigelt blobs (Weigelt & Ebersberger 1986) and a screen of fainter condensations (Me10), located within the wind-blown cavity and thusly obscuring the much fainter WWCZ contributions. While we describe the qualitative changes of the low-velocity component, we defer the detailed modeling of this equatorial emission to a future paper.
For discussion purposes, we now isolate the central core (inner 0303) as representative of the inner WWCZ, and a time-variant extended (0303) structure as representative of the outer WWCZ. These two regions have very different physical drivers. The central core exhibits X-ray (Pittard & Corcoran 2002) and He I emission, along with strong forbidden line emission. The outer WWCZ, expanding ballistically, is best traced by strong forbidden line emission. The spatially-extended blue and red emission components are thought to arise in the outer WWCZ of Eta Car (G09), composed of material which was earlier part of the inner WWCZ, but over the past 5.5-year period streamed outward (\al@madura10,madura11; \al@madura10,madura11). While the primary wind is estimated to have a terminal velocity of , the peak radial velocity component of the forbidden emission lines appears to be . At terminal velocity, the outer WWCZ expands at 025 per 5.5-year cycle, hence the current WWCZ, even at 0.323, is within the 0303 core.
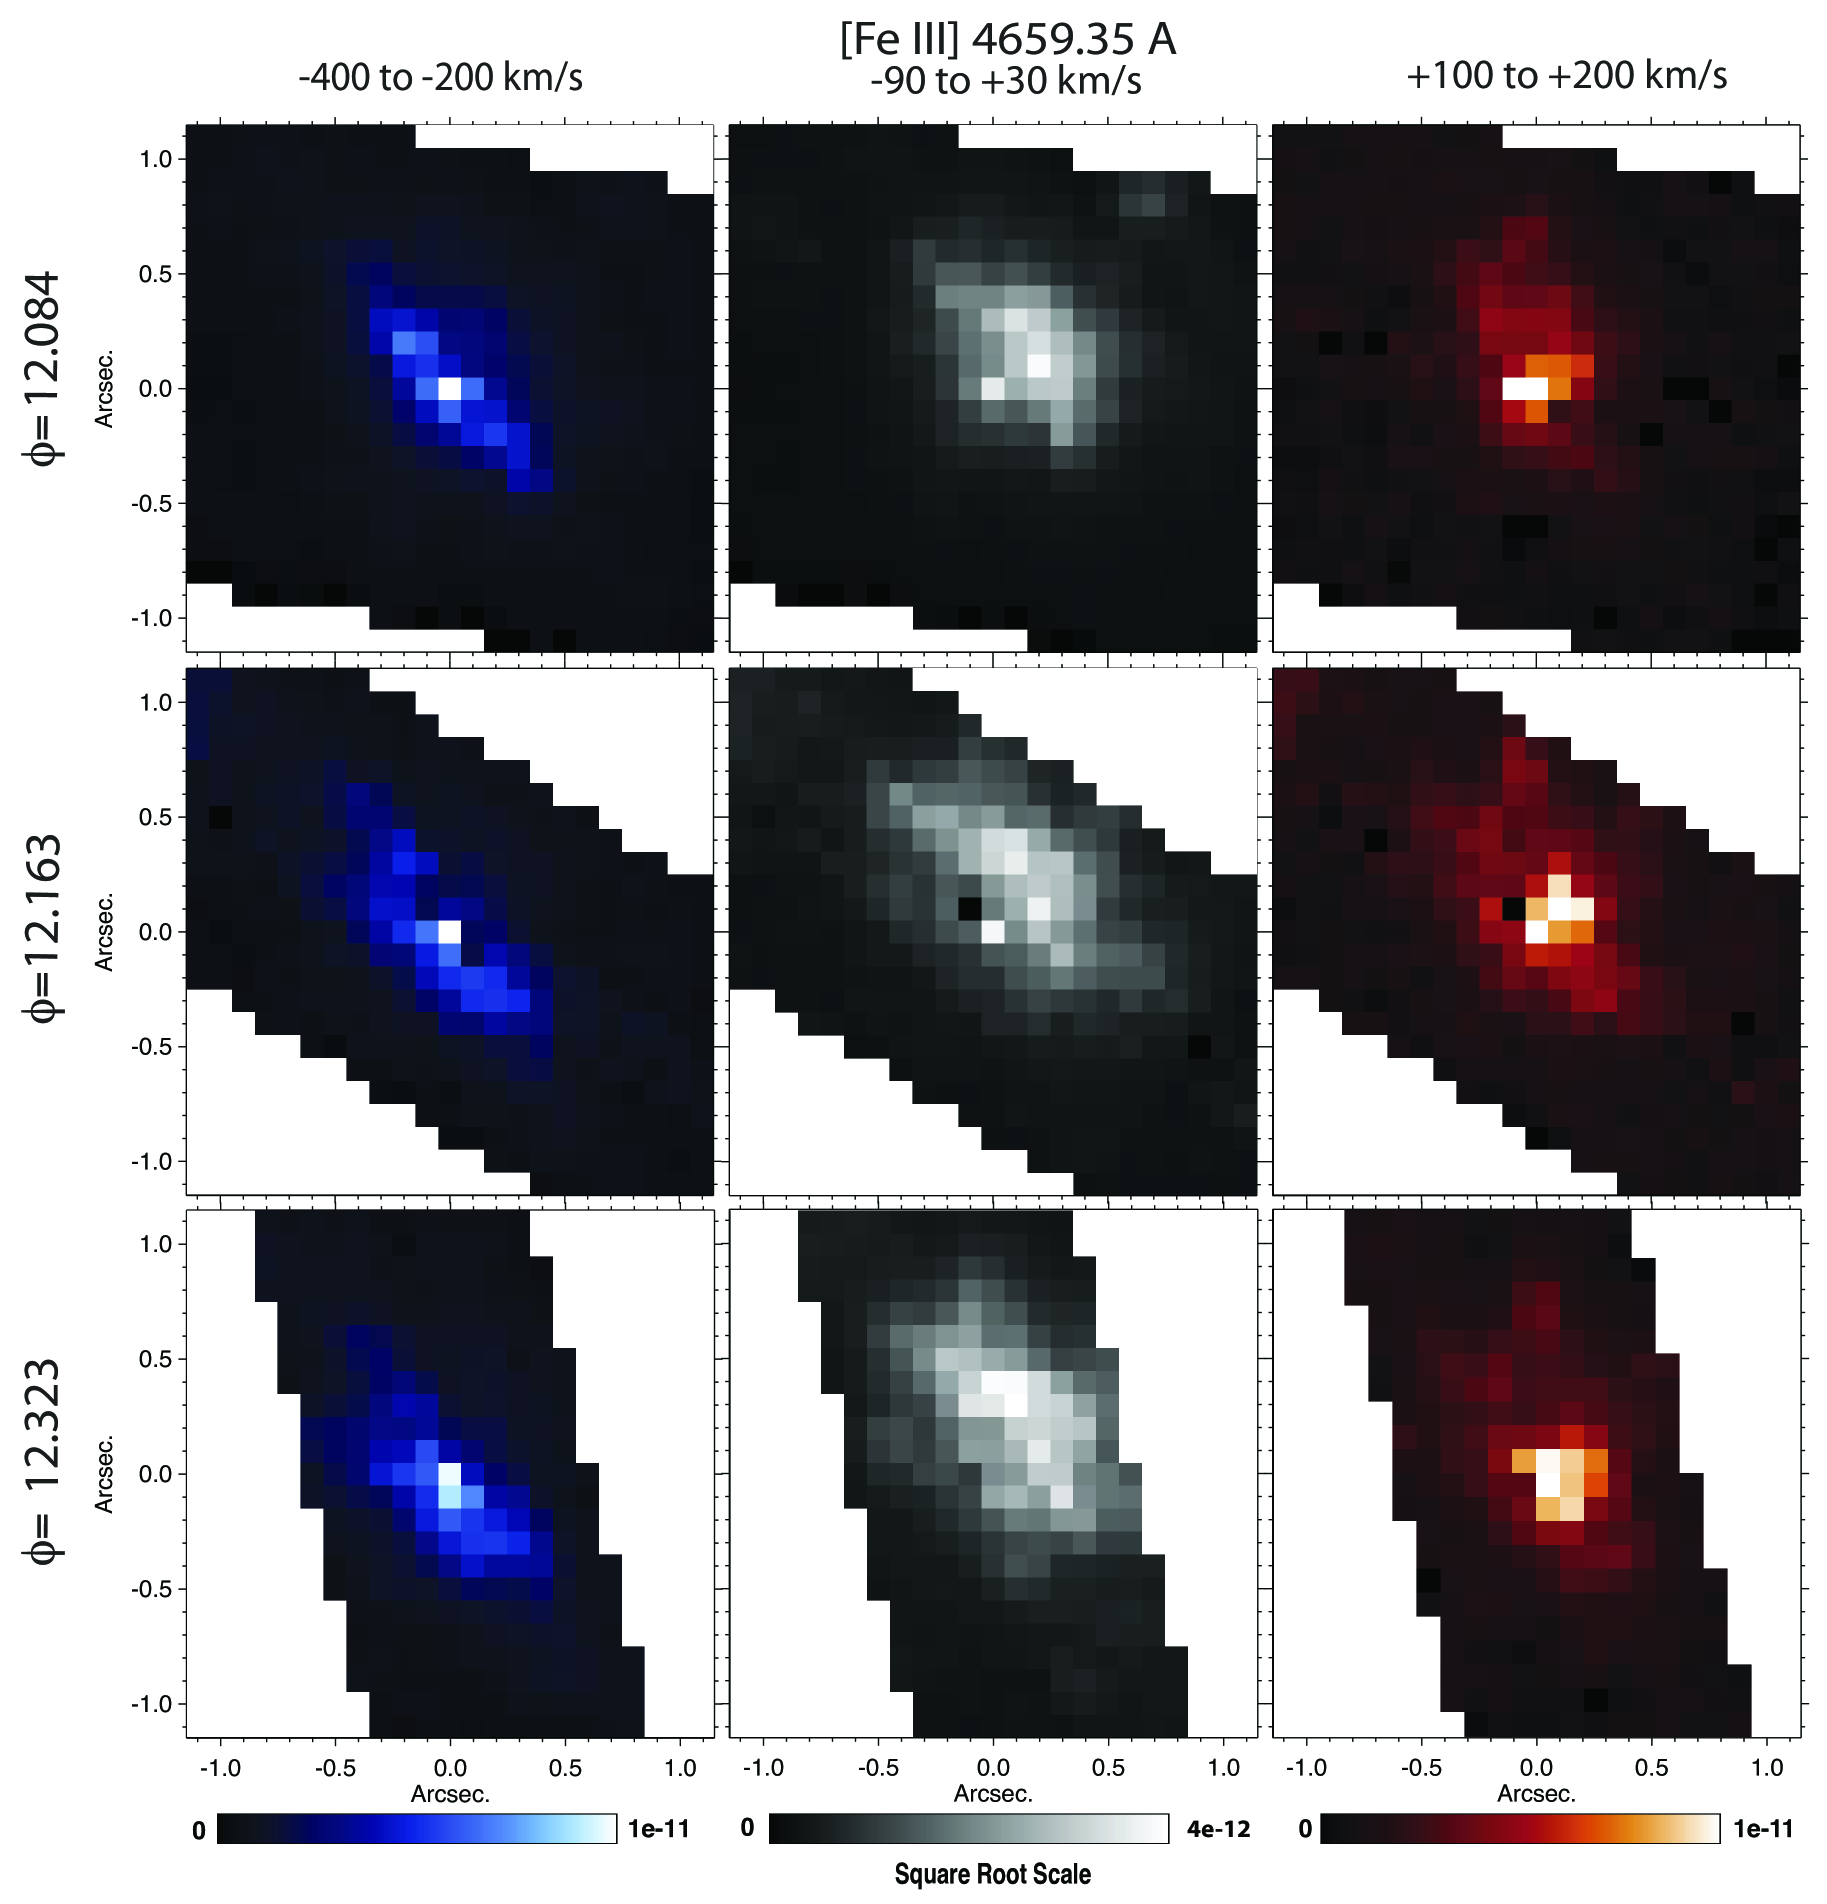
Both the central and extended structures brighten with phase, but they change differently. At 12.084, the central core accounts for 1/3 of the flux, but brightens only thirty percent by 12.323. The extended emission more than doubles in brightness by 12.323. Brightening of the velocity components within the core and extended structures are likewise different. The brightness of the red component is nearly constant for both the core and the extended structure. The core blue component increases by seventy percent while the extended blue component doubles in brightness. The core low-velocity component increases only by fifty percent, but the low-velocity extended component triples in brightness and appears to shift further outward from the core. We note that between 12.163 and 12.323 the brightest low-velocity component shifts from the vicinity of Weigelt C, noted by Me10, to Weigelt B and D.
These brightness changes in the core and extended structures support a scenario in which the current WWCZ, namely the direct collision between the winds of and , is contained within the 03 diameter core. After each periastron passage, a new secondary-wind-blown cavity must form and expand outward. The cavity rapidly approaches a balance between the FUV flux of and the cavity wall structure at critical density. However, the outer cavity wall is very thin, ionizes rapidly and drops in density allowing FUV radiation to pass outward into the much larger, ballistically expanding outer cavity formed in the previous cycle. Within this cavity, the FUV photons encounter dense walls of primary wind. The growth in brightness in the blue images, with little change in the red images, indicates expansion in the general direction of the observer. The larger increase in brightness of the low-velocity images shows where the FUV radiation escapes through the multiple cavities built up by the wind of over many cycles.
3.2 Comparison with a 3-D Dynamical Model
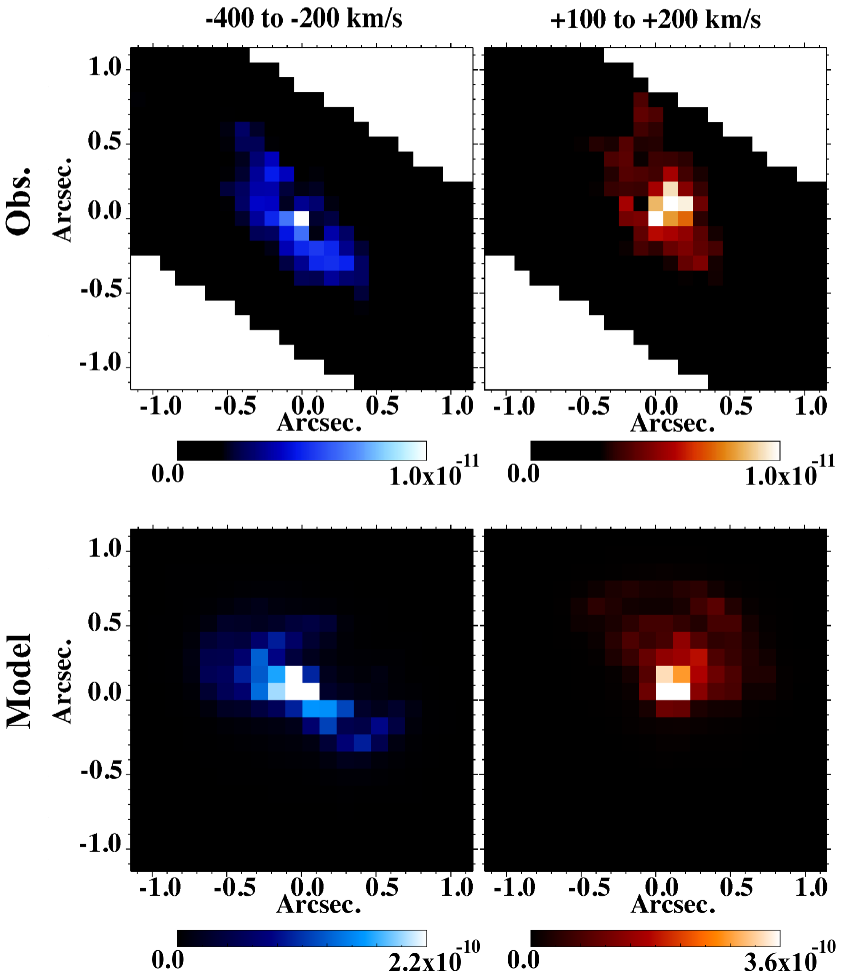
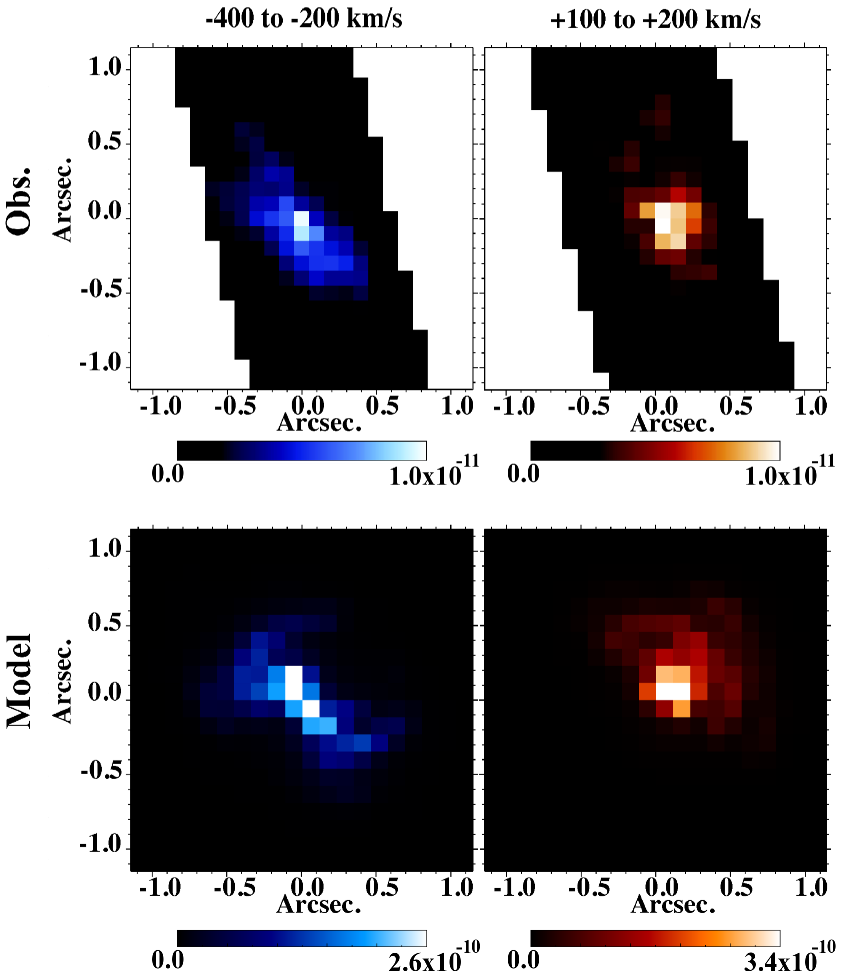
Proper interpretation of the mapping observations requires a full 3-D dynamical model that accounts for the effects of orbital motion on the WWCZ. Here we use full 3-D Smoothed Particle Hydrodynamics (SPH) simulations of Eta Car’s colliding winds and radiative transfer codes to compute the intensity in the [Fe III] 4659 line projected on the sky for a specified orbital orientation (\al@madura10, madura11; \al@madura10, madura11). The numerical simulations were performed using the same 3-D SPH code as that in Okazaki et al. (2008) with identical parameters except for the mass loss rate of , which we changed to 10-3 M⊙ yr-1 (\al@hillier01, hillier06; \al@hillier01, hillier06). The two stellar winds in our simulation are also taken to be adiabatic. In order to allow for a more direct comparison to the HST observations, the computational domain is a factor of ten larger than that of Okazaki et al. (2008) (i.e. 1600 07). Details on the radiative transfer calculations can be found in M10, M11.
Figures 3 and 4 compare the observed blue and red images at 12.163 and 12.323 with those predicted by the model for the same velocity intervals. For simplicity, the zero reference phase of the spectroscopic cycle (Damineli et al. 2008a), is assumed to coincide with the zero reference phase of the orbital cycle (i.e. periastron passage) in the 3-D SPH simulation. In a highly-eccentric binary system like Eta Car, the two values should be within a few weeks, which will not affect the overall conclusions (Groh et al. 2010b). The binary orbit is assumed to be oriented with an inclination 138°, argument of periapsis 270°, and an orbital axis that is aligned at the same PA on the sky as the symmetry axis of the Homunculus, 312° (Davidson et al. 2001)444Davidson et al. (2001) determined the Homunculus axis of symmetry to be tilted 42° into the sky plane. We refer the reader to M11 for detailed discussion of the binary orbital inclination at 138°=180°-42°..
The relatively compact central core produces little [Fe III] emission as densities in the WWCZ walls greatly exceed the critical density for efficient emission. The low-velocity maps, displayed on a flux scale similar to the scales for the blue and red images, would be blank while the observed low velocity emission, heavily dominated by flux from the Weigelt blobs and fainter slow-moving clumps, extends to the northwest. As mentioned in section 3.1, we are refining the model to include such a screen, which will be a topic in a much more encompassing paper. Hence only the red and blue components, successfully replicated in this study, are presented in Figures 3 and 4.
The spatial extent of the emission compares quite favorably between the observations and the models (Figures 3 and 4), with the blue structures extending projected distances of 1″ (2300 AU) along 45° , and the red structures displaced to the NE of the core by 01 to 04 (230 to 1000 AU). We display unreddened fluxes for the model structures due to known uncertainties of reddening. Model fluxes, reddened by 5–20 using typical *interstellar* reddening values for stars in the vicinity of Eta Car (\al@hillier01,mehner10; \al@hillier01,mehner10) agree with the observations within a factor of a few. This discrepancy could arise due to uncertainties in the assumed stellar parameters of both stars, the reddening law and atomic physics, or systematics in the radiative transfer and hydrodynamical modeling. However, reddening is highly variable across the Carinae complex. Moreover, reddening by dust in the Homunculus and within the extended core of Eta Car may change on very small scales. Hence we chose to display unreddened model fluxes in Figures 3 and 4.
4 Discussion
This work represents the first time the extended WWCZ of a massive colliding wind binary system has been imaged using high-ionization forbidden emission lines. Spatial- and velocity-extended emission, recorded by individual HST/STIS longslit observations at various phases and PAs, provided impetus to expand 3-D models to simulate the wind dynamics leading to this emission. Indeed, the initial 3-D dynamical model above produces red and blue images that are similar to those observed. From multiple longslit observations, G09, M10 and M11 demonstrated that the binary orbit could be fully constrained in 3-D. The noticeable symmetry in velocity for observations taken at PA=38° (G09) is now reinforced by the spatial symmetry about the central core in the blue maps. Our modeling, of the observed maps suggests that the argument of periapsis must be closer to 270° than 240°, thus further reinforcing the result that is on the near side of at apastron, with periastron passage on the far side (Damineli et al. 1997; Pittard & Corcoran 2002; Okazaki et al. 2008; Parkin et al. 2009; G09, M10; M11).
These and future spatial maps of Eta Car’s high-ionization forbidden emission have the potential to determine the nature of the unseen companion star . The mass-loss rate of and ionizing flux of photons from determine which regions of Eta Car’s WWCZ are photoionized and capable of producing high-ionization forbidden line emission like the forbidden emission from Fe++, due to 16.2 eV radiation. Comparing this mass model loss rates and UV fluxes to those of stellar models for a range of O (Martins et al. 2005; Me10) and WR (Crowther 2007) stars would allow one to obtain a luminosity and temperature for . Both the current model (\al@madura10, madura11; \al@madura10, madura11) and previous individual HST/STIS longslit observations (G09) show major changes with orbital phase, especially near periastron. Mappings at multiple phases around periastron are therefore essential in order to determine when the FUV radiation from becomes trapped in the dense wind of and the extended high-ionization emission vanishes, and likewise when emerges from ’s wind and the extended emission returns.
This approach has a number of advantages over previous 1-D modeling efforts to constrain ’s properties (Verner et al. 2005; \al@ mehner10), which probe the ionization structure of the Weigelt blobs. Such 1-D models make considerable assumptions about the physical conditions within the blobs and intervening material, leading to poor constraints on the luminosity of .
Eta Car is variable, not only on a 5.5-year period, but has a centuries-long history of variation, including two major eruptions (Davidson & Humphreys 1997; Humphreys et al. 2008; Smith & Frew 2010). These high-ionization forbidden emission lines are powerful tools for monitoring changes in the WWCZ, providing quantitative information on the properties of the individual binary components and changes thereof, including a historical record of the recent decade-long mass loss from the primary. Following this system will provide unique information on how a massive star, during the LBV stage, loses much of its mass on its way to becoming a supernova.
We sincerely thank G. Weigelt, S. Owocki, A. Damineli and A. Okazaki for many fruitful discussions and encouragements. TG acknowledges the hospitality of MPIR during his multiple visits. We thank the referee for insightful comments leading to an improved presentation.
References
- Corcoran (2005) Corcoran, M. F. 2005, AJ, 129, 2018
- Crowther (2007) Crowther, P. A. 2007, ARA&A, 45, 177
- Damineli (1996) Damineli, A. 1996, ApJL, 460, L49
- Damineli et al. (1997) Damineli, A., Conti, P. S., & Lopes, D. F. 1997, New Astronomy, 2, 107
- Damineli et al. (2008a) Damineli, A., Hillier, D. J., Corcoran, M. F., et al. 2008a, MNRAS, 386, 2330
- Damineli et al. (2008b) Damineli, A., Hillier, D. J., Corcoran, M. F., et al. 2008b, MNRAS, 384, 1649
- Davidson & Humphreys (1997) Davidson, K. and Humphreys, R.M. 1997, ARA&A, 35, 1
- Davidson et al. (2005) Davidson, K., Martin, J., Humphreys, R. M., et al. 2005, AJ, 129, 900
- Davidson et al. (2001) Davidson, K., Smith, N., Gull, T. R., Ishibashi, K., & Hillier, D. J. 2001, AJ, 121, 1569
- Falceta-Gonçalves & Abraham (2009) Falceta-Gonçalves, D., & Abraham, Z. 2009, MNRAS, 399, 1441
- Groh & Damineli (2004) Groh, J. H., & Damineli, A. 2004, Information Bulletin on Variable Stars, 5492, 1
- Groh et al. (2010a) Groh, J. H., Madura, T. I., Owocki, S. P., Hillier, D. J., & Weigelt, G. 2010a, ApJ, 716, L223
- Groh et al. (2010b) Groh, J. H., Nielsen, K. E., Damineli, A., et al. 2010b, A&A, 517, A9+
- Gull et al. (2009) Gull, T. R., Nielsen, K. E., Corcoran, M. F., et al. 2009, MNRAS, 396, 1308 (G09)
- Henley et al. (2008) Henley, D. B., Corcoran, M. F., Pittard, J. M., et al. 2008, ApJ, 680, 705
- Hillier et al. (2001) Hillier, D. J., Davidson, K., Ishibashi, K., & Gull, T. 2001, ApJ, 553, 837 (H01)
- Hillier et al. (2006) Hillier, D. J., Gull, T., Nielsen, K., et al. 2006, ApJ, 642, 1098 (H06)
- Humphreys et al. (2008) Humphreys, R. M., Davidson, K., & Koppelman, M. 2008, AJ, 135, 1249
- Kashi & Soker (2009) Kashi, A., & Soker, N. 2009, MNRAS, 397, 1426
- Madura (2010) Madura, T. I. 2010, PhD thesis, University of Delaware (M10)
- Madura et al. (2011) Madura, T. I., Gull, T. R., Owock, S. P., Groh, J. H., Okazaki, A. T., & Russell, C. M. P. 2011b, MNRAS, submitted (M11)
- Martins et al. (2005) Martins, F., Schaerer, D., and Hillier, D. J. 2005, A&A, 436, 1049
- Mehner et al. (2010) Mehner, A., Davidson, K., Ferland, G. J., & Humphreys, R. M. 2010, ApJ, 710, 729 (Me10)
- Nielsen et al. (2007) Nielsen, K. E., Corcoran, M. F., Gull, T. R., et al. 2007, ApJ, 660, 669
- Nielsen et al. (2005) Nielsen, K. E., Gull, T. R., & Vieira Kober, G. 2005, ApJS, 157, 138
- Okazaki et al. (2008) Okazaki, A. T., Owocki, S. P., Russell, C. M. P., & Corcoran, M. F. 2008, MNRAS, 388, L39
- Parkin et al. (2009) Parkin, E. R., Pittard, J. M., Corcoran, M. F., Hamaguchi, K., & Stevens, I. R. 2009, MNRAS, 394, 1758
- Pittard & Corcoran (2002) Pittard, J. M. & Corcoran, M. F. 2002, A&A, 383, 636
- Smith & Frew (2010) Smith, N. and Frew, D. J. 2010, arXiv:1010.3719
- Smith (2006) Smith, N. 2006, ApJ, 644, 1151
- Teodoro et al. (2008) Teodoro, M., Damineli, A., Sharp, R. G., Groh, J. H., & Barbosa, C. L. 2008, MNRAS, 387, 564
- Verner et al. (2005) Verner, E., Bruhweiler, F., & Gull, T. 2005, ApJ, 624, 973
- Weigelt & Ebersberger (1986) Weigelt, G. & Ebersberger, J. 1986, A&A, 163, L5