Spin Lifetime in Small Electron Spin Ensembles Measured by Magnetic Resonance Force Microscopy
Abstract
Magnetic Resonance Force Microscopy can enable nanoscale imaging of spin lifetime. We report temperature dependent measurements of the spin correlation time of the statistical fluctuations of the spin polarization—the spin noise—of ensembles containing electron spins by this technique. Magneto-mechanical relaxation due to spin-cantilever coupling was controlled and spurious mechanisms that can affect the spin correlation time of the microscopic signal were characterized. These measurements have ramifications for optimizing spin sensitivity, understanding local spin dynamics and for nanoscale imaging.
Magnetic Resonance Force Microscopy (MRFM) s:rmp ; h:MagHandbook can detect magnetic resonance from very small spin ensembles with single electron spin sensitivity r:singlespin . For small spin ensembles, statistical fluctuations of the net spin polarization r:maminStatisticalPolarization ; r:NoiseNMRprl2007 exceed the Boltzmann polarization. Spin noise is a topic of intrinsic interest Crooker:spinnoise.nature04 as it reveals fundamental information about the microscopic environment around the measured spins. Spin relaxation provides a powerful approach to probing electronic, magnetic and structural dynamics in materials slichter , and plays an important role in Magnetic Resonance Imaging (MRI) where - and -weighting are used to enhance image contrast Haacke:MRI . The signal-to-noise ratio (SNR)—singularly important for high resolution MRFM imaging—is centrally influenced by spin lifetime because it determines the detection bandwidth.
Here, we report measurements of in nanoscale ensembles containing 100 electron spins. The number of resonant spins and the correlation time of their fluctuations are characterized in MRFM experiments by the spectral weight and linewidth, respectively. Ideally, the spin-lattice relaxation time in the rotating frame, , determines mozyrsky:CantRxn ; r:CantileverInducedNuclearRelaxation . We present systematic measurements of the evolution of with spin modulation depth, microwave power and sample temperature. We argue, based on these data, that the relaxation time we measure in these experiments are due to intrinsic mechanisms.
Care must be taken to avoid artificially shortening the spin correlation time through mechanisms of technical origin such as the higher order cantilever oscillation modes r:hundredspin ; mozyrsky:CantRxn ; r:CantileverInducedNuclearRelaxation , violation of adiabaticity r:wago98 ; r:MaminStatisticalNMR , and low frequency fluctuations of the field of the micromagnetic probe r:magflucttheory . We avoided these by using mass-loaded cantilevers r:MassLoadedCantilever , large cantilever oscillation magnitudes and large transverse oscillating magnetic fields . We find that the temperature dependence of are intrinsic to the sample and are well explained by phonon mediated relaxation processes.
Our experiments were performed in vacuum between 4.2 and 40 K on an optically polished piece of vitreous silica (see Ref. Fong:dissertation, for details). We measure electron spins present at a density of cm-3. These spins reside in silicon dangling bonds associated with oxygen vacancy defects known as E’ centers, which are produced by 60Co gamma irradiation Castle:EprimePhysRev1963 ; Castle:silica.jap1965 ; Castle:PhysRev1965 ; Yip:OxygenVacancyModel ; Weil:ESRinQuartzReview . The sample is thermally anchored to a temperature controlled copper block. The IBM-style ultrasoft cantilever we used has a spring constant mN/m and a mass-loaded tip to suppress tip motion r:MassLoadedCantilever arising from thermal excitation of higher order cantilever oscillation modes mozyrsky:CantRxn . The probe magnet is a SmCo5 particle glued to the cantilever and ion-milled to a tapered end whose size is about nm2. It has coercivity and anisotropy fields greater than 1 T at low temperature, thus avoiding spin relaxation induced by fluctuations of the probe magnetic field r:magflucttheory . The cantilever frequency is 3062.15 Hz with the tip attached. The transverse oscillating (2.162 GHz) magnetic field is generated by a superconducting microwave resonator r:scresonator . The experiments were performed with no external magnetic field applied.
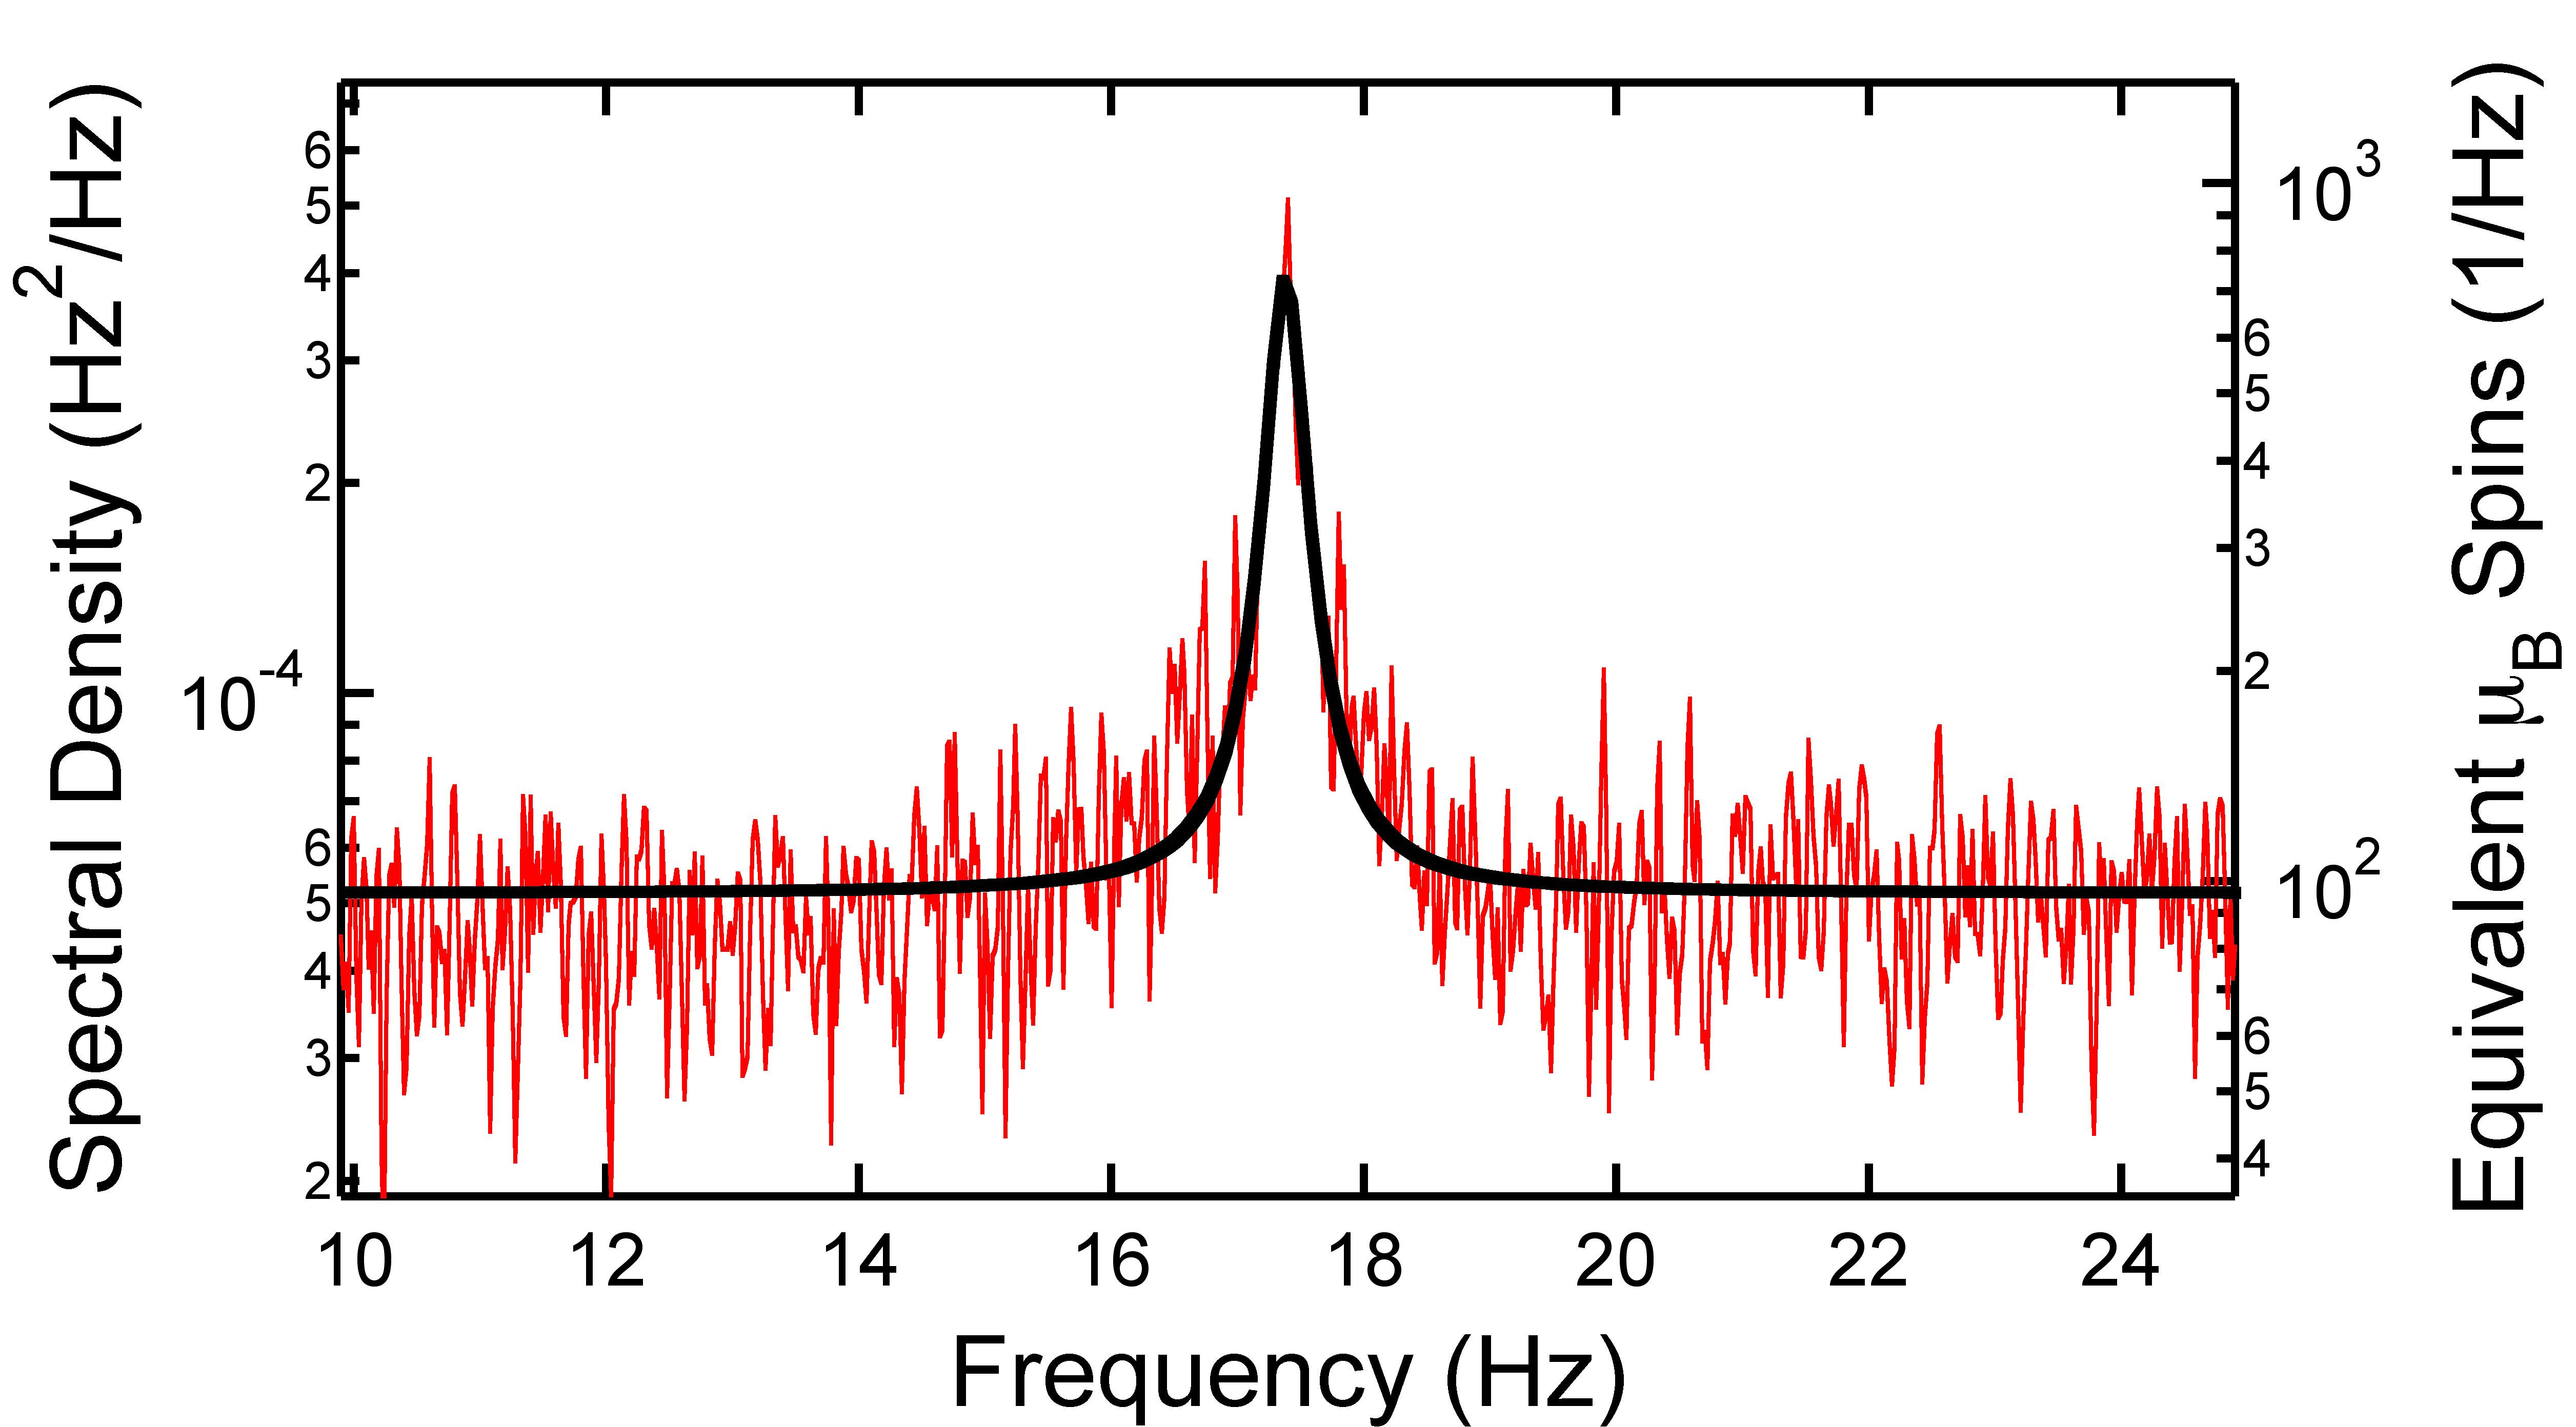
We used the iOSCAR protocol r:maminStatisticalPolarization to excite magnetic resonance and measured the resulting cantilever frequency shift resulting from the modulated magnetic interaction between the electron spins and the micromagnetic probe on the cantilever. Random and uncorrelated spin noise leads to a Lorentzian frequency dependence of the power spectral density of these frequency shifts (see Fig. 1) as in the random telegraph signal model r:singlespin ; Davenport:RandomSignal :
| (1) |
where is the iOSCAR modulation frequency and is the average frequency-signal energy from resonant electron spins. The area under the Lorentzian in Fig. 1 is 162 mHz2; this gives a force signal energy of 534 aN2; the two are related by Berman:OSCAR ; r:maminStatisticalPolarization . The measured tip field gradient is about 1.3 G/nm, so the statistical polarization is due to approximately 302 electron spins ( = 17.4) in a detected volume. The noise floor, 13 aN/, is primarily due to thermal force noise and corresponds to spin sensitivity of electrons in a 1 Hz bandwidth. Hereafter both and are taken from a fit to the single side-band power spectral density obtained by means of a software lock-in amplifier with a bank of low pass filters r:singlespin ; r:NoiseNMRprl2007 to improve SNR. Most of the data points take about 1 hour for averaging.
The correlation time is determined by the relaxation time in the rotating frame averaged over the distribution of effective field frequencies experienced during an adiabatic inversion cycle mozyrsky:CantRxn ; r:CantileverInducedNuclearRelaxation . In the absence of excess low frequency spin fluctuations, approaches Ailion:UltraslowMotions ; JacquinoGoldman:RotatingFrameRelaxation . If the spin spends most of its time far off-resonance, that is, if either the microwave frequency modulation or the product of the cantilever oscillation amplitude and the probe gradient is large (ensuring that the extremum of the time-varying effective magnetic field in the rotating frame is much larger than ), and if the adiabatic condition is satisfied, then in iOSCAR should approach .
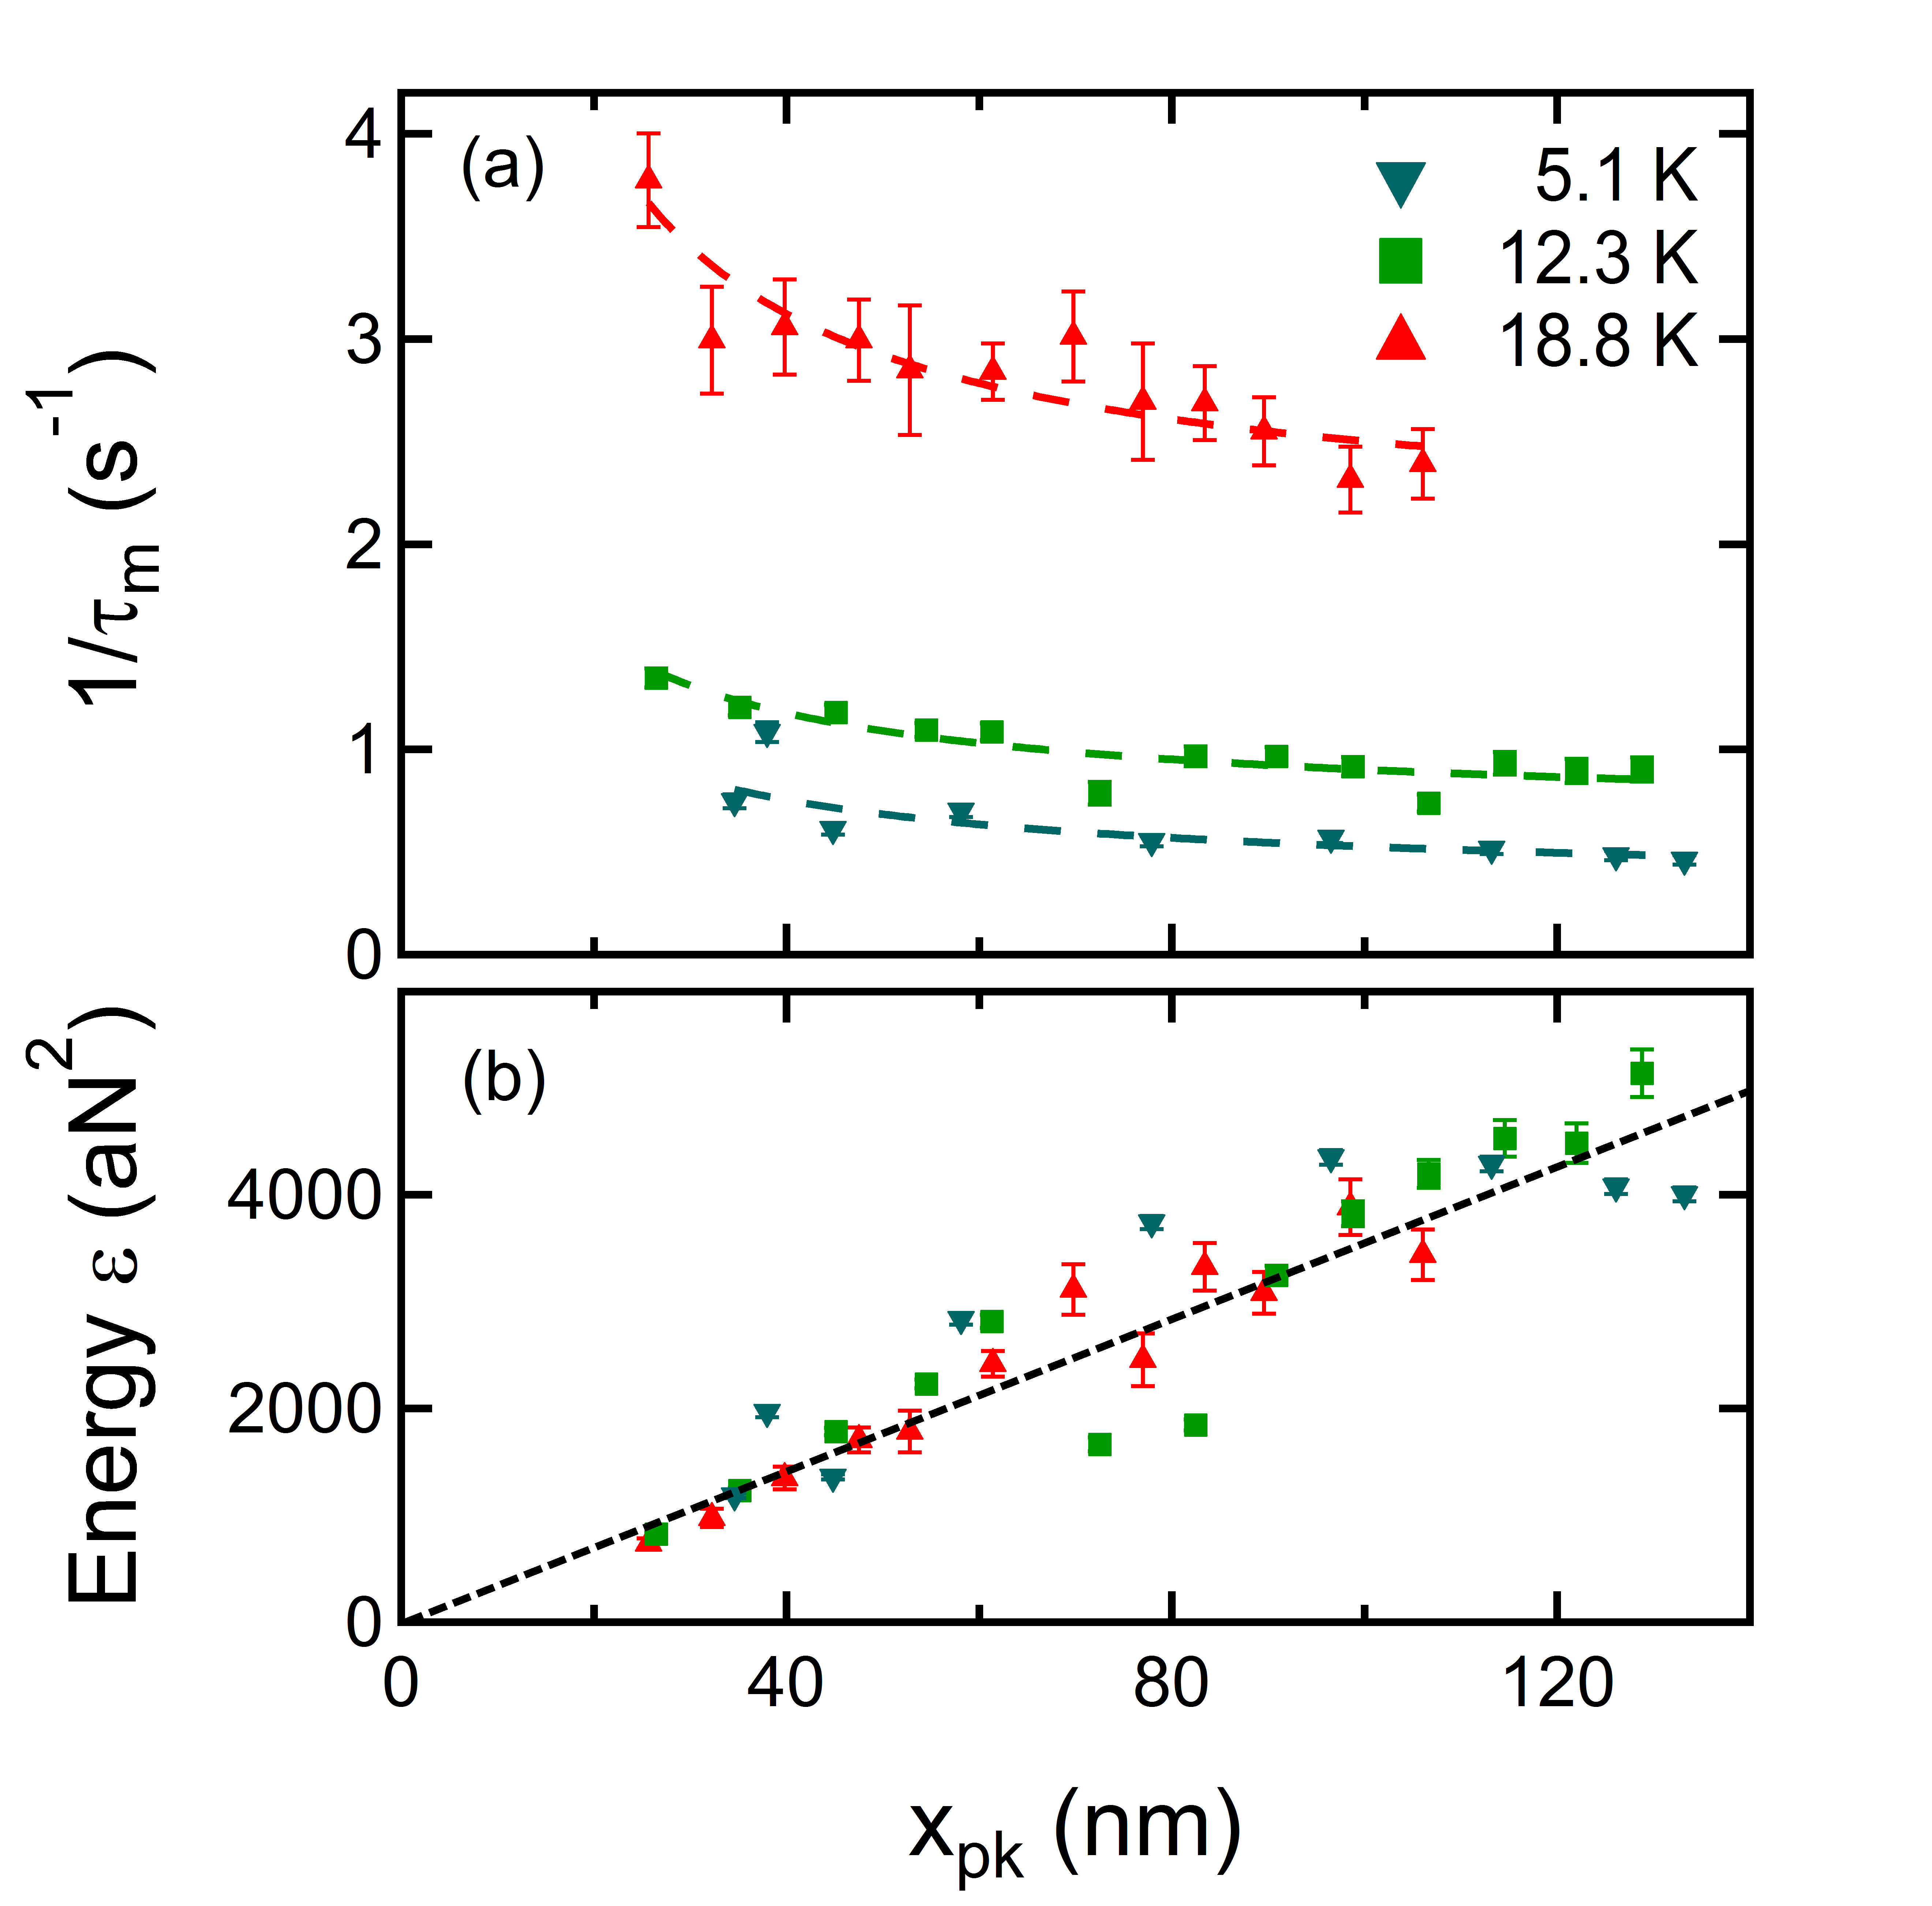
We explored the dependence of on at three temperatures (see Fig. 2). Similar to JacquinoGoldman:RotatingFrameRelaxation , we find decreases asymptotically to the temperature dependent intrinsic relaxation rate: where (dashed lines). As the resonant slice sweeps through larger volumes with increasing , increases linearly (lower panel).

Both violation of adiabaticity and magnetic field fluctuations due to higher order cantilever modes r:wago98 ; r:MaminStatisticalNMR ; r:hundredspin ; mozyrsky:CantRxn ; r:CantileverInducedNuclearRelaxation can limit . To ensure our results are free of such artifacts, we studied the dependence of on microwave power : Fig. 3 shows to be independent of for mW. At low power, increases due to violation of adiabaticity (black dashed line) or other mechanisms (the shoulder near 0.15 mW). The measured signal energy increases and saturates as increases. Thus we can access a measurement parameter regime in which measures intrinsic relaxation.
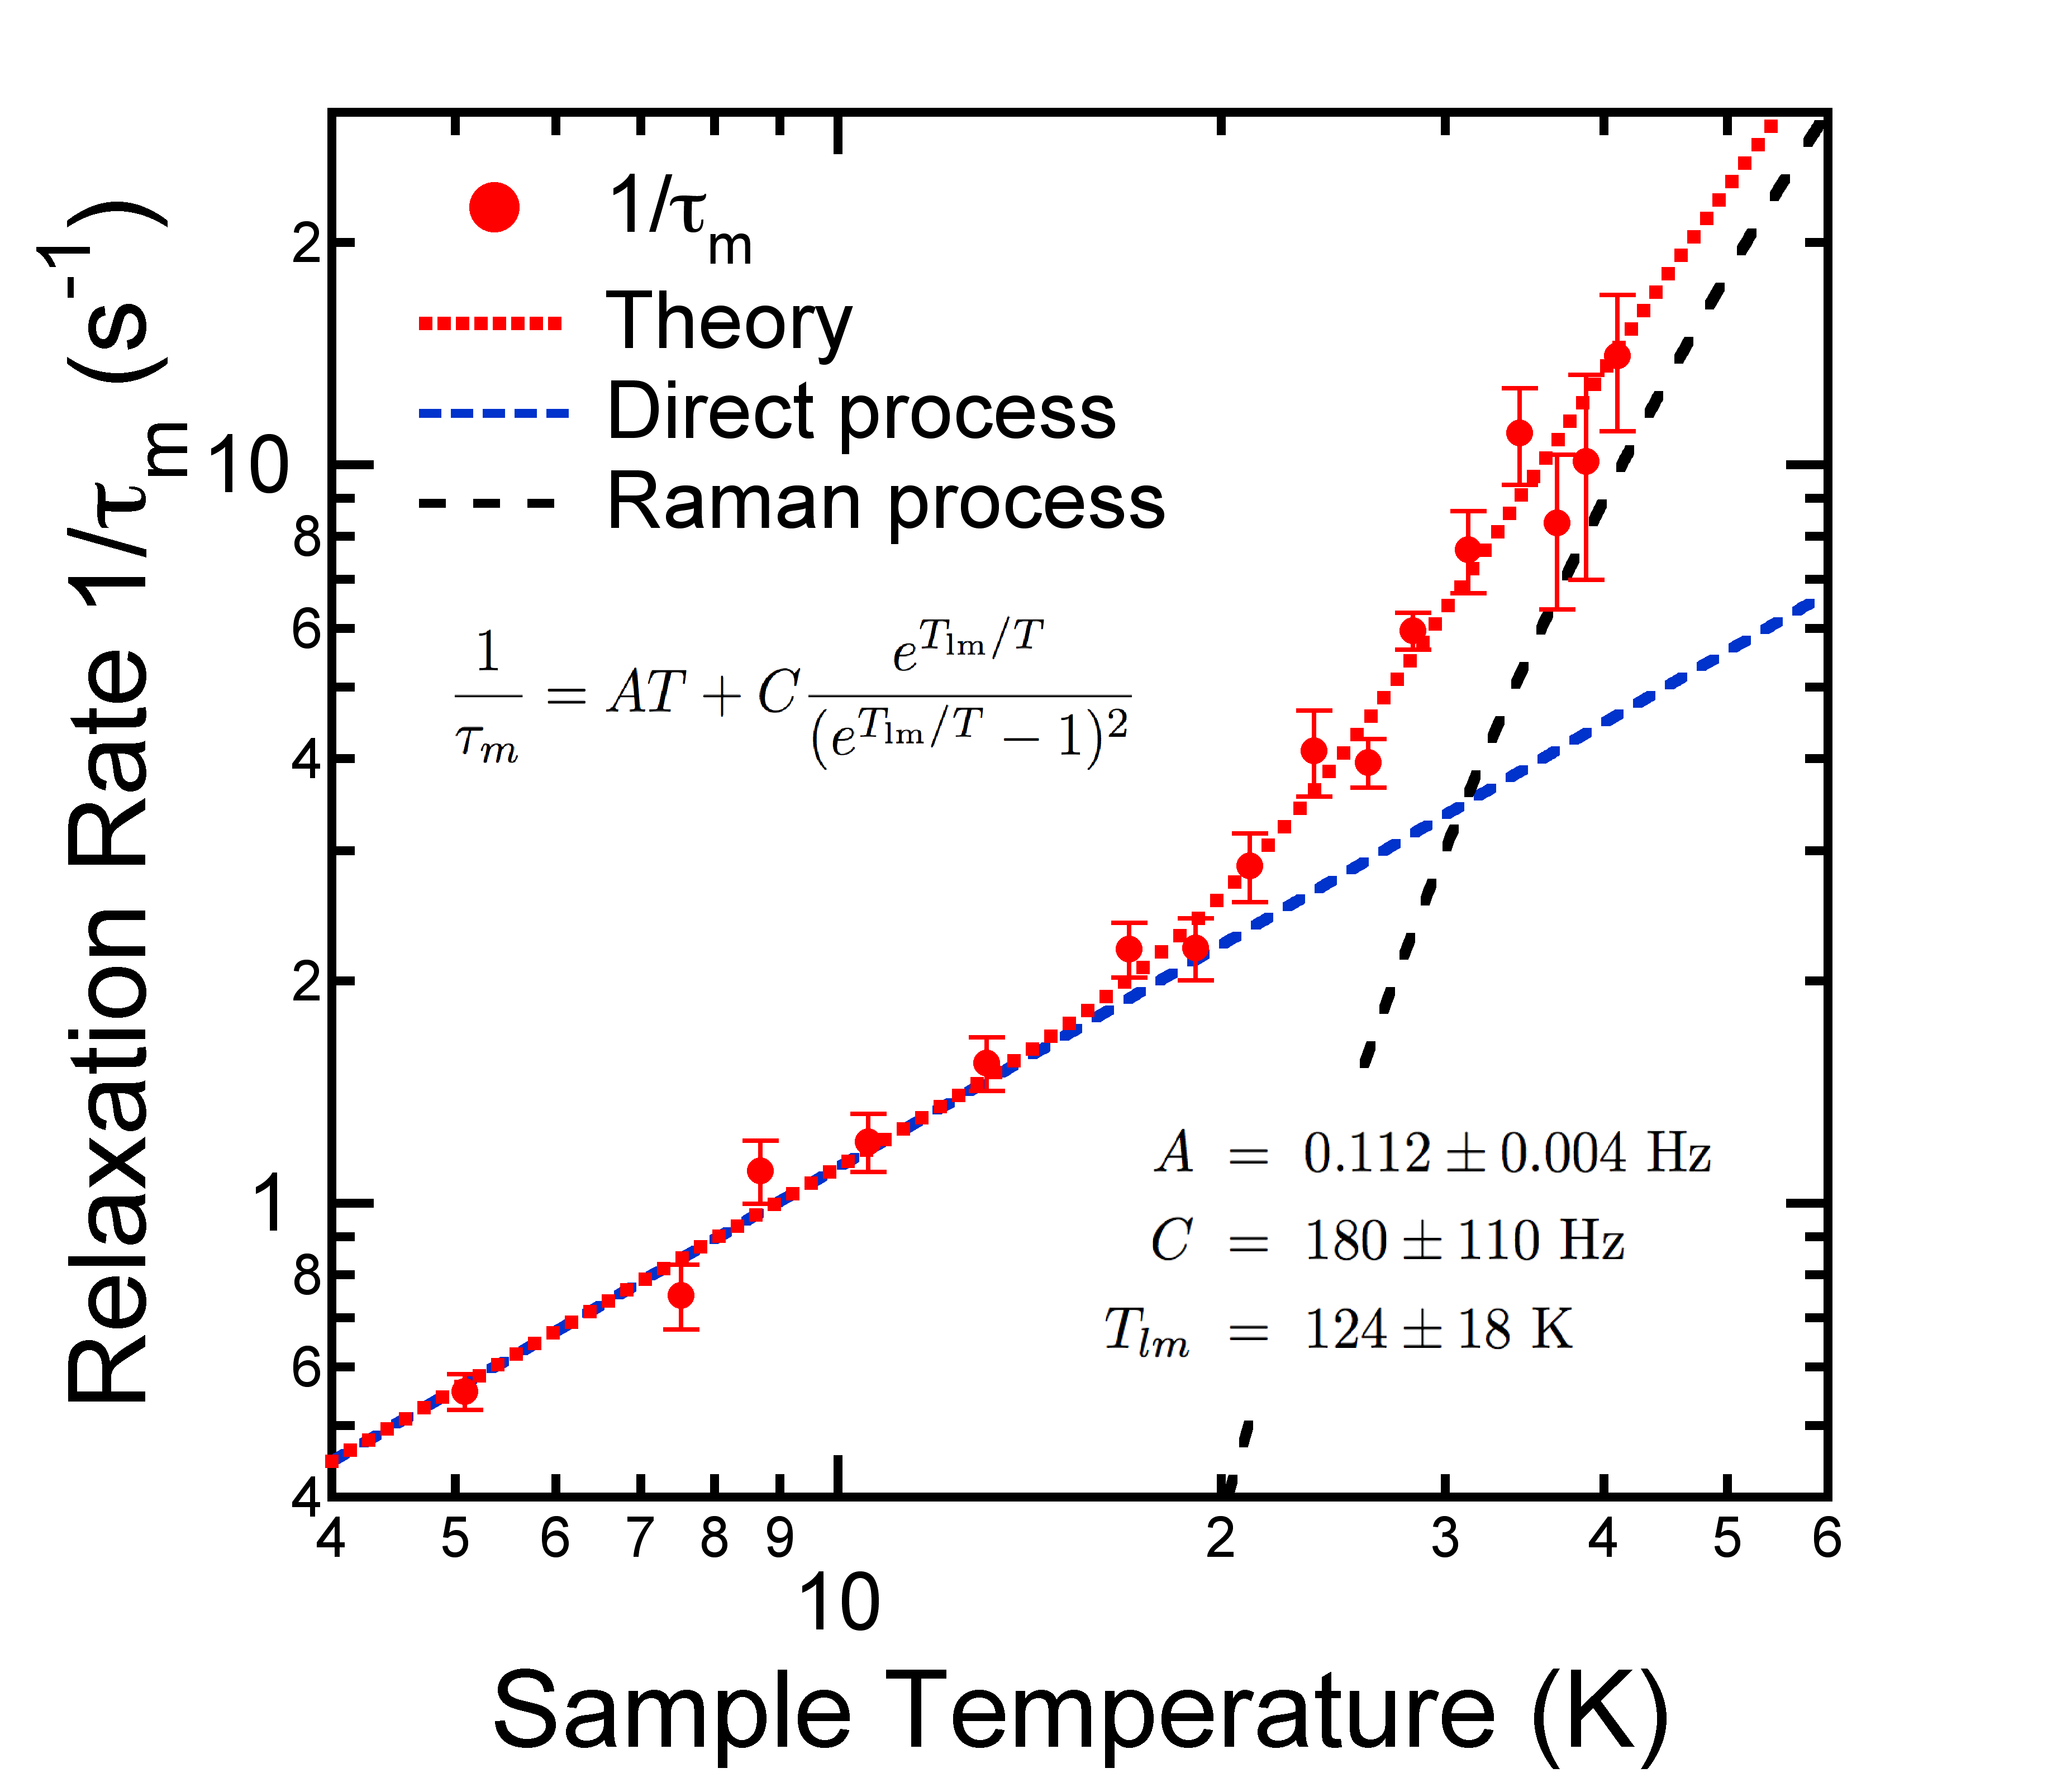
To understand the relaxation mechanism, we measured the temperature dependence of . These measurements are presented in Fig. 4. To avoid spurious reduction of and thus ensure that represents , and were kept at 85 nm and 2.51 mW respectively. The cantilever was thermally isolated from the sample and there was no observable increase in the thermal force noise with change in sample temperature. The data are well described by the function
| (2) |
where , and are fitting parameters. For K, direct phonon absorption or emission dominates , and the linear temperature dependence reflects the phonon mode occupancy for , where is the microwave angular frequency, and are the Planck and Boltzmann constants respectively. For 16 K, the data for are well fit by the expression Castle:silica.jap1965 ; Castle:PhysRev1965 , the signature of two-phonon Raman process, in which phonons with frequency are created and annihilated. Unlike the usual Raman process in which all available phonon modes below the Debye frequency can induce electron spin relaxation, this mechanism involves thermal excitations of the local mode of the oxygen vacancy defect only. Silica with defects induced by neutron-irradiation Shamfarov:NeutronIrradiatedQuartz ; Shamfarov:37GHzQuartzData and hydrogen impurities Castle:HydrogenImpurity ; Murphy:LocalVibrationRelaxation behave similarly. Acoustic attenuation Strakna:NeutronIrradiatedElasticModuli ; Strakna:UltrasoundRelaxation , infrared and Raman studies also support the local mode model.
Since the local mode frequencies are expected to depend on the specific type of quartz, the agreement between fitted K and reported values Castle:EprimePhysRev1963 ; Castle:silica.jap1965 ; Castle:PhysRev1965 is satisfactory. However, the fitted value Hz is roughly 20 times larger than that reported in Ref. Castle:silica.jap1965, . The direct process depends on the Zeeman splitting, so the discrepancy may arise from the different microwave frequencies used. We also find the scaling of deviates from the expected behavior; we note similar behavior has been reported Shamfarov:37GHzQuartzData ; Aminov:DirectProcessFrequencyDependence and suggested to result from a cross relaxation process.
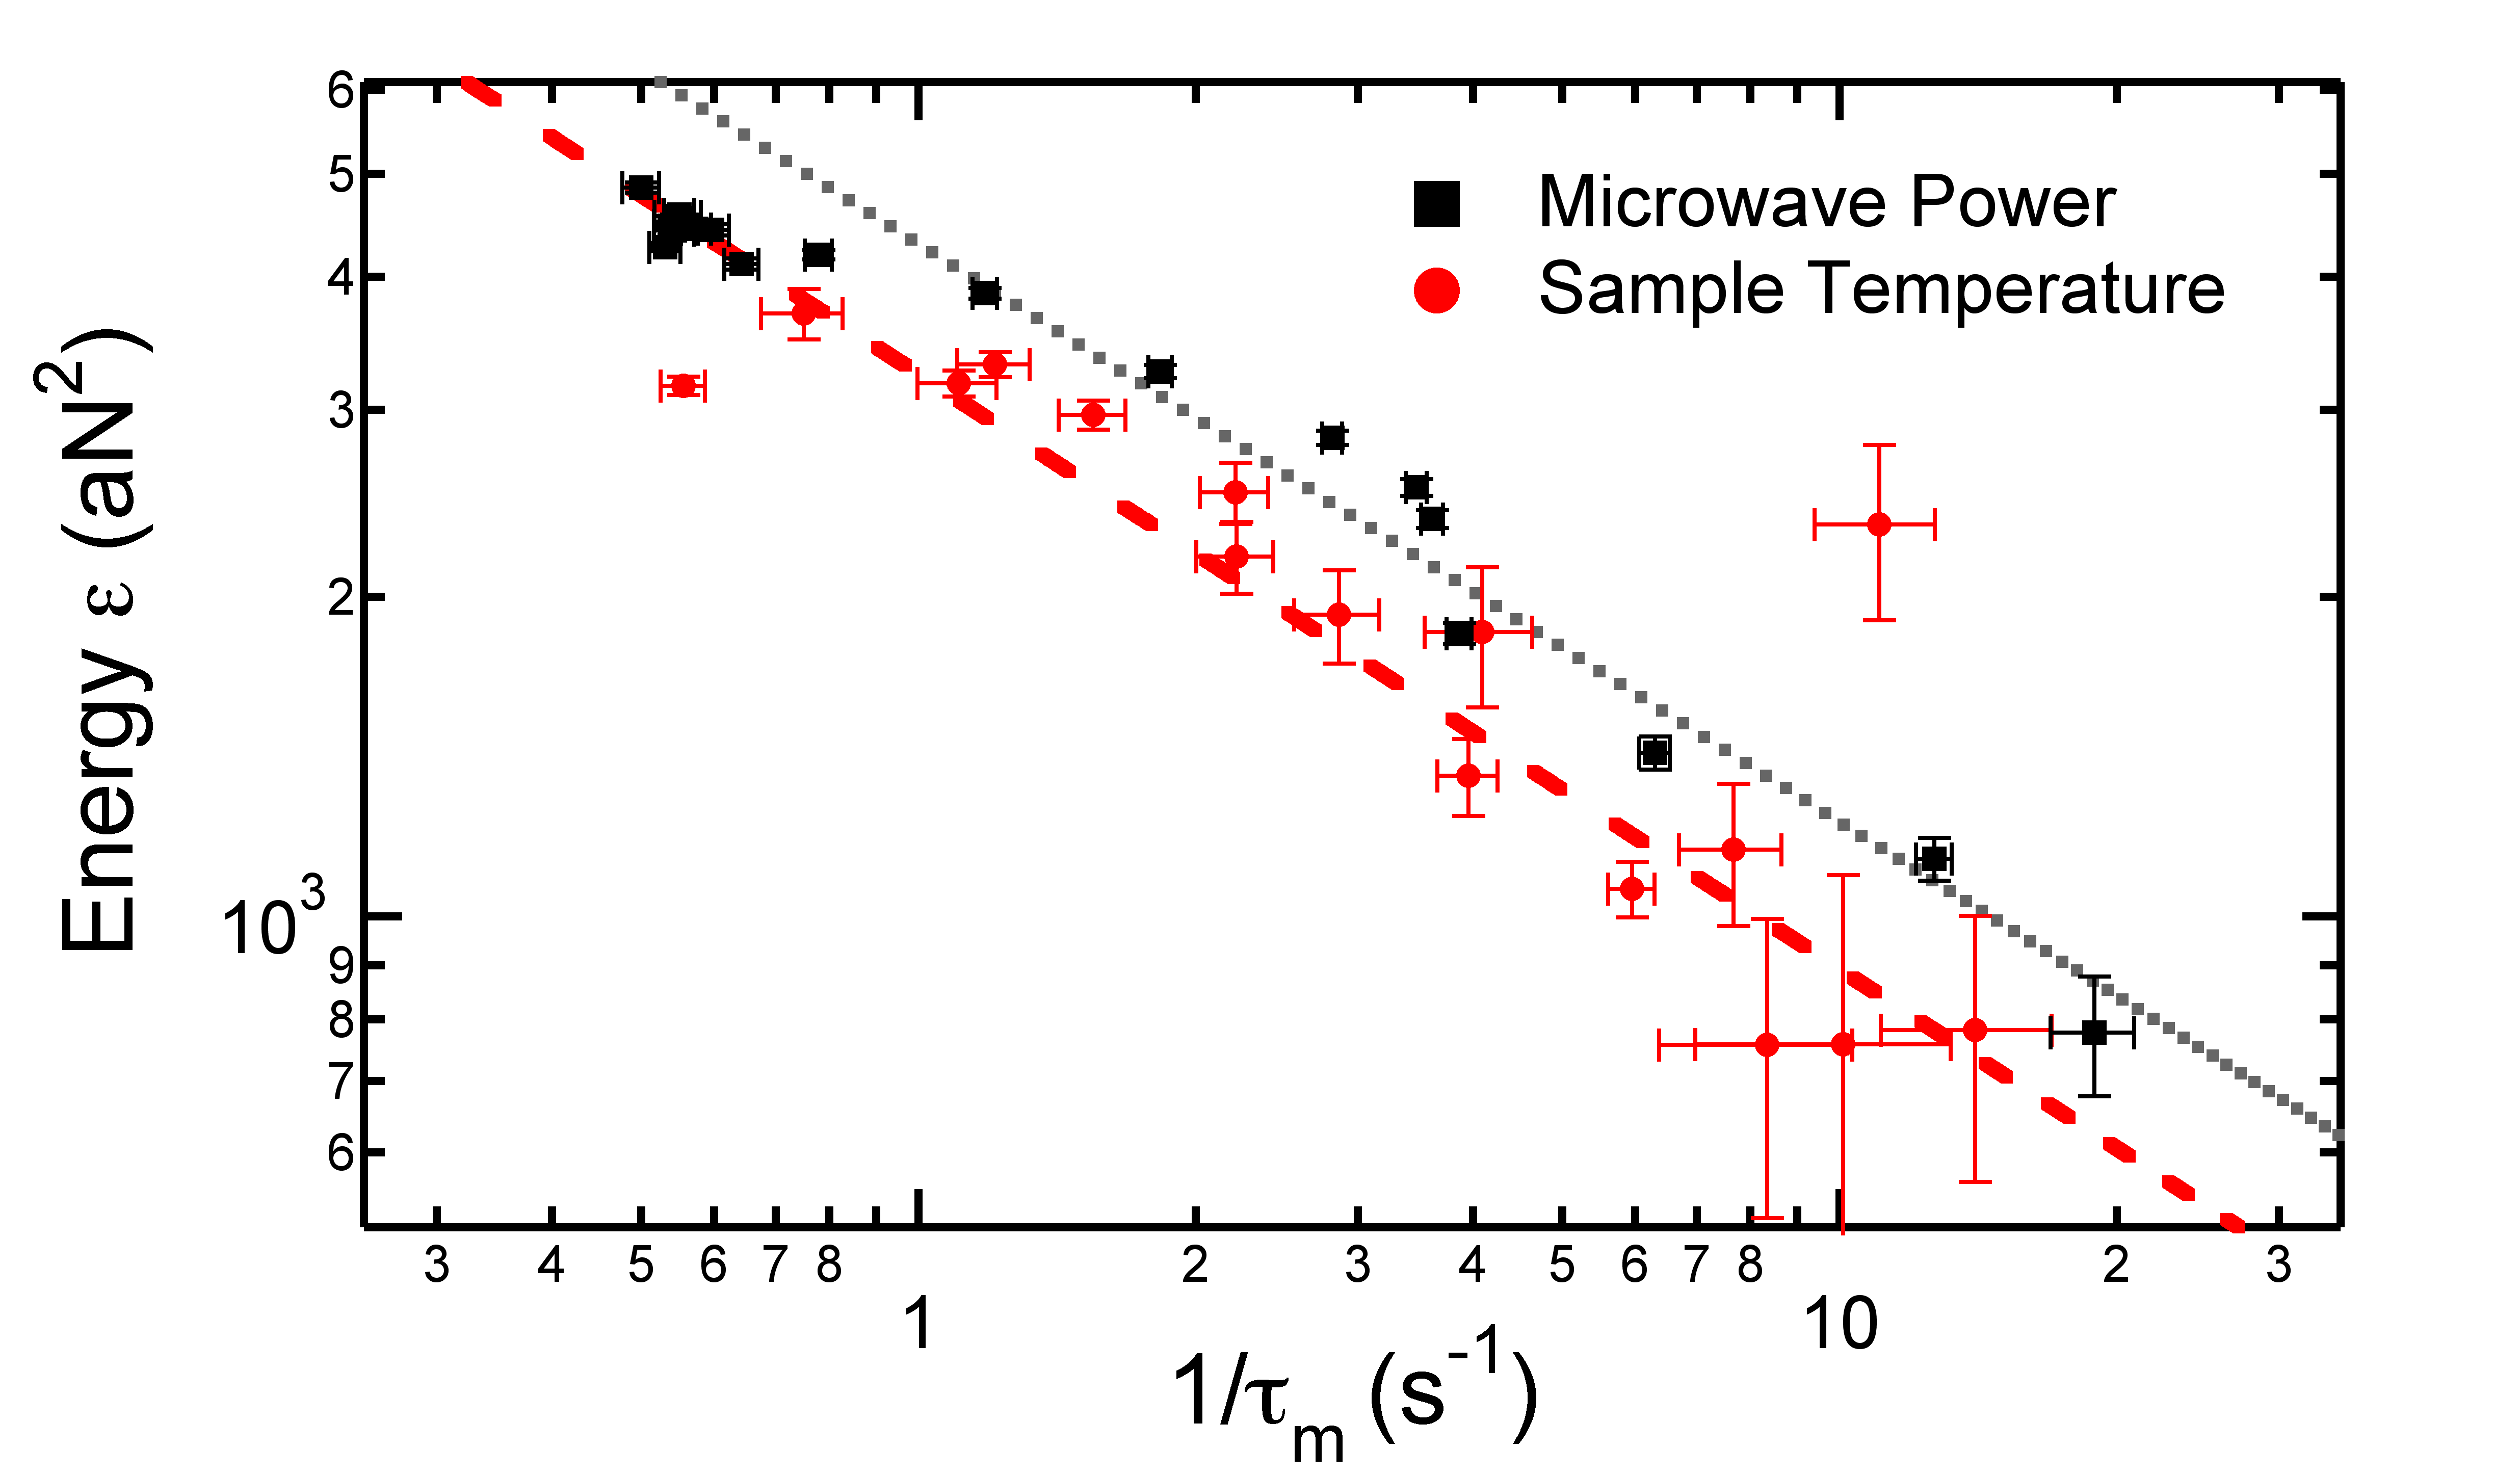
Fig. 5 shows a remarkable anticorrelation between and . When is caused to vary through its dependence on either or temperature, we find varies linearly with with . A similar dependence can be found in Ref. r:MaminStatisticalNMR, . We expect to decrease for due to decreased sensitivity to variations of the spin magnetization occurring within a single modulation period WindowingFunction . This cannot explain the observed variation of well below (45.1 and 21.5 Hz for the and temperature scans, respectively); the power is also not consistent with this origin. Same set of filters were used in the cantilever measurement and control circuits in these data.
We have demonstrated the ability to measure local spin relaxation times using ultrasensitive MRFM. This points to the capability for microscopic measurement of the spatial variation of spin dynamics. This can provide new insight into materials such as superconducting cuprates where intrinsic inhomogeneity plays a central role Kivelson:StripesRMP2003 , and could provide essential understanding in technologically important phenomena such as spin coherence, spin transport and quantum information processing. Furthermore intrinsic correlation times can provide a mechanism for enhancing information content of images through relaxation rate contrast in analogy to - and -weighted Magnetic Resonance Imaging Haacke:MRI . We find, importantly, that care must be taken to understand and account for the influence of size sample size on the measured spin dynamics.
Understanding and manipulating also has implications for MRFM sensitivity. Spin noise detection SNR depends on r:NoiseNMRprl2007 because of the trade off between the averaging counts and lock-in detection bandwidth. Ref. r:NoiseNMRprl2007, uses rf pulses to randomize the spins and hence reduce to the optimal point for maximum SNR. As a consequence of the strong field gradient this required very broadband rf field which was achieved through trains of rf pulses. Our result suggest the optimal can be achieved by controlling the sample temperature.
We have studied the dependence of spin relaxation in few-electron-spin ensembles on and microwave power to understand the effect of time spent near resonance amplitude respectively. We have measured the intrinsic correlation time of the spin noise using the statistical polarization signal in ensembles of electron spins in vitreous silica. Relaxation is due to coupling of spins to phonons through either a direct (single phonon) process at low temperature or a Raman process at higher temperatures. This demonstrates the capability for microscopic measurement of electron spin dynamics, an important quantity for understanding fundamental characteristics of electronic systems. Furthermore, understanding and controlling will be important for future MRFM imaging applications and sensitivity optimization.
The authors would like to thank D. Rugar and J. Mamin for providing us the sample, niobium films and lock-in software. This work was supported by the Army Research Office through MURI grant W911NF-05-1-0414.
References
- (1) J. A. Sidles et al., Reviews of Modern Physics 67, 249 (1995).
- (2) P. C. Hammel and D. V. Pelekhov, in Handbook of Magnetism and Advanced Magnetic Materials, edited by H. Kronmüller and S. Parkin (John Wiley & Sons, Ltd., New York, NY, 2007), Vol. 5, Chap. 4.
- (3) D. Rugar, R. Budakian, H. J. Mamin, and B. W. Chui, Nature 430, 329 (2004).
- (4) H. J. Mamin, R. Budakian, B. W. Chui, and D. Rugar, Physical Review Letters 91, 207604 (2003).
- (5) C. L. Degen, M. Poggio, H. J. Mamin, and D. Rugar, Physical Review Letters 99, 250601 (2007).
- (6) S. Crooker, D. Rickel, A. Balatsky, and D. Smith, Nature 431, 49 (2004).
- (7) C. P. Slichter, Principles of Magnetic Resonance (Springer-Verlag, New York, 1989).
- (8) E. Haacke, R. Brown, M. Thompson, and R. Venkatesan, in Magnetic resonance imaging: physical principles and sequence design (Wiley-Liss, New York, 1999).
- (9) D. Mozyrsky, I. Martin, D. Pelekhov, and P. C. Hammel, Appl. Phys. Lett. 82, 1278 (2003).
- (10) C. L. Degen, M. Poggio, H. J. Mamin, and D. Rugar, Physical Review Letters 100, 137601 (2008).
- (11) B. C. Stipe et al., Phys. Rev. Lett. 87, 277602 (2001).
- (12) K. Wago, D. Botkin, C. S. Yannoni, and D. Rugar, Phys. Rev. B 57, 1108 (1998).
- (13) H. J. Mamin, R. Budakian, B. W. Chui, and D. Rugar, Physical Review B (Condensed Matter and Materials Physics) 72, 024413 (2005).
- (14) J. D. Hannay, R. W. Chantrell, and D. Rugar, J. Appl. Phys. 87, 6827 (2000).
- (15) B. W. Chui et al., in Transducers ’03. 12th International Conference on Solid-State Sensors, Actuators and Microsystems. Digest of Technical Papers (IEEE Piscataway, NJ, USA, 2003), Vol. 2, pp. 1120–1123.
- (16) K. C. Fong, Ph.D. thesis, The Ohio State University, 2008.
- (17) J. G. Castle, D. W. Feldman, P. G. Klemens, and R. A. Weeks, Phys. Rev. 130, 577 (1963).
- (18) J. G. Castle and D. W. Feldman, Journal of Applied Physics 36, 124 (1965).
- (19) J. G. Castle and D. W. Feldman, Phys. Rev. 137, A671 (1965).
- (20) F. J. Feigl, W. B. Fowler, and K. L. Yip, Solid State Commun. 14, 225 (1974).
- (21) J. A. Weil, Phys. Chem. Miner. 10, 149 (1984).
- (22) H. J. Mamin, R. Budakian, and D. Rugar, Rev. Sci. Inst. 74, 2749 (2003).
- (23) W. B. Davenport, W. L. Root, and I. C. Society., An introduction to the theory of random signals and noise (IEEE Press, New York, 1987).
- (24) G. P. Berman, D. I. Kamenev, and V. I. Tsifrinovich, Phys. Rev. A 66, 023405 (2002).
- (25) D. C. Ailion, in Advances in Magnetic Resonance (Academic, New York, 1971), Vol. 5, p. 177.
- (26) J. F. Jacquino and M. Goldman, Physical Review B 8, 1944 (1973).
- (27) J. Baum, R. Tycko, and A. Pines, Phys. Rev. A 32, 3435 (1985).
- (28) Y. L. Shamfaro and T. Smirnova, Sov. Phys. Solid State 5, 761 (1963).
- (29) Y. L. Shamfaro, Sov. Phys. Solid State 8, 2083 (1967).
- (30) D. W. Feldman, J. G. Castle, and G. R. Wagner, Phys. Rev. 145, 237 (1966).
- (31) J. Murphy, Phys. Rev. 145, 241 (1966).
- (32) R. Strakna, A. Clark, D. Bradley, and W. Slie, Journal of Applied Physics 34, 1439 (1963).
- (33) R. Strakna and H. Savage, Journal of Applied Physics 35, 1445 (1964).
- (34) L. K. Aminov, I. N. Kurkin, D. A. Lukoyanov, and K. P. Chernov, Phys. Solid State 39, 1184 (1997).
- (35) The lock-in detector boxcar averages the statistical polarization in a window long, so the suppression of signal is given by . For , the attenuation is less than 15%.
- (36) S. Kivelson et al., Reviews Of Modern Physics 75, 1201 (2003).