75282
V. A. R. M. Ribeiro
The multifrequency behaviour of the
recurrent nova RS Ophiuchi
Abstract
This review concentrates on the multifrequency behaviour of RS Ophiuchi and in particular during its latest outburst. Confirmation of the 1945 outburst, bipolar outflows and its possible fate as a Type Ia Supernova are discussed.
keywords:
binaries: symbiotic – circumstellar matter – line: profiles – novae, cataclysmic variables – stars: individual (RS Ophiuchi)1 Introduction
11footnotetext: SA SKA FellowRS Ophiuchi is a symbiotic recurrent nova (RN) with outbursts recorded in 1898, 1933, 1958, 1967, 1985 (Rosino, 1987; Rosino & Iijima, 1987), and its latest on 2006 February 12.83–12.94 (Figure 1; Narumi et al., 2006; Evans et al., 2008; Hounsell et al., 2010). However, during the period 1898–1933, before the star was known to be a RN, some outbursts might have occurred, most likely in 1907 (Schaefer, 2004) and the suggested 1945 outburst (Oppenheimer & Mattei, 1993) was confirmed by Adamakis et al. (2011, see later).
The system, at a distance of 1.60.3 kph (Bode, 1987; Barry et al., 2008), comprises a massive white dwarf (WD) primary, probably close to the Chandrasekhar limit (e.g., Brandi et al., 2009), and red-giant secondary of spectral type estimated around M0/2III (e.g., Anupama & Mikołajewska, 1999). Accretion of hydrogen-rich material from the red-giant onto the WD surface leads to a thermonuclear runaway (TNR), as in the outbursts of classical novae (CNe). The much shorter inter-outburst period for RNe compared to CNe is predicted to be due to a combination of high WD mass and a high accretion rate (e.g., Starrfield et al., 1985; Yaron et al., 2005). This paper reviews some of the results that have come from the study of RS Oph at a variety of wavelengths and in particular during its latest outburst.

2 Multifrequency behaviour
2.1 Radio
Radio observations in 2006 around day 13.8 after outburst with Very Long Baseline Interferometry (VLBI) showed a partial ring of non-thermal emission (from the expanding shock) which later developed in to a bipolar structure (O’Brien et al., 2006, 2008). The asymmetry was suggested to be due to absorption in the overlying red-giant wind and they noted more extended components emerging to the east and west.
The remnant was followed between days 34 – 51 after outburst with the Very Long Baseline Array (VLBA) by Sokoloski et al. (2008) who found a central thermally dominated source linked by what appeared to be collimated non-thermal outflow which were interpreted as the working surfaces of jets. Jet collimation could for example be due to the expected accretion disc around the WD. It should be noted that Taylor et al. (1989) had also interpreted their 5 GHz VLBI map from day 77 after the 1985 outburst in terms of a central thermal source with expanding non-thermal lobes.
2.2 Optical
The optical regime is perhaps one that has the greatest wealth of information published, mainly due to the accessibility to telescopes/instruments. It is at this wavelength that the nova in outburst is first detected, leading to triggers in other wavelengths. The outbursts of novae are generally caught near maximum or while it is on the decline. By combining all-sky surveys, similar to the Solar Mass Ejection Imager (SMEI), we can sample well the pre-maximum and early decline light curves of the outburst and here find interesting features (see Figures 1 and 2). For example, Hounsell et al. (2010) were able to observe the pre-maximum halt, at around day 0.5, which lasted for a few hours. They go further to suggest that the halt may be a temporary reversal in the light curve and may be related to a change in the mass loss rate, although its cause is poorly determined.

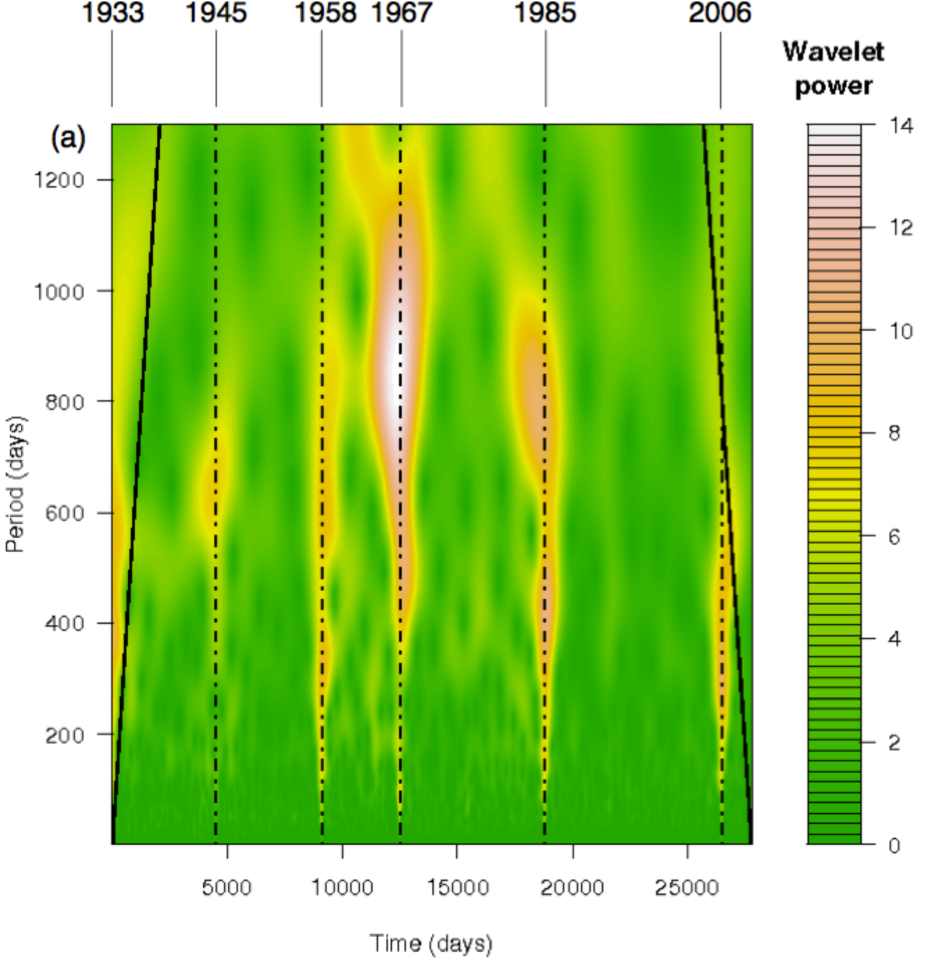
Adamakis et al. (2011) examined the optical light curve between 1933 and 2007 obtained from the AAVSO database, which covered 6 outbursts (previously to publishing their results only 5 outburst were confirmed and one was suspected). By means of wavelet analysis they were able to confirm the suspected 1945 outburst and went further to suggest the existence of a pre-outburst signal starting up to a couple hundred days before the TNR (Figure 3).
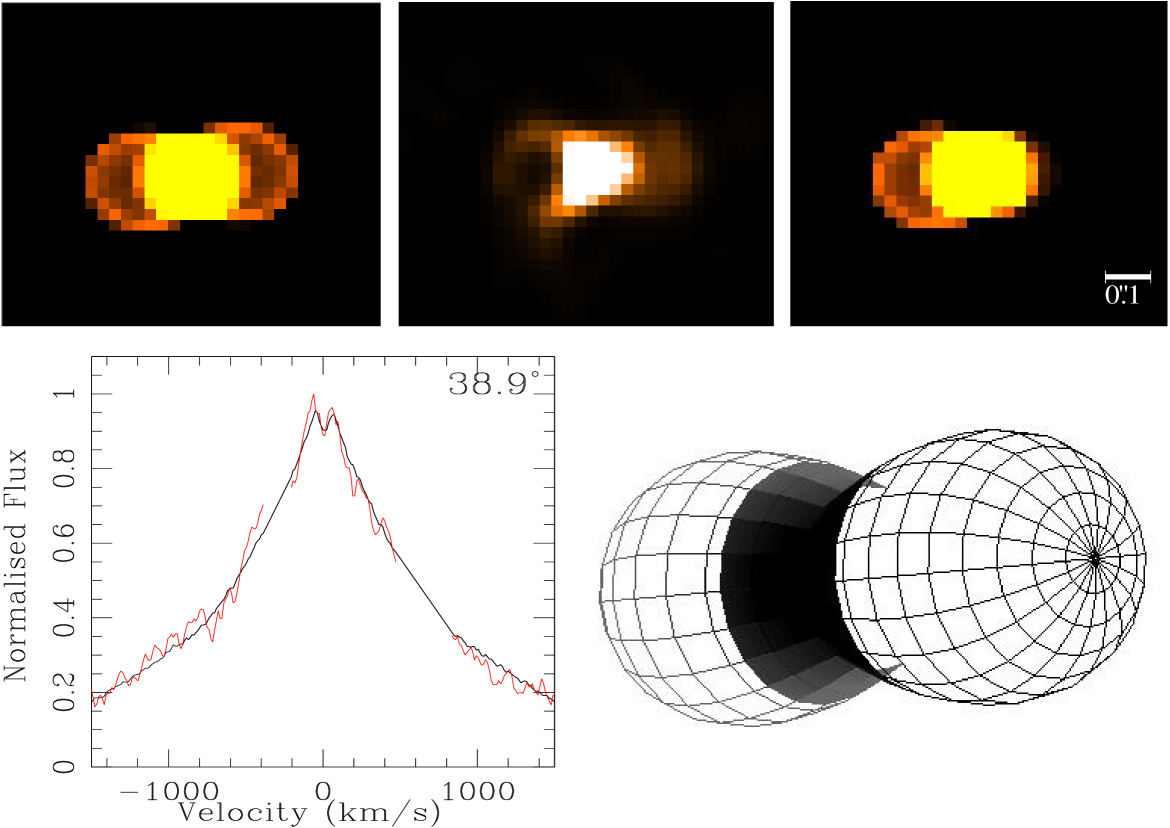
Hubble Space Telescope (HST) imaging and ground-based spectroscopic observations at 155 days after outburst allowed Ribeiro et al. (2009) to model the ejecta as bipolar, at least in the ACS/HRC F502N HST filter, composed of an outer dumbbell and inner hour glass structures (Figure 4). The inner hour glass was required as an over-density in order to replicate the observed [O iii] 5007Å line profile. We were able to show that the observed apparent asymmetry of the ejecta in the HST image was an observational effect due to the finite width and offset of the central wavelength from the line centre of the F502N filter. From detailed kinematical modelling, the inclination of the system was determined as 39 degrees and maximum expansion velocity 5100 km s-1 (the range in velocity arises from the 1 errors on the inclination – see Figure 4). This asymmetry was proposed to be due to interaction of the ejecta with a pre-existing red-giant wind (Bode et al., 2007; Ribeiro et al., 2009).
The model was then evolved to 449 days after outburst, to match the second HST observations. However, in this case, due to the lack of simultaneous ground-based spectroscopy the model was harder to constrain. Ribeiro et al. (2009) suggested that at this time the outer dumbbell structure expanded linearly while the inner hour glass structure showed some evidence for deceleration. However, the results are open to over-interpretation due to the poor quality of the images at this epoch.
Patat et al. (2011) using multi-epoch, high-resolution spectroscopy before, during and after the outburst studied the time evolution of Ca ii, Na i and K i absorption features and related these to density enhancements in the circumstellar material. They proposed a link between RS Oph and the Type Ia SN 2006X as a result (Patat et al., 2007).
2.3 X-ray
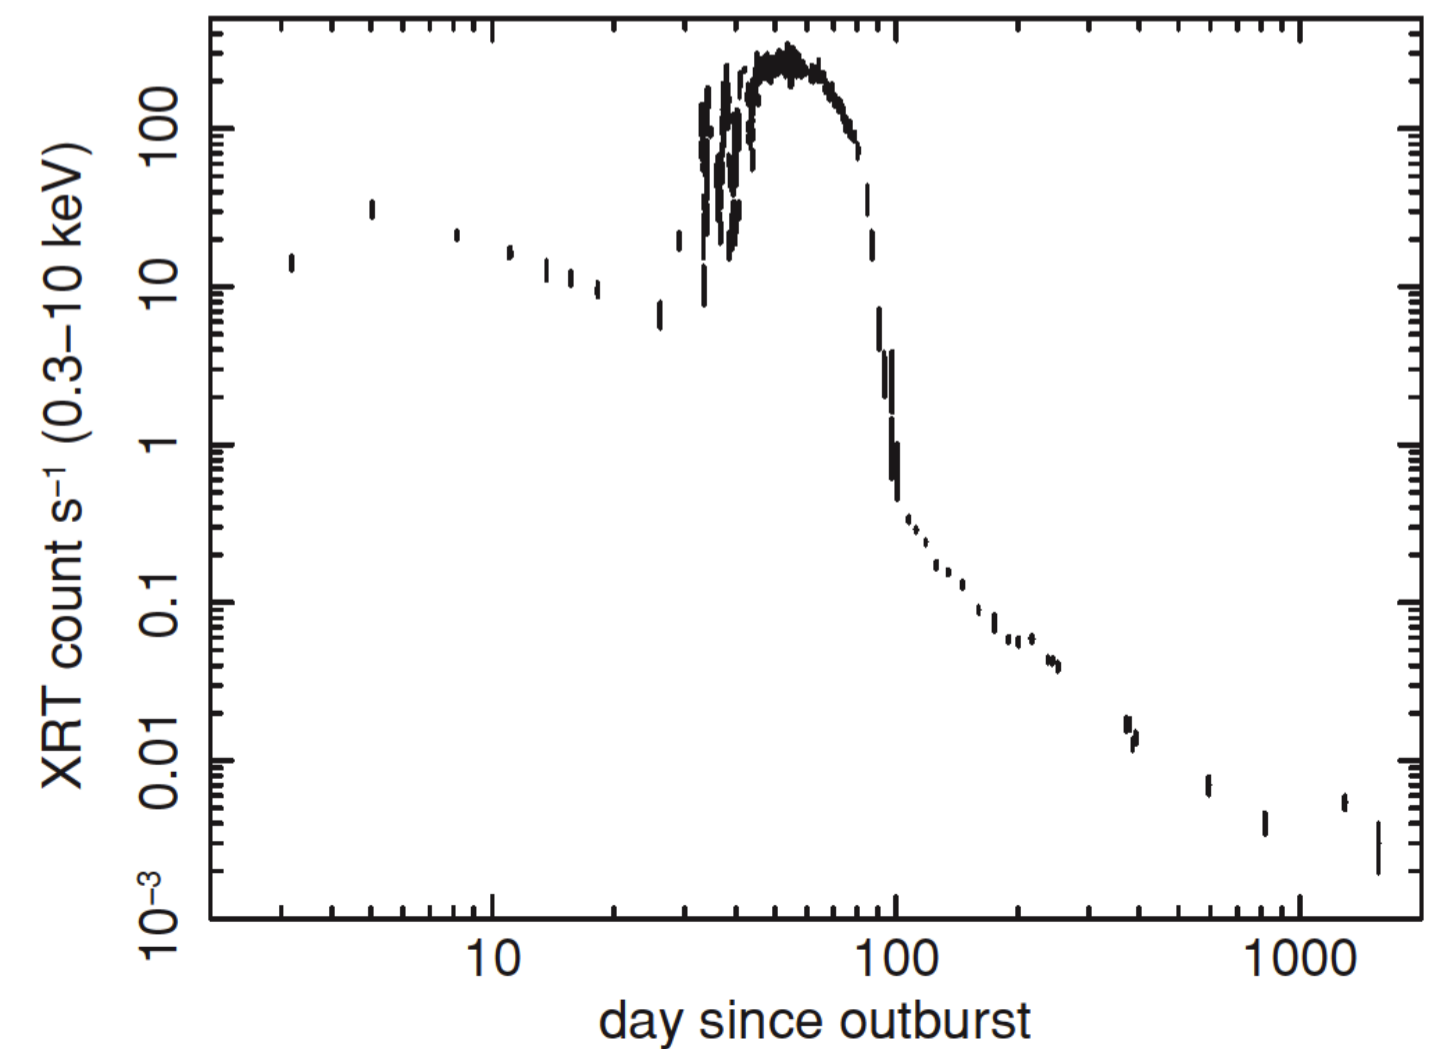
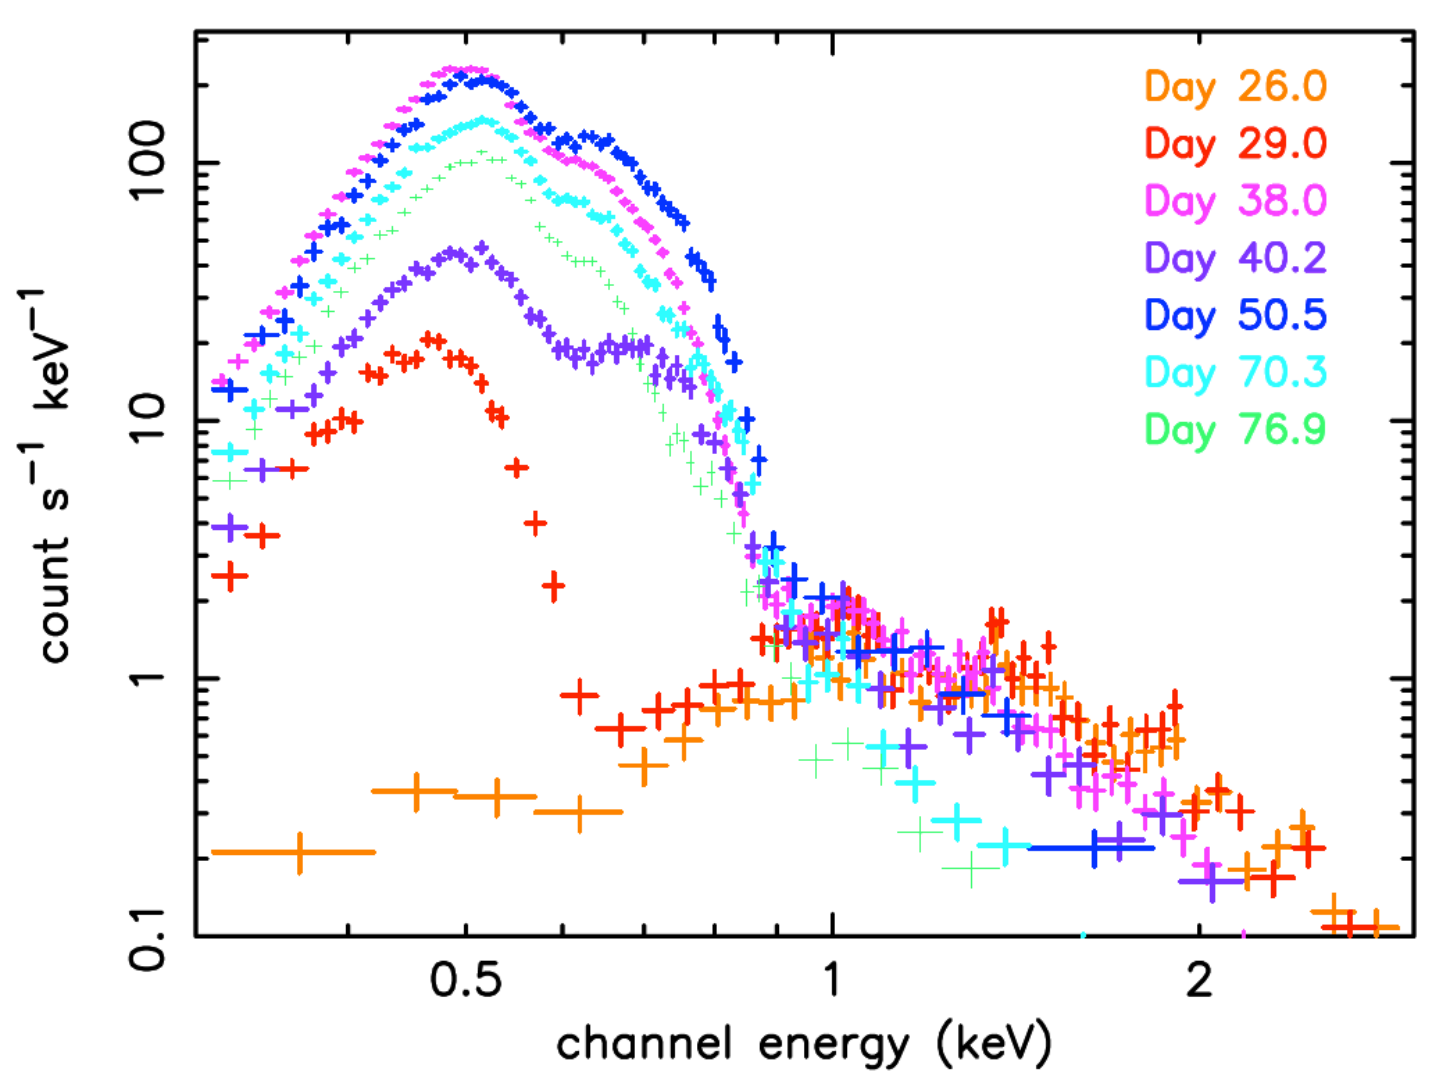
The initial decline, observed in Figure 5 (top), of the Swift X-ray count rates up to day 26 is well described by the evolution of shock systems as the outburst ejecta run into the pre-existing red-giant wind (Bode et al., 2006; Sokoloski et al., 2006).The super-soft source then emerges by day 29 (Figure 5, bottom), which samples nuclear burning on the WD surface, evident until about day 90 (Osborne et al., 2011).
The outburst was also followed in detail with X-ray grating observations with Chandra and XXM-Newton where two distinct temperature components were found which decayed with time (Ness et al., 2009). The reduction in flux of these two components, hot and cooler, are consistent with radiative cooling and the expansion of the ejecta, respectively (Ness et al., 2009). Chandra observations showed a wide temperature range indicative of shock heating of the circumstellar medium by the expanding shock wave (Drake et al., 2009).
Hachisu et al. (2007) used Swift observations of the super-soft source to derive a mass of the WD as 1.35 0.01 M⊙ and suggested that the mass of the WD is increasing at a rate of (0.51) 10-7 M⊙ yr-1.
3 Final Thoughts
Research on RS Oph is still ongoing and many questions remain unanswered. These include, for example:
-
•
What happens to the ejecta as it progresses from the first HST epoch to the second? Is there a deceleration of the inner component while the outer moves freely? Or is there something else going on? What will this tell us about remnant shaping? This is possible to answer if spectra were available around the same time as the second HST epoch and applying the model from the first epoch. We can accept that the outer component arises from the expanding ejecta, but what about the inner one? Is it some post-outburst wind?
-
•
What is the nature of the supposed pre-outburst signal? This of course poses serious issues as in the TNR model the outburst is effectively instantaneous. So is there another mechanism at play before the TNR outburst for example, some increase in mass accretion rate before the outburst (e.g., King & Pringle, 2009)? Perhaps this could be resolved if RS Oph is observed to undergo dwarf novae outbursts during quiescence.
-
•
What is the underlying composition of the WD? This is fundamental for our understanding of any hints to the progenitors of Type Ia SN. The short recurrence timescale and the duration of the super-soft source suggests a high mass WD. From stellar evolution, generally, a 1.1 M⊙ WD is ONe, as opposed to CO, which will not explode as a Type Ia SN. U Sco, another RN with a similarly high mass WD, was strongly suggested to comprise an ONe WD (Mason, 2011). This point requires special attention in order to fully understand the role of RNe as progenitors of Type Ia SNe.
Acknowledgements.
The author would like to thank Rebekah Hounsell and Stewart Eyres for providing the data for the SMEI light curve and modified version of Figure 3, and Michael Bode for comments on a first draft. The author would also like to thank financial support from the Royal Astronomical Society and the SA SKA Office.References
- Adamakis et al. (2011) Adamakis, S. et al. 2011, MNRAS, 414, 2195
- Anupama & Mikołajewska (1999) Anupama, G. C., & Mikołajewska, J. 1999, A&A, 344, 177
- Barry et al. (2008) Barry, R. K. et al. 2008, in ASP Conf. Ser., 401, RS Ophiuchi (2006) and the Recurrent Nova Phenomenon, eds. A. Evans et al. (San Francisco, CA: ASP), 52
- Bode (1987) Bode, M. F. 1987, RS Ophiuchi (1985) and the Recurrent Nova Phenomenon, ed. M. F. Bode (Utrecht: VNU Science Press), 241
- Bode et al. (2006) Bode, M. F., et al. 2006, ApJ, 652, 629
- Bode et al. (2007) Bode, M. F., et al. 2007, ApJ, 665, L63
- Brandi et al. (2009) Brandi, E., et al. 2009, A&A, 497, 815
- Darnley et al. (2008) Darnley, M. J., Hounsell, R. A., & Bode, M. F. 2008, in ASP Conf. Ser., 401, RS Ophiuchi (2006) and the Recurrent Nova Phenomenon, eds. A. Evans et al. (San Francisco, CA: ASP), 203
- Drake et al. (2009) Drake, J. J., et al. 2009, ApJ, 691, 418
- Evans et al. (2008) Evans, A., et al. (eds.) 2008, in ASP Conf. Ser., 401, RS Ophiuchi (2006) and the Recurrent Nova Phenomenon (San Francisco, CA: ASP)
- Hachisu et al. (2007) Hachisu, I., Kato, M., & Luna, G. J. M. 2007, ApJ, 659, L153
- Hounsell et al. (2010) Hounsell, R. et al. 2010, ApJ, 724, 480
- King & Pringle (2009) King, A. R., & Pringle, J. E. 2009, MNRAS, 397, L51
- Mason (2011) Mason, E. 2011, A&A, 532, L11
- Narumi et al. (2006) Narumi, H., et al. 2006, IAU Circ., 8671, 2
- Ness et al. (2009) Ness, J.-U., et al. 2009, AJ, 137, 3414
- O’Brien et al. (2006) O’Brien, T. J., et al. 2006, Nature, 442, 279
- O’Brien et al. (2008) O’Brien, T. J., et al. 2008, in ASP Conf. Ser., 401, RS Ophiuchi (2006) and the Recurrent Nova Phenomenon, eds. A. Evans et al. (San Francisco, CA: ASP), 239
- Oppenheimer & Mattei (1993) Oppenheimer, B. D., & Mattei, J. A. 1993, Journal of the American Association of Variable Star Observers (JAAVSO), 22, 105
- Osborne et al. (2011) Osborne, J. P., et al. 2011, ApJ, 727, 124
- Patat et al. (2007) Patat, F., et al. 2007, Science, 317, 924
- Patat et al. (2011) Patat, F., et al. 2011, A&A, 530, A63
- Ribeiro et al. (2009) Ribeiro, V. A. R. M., et al. 2009, ApJ, 703, 1955
- Ribeiro et al. (2011) Ribeiro, V. A. R. M., et al. 2011, Asymmetric Planetary Nebulae 5 Conference, ed. A. A. Zijlstra et al. (Jodrell Bank Centre for Astrophysics), 314
- Rosino (1987) Rosino, L. 1987, RS Ophiuchi (1985) and the Recurrent Nova Phenomenon, ed. M. F. Bode (Utrecht: VNU Science Press), 1
- Rosino & Iijima (1987) Rosino, L., & Iijima, T. 1987, RS Ophiuchi (1985) and the Recurrent Nova Phenomenon, ed. M. F. Bode (Utrecht: VNU Science Press), 27
- Schaefer (2004) Schaefer, B. E. 2004, IAU Circ., 8396, 2
- Sokoloski et al. (2006) Sokoloski, J. L., et al. 2006, Nature, 442, 276
- Sokoloski et al. (2008) Sokoloski, J. L., Rupen, M. P., & Mioduszewski, A. J. 2008, ApJ, 685, L137
- Starrfield et al. (1985) Starrfield, S., Sparks, W. M., & Truran, J. W. 1985, ApJ, 291, 136
- Yaron et al. (2005) Yaron, O., et al. 2005, ApJ, 623, 398