NUV Excess in Slowly Accreting T Tauri Stars: Limits Imposed by Chromospheric Emission*11footnotetext: This paper includes data gathered with the 6.5 meter Magellan Telescopes located at Las Campanas Observatory, Chile.
Abstract
Young stars surrounded by disks with very low mass accretion rates are likely in the final stages of inner disk evolution and therefore particularly interesting to study. We present ultraviolet (UV) observations of the 5–9 Myr old stars RECX-1 and RECX-11, obtained with the Cosmic Origins Spectrograph (COS) and Space Telescope Imaging Spectrograph (STIS) on the Hubble Space Telescope (HST), as well as optical and near infrared spectroscopic observations. The two stars have similar levels of near UV emission, although spectroscopic evidence indicates that RECX-11 is accreting and RECX-1 is not. The line profiles of H and He I 10830 in RECX-11 show both broad and narrow redshifted absorption components that vary with time, revealing the complexity of the accretion flows. We show that accretion indicators commonly used to measure mass accretion rates, e.g. band excess luminosity or the Ca II triplet line luminosity are unreliable for low accretors, at least in the middle K spectral range. Using RECX-1 as a template for the intrinsic level of photospheric and chromospheric emission, we determine an upper limit of for RECX-11. At this low accretion rate, recent photoevaporation models predict that an inner hole should have developed in the disk. However, the spectral energy distribution of RECX-11 shows fluxes comparable to the median of Taurus in the near infrared, indicating that substantial dust remains. Fluorescent H2 emission lines formed in the innermost disk are observed in RECX-11, showing that gas is present in the inner disk, along with the dust.
1 Introduction
It is now accepted that classical T Tauri stars (CTTS***In this paper we use the terms classical and weak-line T Tauri stars (CTTS and WTTS) to indicate accreting and non-accreting T Tauri stars, respectively, following White & Basri (2003).) are accreting mass from their disks via magnetospheric accretion. In this process, the stellar magnetic field truncates the circumstellar disk and channels gas near the truncation radius onto the stellar surface, where an accretion shock forms. Gas heated by the shock emits energetic photons which, after re-processing in the accretion streams, irradiate the inner disk with ultraviolet (UV) and X-ray photons (Calvet & Gullbring, 1998; Ardila & Johns-Krull, 2009; Günther et al., 2007). This energetic emission plays a key role in driving disk chemistry and may be the most efficient mechanism for dispersing the disk gas (Najita et al., 2010; Pinte et al., 2010; Bethell & Bergin, 2009; Gorti et al., 2009b). The rate at which material is accreted is an important input in models of circumstellar disks, affecting the surface density and inner disk heating (D’Alessio et al., 2006), so accurate accretion rates are essential for describing the evolution of both gas and dust. Accretion rates decrease with age (Calvet et al., 2005), so objects with very low accretion rates are particularly interesting for studying the final stages in the evolution of disks.
The spectrum produced by the accretion shock on the stellar surface peaks in the UV, so UV flux excesses over the stellar fluxes are the most direct measure of the accretion luminosity () from which the mass accretion rate, , can be derived (§4.2). However, CTTS have active chromospheres which produce UV emission in excess of the main sequence standards (Houdebine et al., 1996; Franchini et al., 1998). The chromospheric contribution to the measured excess is expected to be small when compared to the excess due to accretion in CTTS with typical values of the mass accretion rate, (Gullbring et al., 1998). However, as the disk evolves, the mass accretion rate and accretion luminosity decrease, and so do the accretion-powered UV fluxes. In contrast, indicators of chromospheric activity, e.g. the X-ray luminosity, stay approximately constant in the age range 1 - 10 Myr during which disks evolve significantly (Ingleby et al., 2011). Therefore, the chromospheric contribution is expected to become more important in determining the total UV flux as the disk evolves and at some point will become the dominant contributor. From this point on, the UV excess is no longer measuring accretion.
In most determinations of accretion luminosity in CTTS to date, the excess fluxes in the UV have been measured using main sequence standards as templates for the intrinsic stellar emission. A better template for the stellar emission of an accreting T Tauri star is a non-accreting T Tauri star (or WTTS), which is expected to have a comparable level of chromospheric activity as a CTTS. However, UV observations of WTTS with enough sensitivity do not exist (Valenti et al., 2003), so it has not been possible to determine typical levels of chromospheric emission, which in turn are important to set up realistic limits to the accretion luminosities that can be determined from UV observations. In this paper we address these issues by comparing the UV fluxes of a WTTS, RECX-1, with those of a very low accretor, RECX-11, and find that the NUV fluxes are dominated by chromospheric emission; this allows us to place limits on the lowest accretion luminosites detectable in the UV.
Even for chromospheric-dominated UV fluxes, alternative indicators may be used to identify whether a young star is accreting. A commonly used accretion indicator is the H line profile. H is observed in emission in all T Tauri stars but a large velocity width or line asymmetry indicates accretion, whereas a narrow symmetric line profile is characteristic of a non-accreting star (Muzerolle et al., 2001; Lima et al., 2010; White & Basri, 2003). In addition, redshifted absorption components superimposed on the emission line profiles are direct indication of infalling material and can be explained in terms of magnetospheric accretion (Muzerolle et al., 1998, 2001). The He I line at 10830 Å can also be used to diagnose accretion properties in T Tauri stars. In CTTS this line shows deep blueshifted and redshifted absorption components in its profile, which have been interpreted as formed in outflows and accretion streams (Edwards et al., 2006; Fischer et al., 2008). Other indicators of accretion used in the literature are the forbidden lines of [OI] 6300 and 6363 Å, which are present only in accreting stars (Hartigan et al., 1995), and the Ca II triplet lines, whose luminosites correlate with accretion luminosity (Calvet et al., 2004). In this paper we analyze these accretion indicators in high resolution spectra of RECX-11 and RECX-1. We find conclusive evidence for accretion in RECX-11 and not in RECX-1 in our high resolution observations of H and He I 10830, but not in other lines. Our analysis allows us to assess which accretion indicators are appropriate for detecting accretion at very low levels.
The indicators discussed above are directly tracing material in the accretion shock or flows, but another indirect method of determining whether a source is accreting or not involves gas in the inner circumstellar disk. While in the past circumstellar gas was difficult to observe, new observations have made gas detections possible (Bary et al., 2008; Bitner et al., 2008; Carr & Najita, 2008; Pascucci et al., 2009a). Of particular interest are observations of hot gas very close to the star, near the magnetospheric truncation radius. FUV observations have shown that CO and H2 at temperatures near 2500 K are present in the disk (France et al., 2011, 2010; Herczeg et al., 2004, 2002). Ingleby et al. (2009) analyzed a sample of FUV spectra of T Tauri stars and found that H2 was present in the inner 1 AU of all accreting sources but not in non-accreting sources. FUV gas detections therefore indicate more than the presence of gas, but actually show whether a source is still accreting or not. These results were based on ACS low resolution observations; the COS observations presented in this paper allow us to confirm this finding using spectrally resolved H2 lines.
This paper is organized as follows. In §2 we present the UV, optical and IR data discussed in this paper. In §3 we discuss which commonly used accretion indicators are valid at low levels of accretion and which are unreliable. In §4 we estimate limits for the minimum that can be determined from the UV. Finally, in §5 we discuss the limitations of current accretion rate determinations in view of our results, as well as the implications for disk evolution models.
2 Observations
2.1 The Targets
Our targets are the young stars RECX-1 and RECX-11 in the Chamaeleontis group, the nearest open cluster at only 97 pc with an age of 5-9 Myr (Mamajek et al., 1999, 2000; Luhman & Steeghs, 2004). With , this region has little extinction (Luhman & Steeghs, 2004), making it ideal for UV observations as corrections for reddening may introduce large uncertainties. The sources have similar spectral types, and were classified as K4 by Mamajek et al. (1999) and K5-K6 by Luhman & Steeghs (2004). Sources in this region have also been well characterized in the infrared with broad band photometry (Lyo et al., 2004), Spitzer IRAC and MIPS photometry and Infrared Spectrograph (IRS) spectroscopy (Sicilia-Aguilar et al., 2009). The properties of each source are summarized in Table 1.
2.2 HST Observations
Observations of RECX-1 and RECX-11 were obtained between 2009 December and 2010 January with COS and STIS on HST in GO Program 11616 (PI: Herczeg). STIS NUV observations used the MAMA detector and the G230L grating providing spectral coverage from 1570 to 3180 Å with R500-1000. Optical observations were completed during the same orbit as the NUV using the G430L grating which covers 2900-5700 Å with R530–1040, resulting in almost simultaneous NUV to optical coverage with STIS.
The low-resolution STIS spectra were calibrated with custom written IDL routines following the procedures described in the STIS data handbook. The wavelengths were calibrated from the location of identified emission lines within the spectrum, and fluxes were calibrated from spectra of WD 1337+705 in the NUV and HIP 45880 in the optical. The flux calibration also includes a wavelength-dependent aperture correction.
COS observations of RECX-11 were presented in France et al. (2011), and we discuss them here together with observations for RECX-1. The COS FUV observations were taken with the G160M and G130M gratings and were completed within 3–4 hours of the STIS observations. The combination of the two gratings provides FUV coverage from 1150 – 1775 Å with R16,000 – 18,000. The log of the observations is given in Table 2.
The COS spectra were processed by the standard CALCOS calibration pipeline. The individual spectral segments, after obtaining different wavelength settings to minimize instrumental fixed pattern effects and to provide full wavelength sampling, were combined using the IDL coaddition procedure described by Danforth et al. (2010). This procedure coaligns the individual exposures and performs an exposure-weighted interpolation onto a common wavelength grid.
In our COS NUV acquisition image, we resolved RECX-1 into a binary with a separation of 0141 and a position angle of 21∘ (taking into account the fact that MIRRORB creates spurious images), indicating some relative motion between the April 2004 -band images of Brandeker et al. (2006) and our January 2010 observations. Brandeker et al. (2006) found that the semi-major axis of the orbit was 042. The two stars are also marginally resolved in our STIS spectra, which were obtained with a slit position angle of -49.6∘. Separate spectral extractions for the components were obtained by fitting two Gaussians to the cross-dispersed profile at each wavelength position, subtracting off the emission from one component, and subsequently extracting the counts in the other component. From the blue spectrum, we estimate spectral types of K4 for the S component and K6 for the N component, consistent with the unresolved spectral type of K5–K6 (Luhman & Steeghs, 2004). The near-UV spectra of the two stars are similar, except for a 1.5 times stronger Mg II flux from the S component. For our analysis, we use the combined spectra of the N and S components to increase the signal to noise. With both components having spectral types close to RECX-11 and very similar STIS spectra, little error is introduced by using the combined spectra.
2.3 Ground Based Observations
Both sources were observed using MIKE (Magellan Inamori Kyocera Echelle) on the Magellan-Clay telescope at Las Campanas Observatory in Chile (Bernstein et al., 2003) on 11 March 2010, with a coverage of 4800–9000 Å and resolution, R35,000. The data were reduced using the Image Reduction and Analysis Facility (IRAF) tasks CCDPROC, APFLATTEN, and DOECSLIT (Tody, 1993).
We also obtained 4 low dispersion spectra of RECX-11, covering the H line, between 27 November and 22 December 2009, using the Small and Medium Aperture Research Telescope System SMARTS 1.5m telescope at CTIO. We used the RC spectrograph, which is a long-slit spectrograph with a Loral CCD detector; the slit subtends 5 arcmin on the sky and has a 1.5 arcsec slit width. All observations were made by SMARTS service observers and each night consisted of 3 observations with 5 minute integration time. The three observations are median-filtered to minimize contamination by cosmic rays. The data was reduced with the SMARTS spectroscopic data reduction pipeline†††http://www.astro.sunysb.edu/fwalter/SMARTS/smarts_15ms ched.html#RCpipeline. We subtracted the bias and trimmed the overscan and flattened the image using dome flats. The spectra were extracted by fitting a Gaussian plus a linear background at each column. Uncertainties were based on counting statistics, including uncertainties in the fit background level. The wavelength calibration was based on an arc lamp spectrum obtained before each set of images.
Finally, we obtained spectra of the He I line from RECX-11 with Phoenix on Gemini South on 12 December 2009 and from both RECX-1 and RECX-11 using CRIRES on VLT-UT1 on 22 May 2011. The observations were obtained in an ABBA nod pattern. The star Cha, a B8 pre-main sequence star with no detectable photospheric features at 10830 Å, was observed to provide the telluric correction. These spectra were reduced with custom-written routines in IDL. The wavelength solution is accurate to km s-1 and was calculated from a linear fit to telluric absorption lines obtained from spectra generated by ATRAN (Lord 1992) and available online.
3 Accretion Analysis
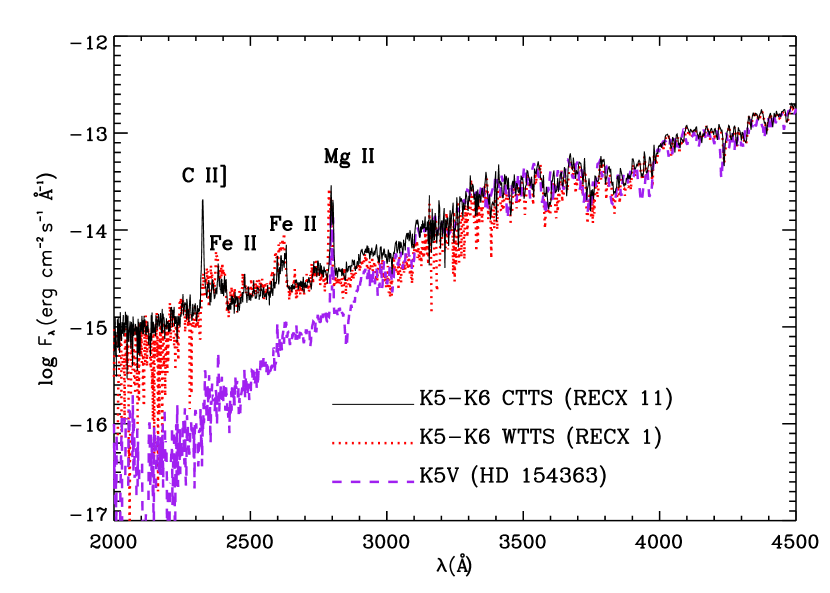
Figure 1 shows the STIS NUV spectra of RECX-1 and RECX-11; they are remarkably similar, making it difficult to assess if either is accreting based on a UV excess. Also shown in Figure 1 is a STIS spectrum of the inactive K5V star HD 154363 (Martínez-Arnáiz et al., 2010, properties in Table 1) taken from the HST/STIS Next Generation Spectral Library (Heap & Lindler, 2007), for comparison. Both Cha sources have excess NUV emission compared to the main sequence standard (§4.1). Despite the similarity of NUV fluxes, analysis of emission line profiles shows that one source, RECX-11, is still accreting material from the disk while the other, RECX-1, is not. In this section we review this evidence. We find that the emission line profiles of RECX-11 show redshifted absorption components indicative of accreting material, and consistent with magnetospheric accretion. As mentioned before, accretion shock emission is then expected from the accreting star, but it must be hidden by intrinsic chromospheric emission present in both the accreting and the non-accreting stars; this points to a very low accretion luminosity and mass accretion rate. In §4 we estimate upper limits for these quantities.
3.1 Diagnostics of Low Accretion
3.1.1 Lines Produced by Accretion and Related Processes
Our spectroscopic observations, from the FUV to the IR, include a number of emission lines that trace phenomena such as accretion and outflows in T Tauri stars. Line widths of several hundred are used to identify accretors, but the most conspicuous indicators are redshifted and blueshifted absorption components on the emission line profiles.
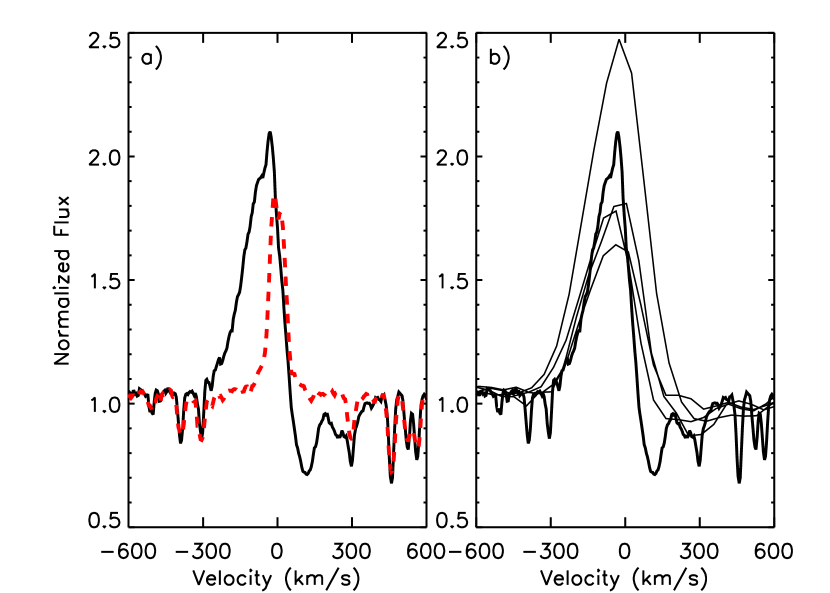
Accessible in the optical, the H emission line is one of the most commonly used accretion tracers. Figure 2 shows MIKE H line profiles for RECX-11 and RECX-1. The H equivalent widths (EW) of RECX-11 and RECX-1 are 4 Å and 1.3 Å, respectively, which would make RECX-1 a WTTS and RECX-11 a borderline CTTS/WTTS according to the standard criterion for a K5–K6 star (White & Basri, 2003). The H profile of RECX-1 in Figure 2a agrees with the WTTS classification because it is symmetric and narrow. With a line width at 10% of the peak intensity of only 130 km s-1, the line shows no indication of the high velocities that are characteristic of magnetospheric accretion. In contrast, the H profile of RECX-11 is typical of accreting sources, with a line width at 10% of 300 km s-1 (White & Basri, 2003). The blue emission wing is wide, extending to velocities of several hundred km s-1, implying that material is accreting at nearly free-fall velocities. Inverse P Cygni absorption due to infalling material along the accretion streams is also seen (Lima et al., 2010; Muzerolle et al., 2003; Walter, 1999). The line profile is consistent with model predictions for a high inclination source (Muzerolle et al., 2001; Kurosawa et al., 2006), in agreement with the inclination of i , estimated from the values of the projected rotation velocity sin (Jayawardhana et al., 2006) and the rotational period (Lawson et al., 2001). Moreover, Lawson et al. (2004) compared their observed H profile of RECX-11 with magnetospheric accretion models and obtained a good fit assuming an inclination of i .
In Figure 2b, we show our MIKE profile and the four SMARTS low resolution H profiles of RECX-11 obtained within a few days before and after the HST observations. The H profile is highly variable, as already noted by Lawson et al. (2004) and Jayawardhana et al. (2006). The wide blue emission wing is present in all spectra, but variability is conspicuous in the red wing, sometimes showing narrow transient red-shifted absorption components. This variability points to a complex geometry of the accretion streams very close to the star since red-shifted absorption occurs when material in the accretion columns absorbs hot radiation produced in the accretion shock on the stellar surface (Bouvier et al., 2007; Muzerolle et al., 2001). The complex structure revealed by the line profiles of H, which in the case of RECX-11 is conclusive in identifying accretion, would have been missed when only considering the equivalent width of the line.
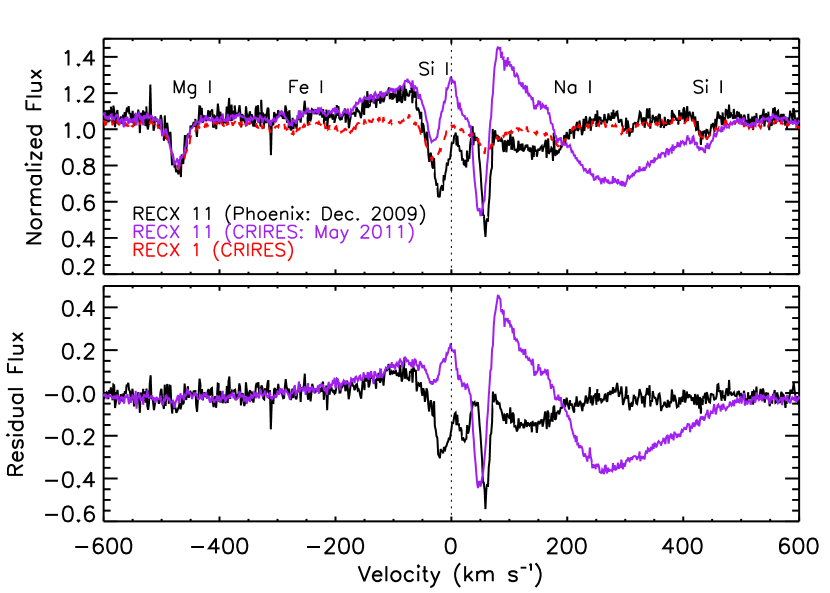
In Figure 3 we show two He I 10830 profiles for RECX-11 obtained 18 months apart with Phoenix and CRIRES along with a CRIRES spectrum of RECX-1 for comparison. We also show the RECX-11 line profiles after subtraction of the RECX-1 line profile (with the Phoenix observation at the resolution of CRIRES) which removes any contribution by photospheric absorption lines. The He I 10830 emission profiles show absorption components similar to those found by Edwards et al. (2006) and Fischer et al. (2008) in a large sample of CTTS, which were interpreted as arising in the wind and in the accretion columns. The earlier Phoenix profile shows a broad red-shifted absorption component extending to with several deep, narrow red and blue-shifted absorption lines at lower velocities, between . The second, CRIRES, profile also shows a complex absorption spectrum with a broad component extending from 200–400 km s-1. It also shows a red-shifted emission wing which was not observed in the Phoenix observation. The broad high velocity absorption feature in the CRIRES spectrum occurs at velocities typical of material infalling along accretion streams. According to magnetospheric accretion models, material falling from 5 in the disk onto a star with the mass and radius of RECX-11 will reach velocities of , capable of producing the absorption features at the observed velocities (Calvet & Gullbring, 1998).
Fischer et al. (2008) found that sources with low accretion rates, observed to have low veiling at 1 m (), were more likely to have redshifted absorption in He I than sources with high accretion rates. Fischer et al. (2008) also found that in order to explain the He I 10830 profiles, absorption over a large range of velocities was necessary. They proposed that in low sources accretion occurs in low density, narrow accretion “streamlets” with small filling factors, covering a large velocity range, although none of their sources had low enough accretion rates to test this scenario. The narrow red-shifted absorption features in the Phoenix spectrum of our very low accretor, RECX-11 (§4), may be observational evidence for these multiple, narrow accretion streams. Some of these narrow features, like the one at , may be related to the feature at comparable velocity in seen in the MIKE H profile (Figure 2), although no definite conclusion can be stated since the lines were observed at different times. Simultaneous extensive coverage of H and He I 10830 is necessary to understand the complexity of the accretion flows in RECX-11.
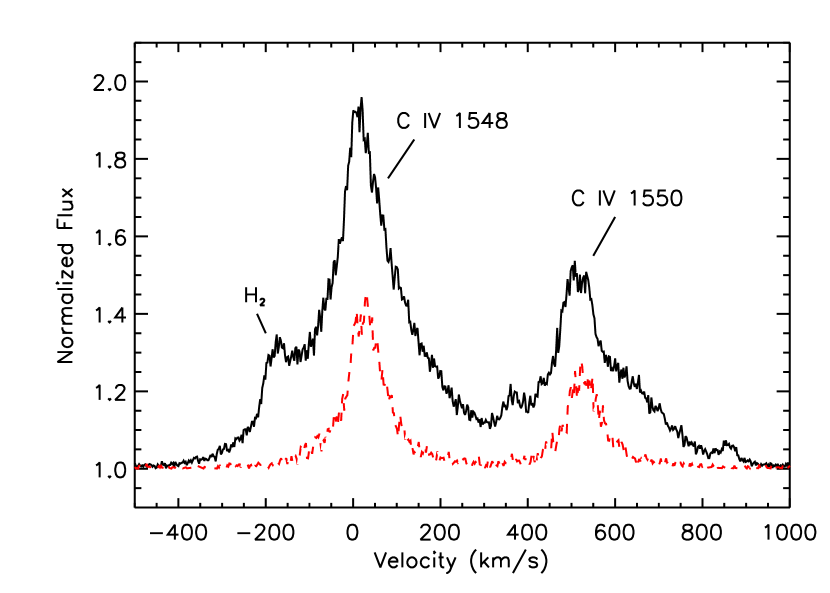
In addition to H and He I 10830, the C IV doublet in the FUV spectrum can be used to separate accretors from non-accretors. The C IV 1549 line emission has been shown to correlate with the mass accretion rate, indicating that its origin is, at least in part, in the accretion shock and flows (Johns-Krull et al., 2000; Calvet et al., 2004). In Figure 4 we compare the C IV line profiles of the accretor, RECX-11, to the non-accretor, RECX-1. The C IV line profile is much wider and stronger in the accreting source than in the WTTS, in which the emission is expected to be chromospheric. The strength and width of C IV in RECX-11 is consistent with the accreting nature of RECX-11 (Ardila et al. in preparation).
In the NUV range, the only significant difference between the spectra of RECX-11 and RECX-1 is in the CII] 2325 Å line, which is much stronger in RECX-11 (Figure 1). This line has been observed in other accreting sources (Gómez de Castro & Ferro-Fontán, 2005; Calvet et al., 2004), and its likely origin is the accretion shock.
3.1.2 The H2 Lines
The FUV spectrum of RECX-11 contains a wealth of lines due to molecular species, including H2 (France et al., 2011). Lines from H2 in the UV are mainly due to two mechanisms. Ly emission excites H2, producing a fluorescent spectrum in the UV as the electrons cascade back to the ground electronic state (Herczeg et al., 2002, 2004; Yang et al., 2011). In addition, fast electrons can collisionally excite H2, resulting in UV lines and continua (Bergin et al., 2004; Ingleby et al., 2009).
Using emission from collisionally excited H2 measured in low resolution FUV spectra of a large sample of both accreting and non-accreting young stars, Ingleby et al. (2009) showed that by the time accretion ends, the inner disks are depleted of gas. Our targets confirm this trend at high resolution. In Figure 5 we show the COS FUV spectrum of RECX-11 compared to RECX-1; the wavelengths at which H2 pumped by Ly may emit are labeled. H2 emission lines at 1434.1 and 1445.3 Å may also be pumped by the C III 1174 Å multiplet (Herczeg et al., 2002). Figure 5 shows that the COS FUV spectrum of RECX-11 is rich in lines of molecular gas, similar to previously observed sources with confirmed accretion (Bergin et al., 2004; Herczeg et al., 2002, 2004; France et al., 2010). In contrast, molecular lines are not apparent in the FUV spectra of the WTTS RECX-1. If present, the flux of the H2 lines in RECX-1 is 5% of the H2 flux in RECX-11.
Assuming that the molecular lines are formed in the atmosphere of the disk (Herczeg et al., 2004), we constructed synthetic models for an optically thin line formed between radii and in a Keplerian disk. We assumed that the emissivity depended on radius as and that the intrinsic line profile was a Gaussian with width corresponding to a temperature of 2500 K. The intensity at each radius was convolved with the rotational profile corresponding to the Keplerian velocity of the annulus, and the flux was then calculated by integrating the intensity over the range of radii. Finally, the resultant profile was convolved with the G130M line spread function.
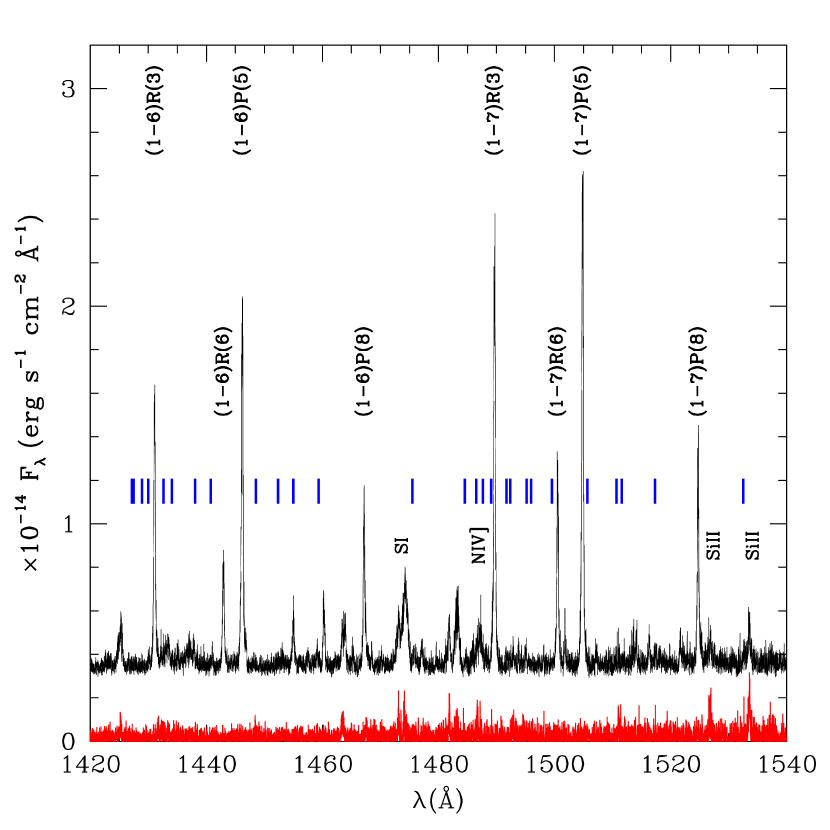
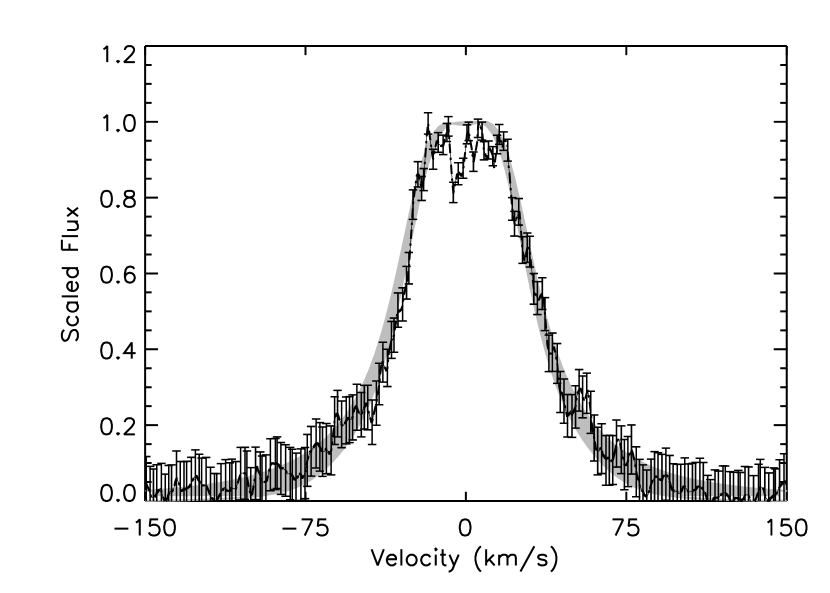
Figure 6 compares the predicted profile to a flux-weighted average of H2 lines, selected from the spectral region (1330 Å) in which all the lines were observed with the same grating, G130M. The continuum of the predicted profile has been scaled to the observed continuum. The shaded region in Figure 6 corresponds to predicted profiles for models with inner radius between (0.01–0.1 AU), outer radius (0.3–3.2 AU), and emissivity power law exponent . for the range of models shown in Figure 6. We find that the inner radius is well constrained, within the uncertainties of the observations; small inner radii with high Keplerian velocities are needed to account for the width of the observed wings. The outer radius , on the other hand, is not well constrained, since little emission comes from those regions. The power law of the emissivity is constrained by the width of the line near the peak, and we require it to fall rapidly with radius. This rapid fall-off is likely due to the combination of a number of factors. For instance, the excitation will decrease as the flux of Ly decreases with distance; similarly, the number of electrons in excited states that can absorb Ly transitions decreases with radius, as the temperature of the upper disk layers drops (Meijerink et al., 2008). Our modeling indicates that the region of formation of the H2 lines can be as close to the star as 0.01-0.1 AU, as was also found for the accreting brown dwarf 2M1207 (France et al., 2010). This indicates that gas likely extends close to the stellar surface, inside the dust truncation radius, and reaches the stellar magnetosphere, see section 5.2.
3.2 Unreliable accretion diagnostics at low
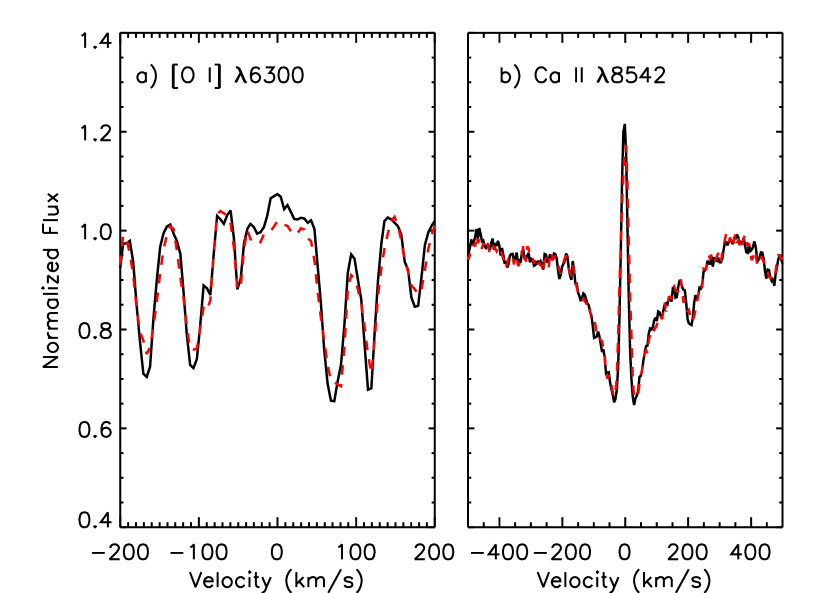
Additional tracers of accretion present in our dataset, like [O I] at 6300 and 6363 Å and the Ca II infrared triplet, do not provide conclusive indication of accretion in RECX-11. [O I] emission, which is expected to originate in an outflow, is observed only in sources undergoing accretion (Hartigan et al., 1995). We show in Figure 7a the line profiles of [O I] 6300 of RECX-11 and RECX-1. [O I] 6300 appears in RECX-11 in excess over the WTTS spectrum of RECX-1, but the detection is , and therefore not reliable. Similarly, the Ca II 8542 is often used as an indicator of accretion, and even used to measure mass accretion rates (Muzerolle et al., 1998). However, the profile of this line in RECX-11, shown in Figure 7b, is indistinguishable from the same line in RECX-1, indicating that the flux comes mostly from the chromosphere.
The Mg II 2800 line luminosity also correlates with accretion luminosity in accreting stars (Calvet et al., 2004) and is seen in our STIS spectra (Figure 1). The line is observed to have the same strength in the weakly accreting star, the WTTS and the dwarf star, indicating that it is mainly due to chromospheric activity. Moreover, its strength does not increase with the NUV emission level of the chromosphere. This agrees with the results of Cardini & Cassatella (2007), who show that at ages 0.3 Gyr, the Mg II 2800 fluxes are not observed to change due to saturation effects, and so the line strength does not reflect the level of chromospheric activity.
4 Measuring Small Accretion Rates
4.1 The Chromosphere
While dwarf or giant stars have been used to estimate the intrinsic stellar emission in CTTS when measuring the UV excess, WTTS are the best templates for accretion analysis because they have similar surface densities and are expected to have comparable levels of chromospheric emission. The presence of a UV excess in non-accreting pre-main sequence stars and active stars (when compared to inactive dwarf stars) due to enhanced chromospheric activity is well established (Houdebine et al., 1996; Franchini et al., 1998). In fact, recent studies with GALEX have relied on this excess to identify young stars in nearby star forming regions (Rodriguez et al., 2011; Shkolnik et al., 2011; Findeisen & Hillenbrand, 2010). This UV excess due to chromospheric emission affects measurements of the excess emission from which accretion luminosities are derived. Several studies have already taken these effects into account. For instance,Valenti et al. (2003) used the average spectrum of several WTTS to estimate the UV excess in low resolution International Ultraviolet Explorer (IUE) spectra of accreting stars. Similarly, Herczeg & Hillenbrand (2008) used WTTS templates to measure flux excesses and estimate accretion rates in very low mass objects. However, many determinations of accretion luminosities and accretion rates based on UV fluxes have used dwarf standards as templates (Gullbring et al., 2000; Calvet et al., 2004). The omission of the chromospheric fluxes makes these determinations, and calibrations of line luminosities derived from them, uncertain at the low end.
In this work we have presented UV fluxes of RECX-1, which to date, is the only WTTS spectrum with the signal and resolution needed for use as a chromospheric template. We compare the spectrum of the inactive K5 main sequence star (HD 154363) with that of RECX-1, shown in Figure 1. The flux between 2000–5000 Å from RECX-1 is 0.05 brighter than that from HD 154363. If this luminosity difference were due to accretion, we would have estimate that RECX-1 is accreting at log , which is typical of a CTTS. This is a lower limit because we have not accounted for any excess emission outside of the range of observations. This clearly demonstrates the effect of an active chromosphere on the UV spectrum and shows that inactive main sequence standards should not be used to measure small NUV excesses. It can be argued that the chromospheric level of RECX-1 is not typical of WTTS because it is a binary. However, with a binary separation 15 AU (Köhler & Petr-Gotzens, 2002; Brandeker et al., 2006) it is unlikely that the stars are interacting. In any event, a survey of NUV spectra of WTTS of different spectral types and luminosities is needed to determine the characteristic range of chromospheric NUV emission in these stars.
4.2 Estimate of the mass accretion rate from NUV emission
With evidence that RECX-11 is accreting, we use shock models to estimate upper limits to the accretion luminosity and mass accretion rate of RECX-11. A full description of the accretion shock models can be found in Calvet & Gullbring (1998); here we review the main characteristics. An accretion shock forms at the stellar surface when material from the disk falls onto the star along magnetic field lines (§1). The shock formed at the base of the accretion column slows the material to match the stationary photosphere, converting the kinetic energy into thermal energy, and causing the temperature to increase sharply. The shock emits soft X-rays into the pre-shock and post-shock regions and the photosphere below the shock. The heated gas emits the observed excess continuum emission which is strongest in the UV (Calvet & Gullbring, 1998). The accretion shock model is used to fit the NUV excess emission and account for shock emission outside of the range of observations. The model yields the accretion luminosity, from which the mass accretion rate can be derived with knowledge of the stellar mass and radius, through . The accretion shock model assumes that all the excess flux in the UV comes from accretion, neglecting any contribution from the outflow. Since the luminosity of the wind is 10% of the accretion luminosity for typical mass loss rates (Cranmer, 2009) this assumption is justified.
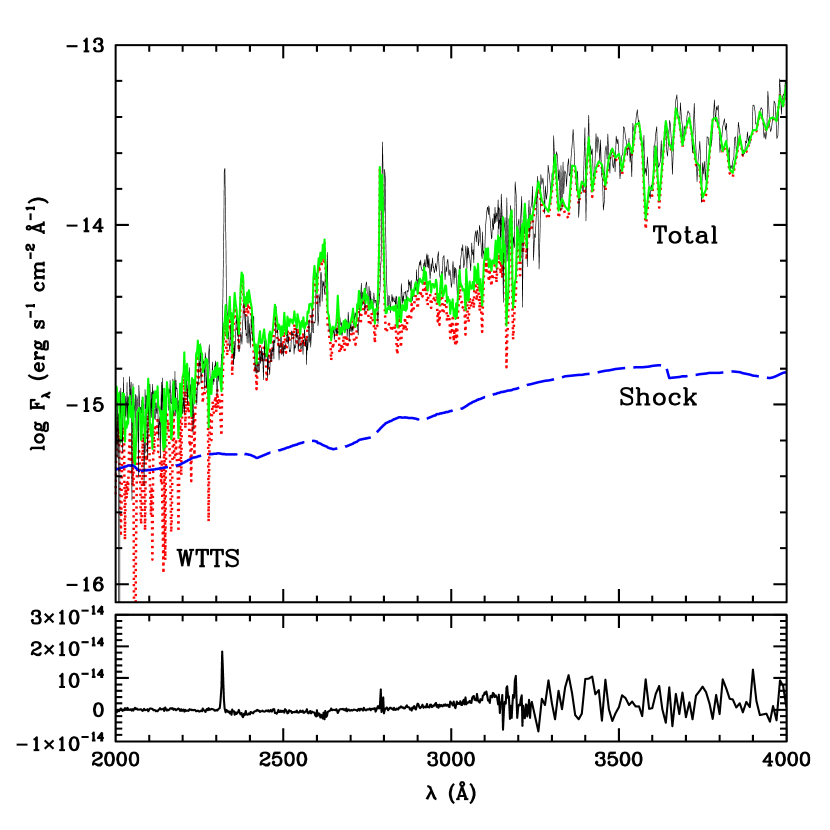
We model the spectrum of RECX-11 as the sum of the WTTS RECX-1, used as a proxy for the intrinsic stellar emission, and the accretion shock emission; our fit to the observations is shown in Figure 8 and has a . Since the NUV fluxes of RECX-11 are essentially chromospheric, our aim is to determine the amount of shock emission that may be hidden in the spectrum of RECX-11. We find that is the highest value of the mass accretion rate that RECX-11 could have and still not show an excess over the chromospheric emission or veiling in the optical absorption lines.
The upper limit on is consistent with estimates of accretion from the emission lines shown in Figures 2 and 4. From the width of the H line at 10% of the maximum and the relation between 10% width and of Natta et al. (2004), we find . Also, from the flux in the C IV 1549Å line, we find from the relation between C IV flux and in Valenti et al. (2003). Lawson et al. (2004) fit their H line profile of RECX-11 with a magnetospheric accretion model, finding good agreement for a model with a mass accretion rate of , also consistent with our upper limit.
5 Discussion
5.1 vs
While it is ideal to measure from the peak of the excess emission, in the UV, it is often not possible to obtain these observations. To overcome this difficulty, Gullbring et al. (1998) calibrated the excess luminosity in the broad band, , in terms of the accretion luminosity, , for a sample of stars for which they had medium resolution spectra from 3200 to 5400 Å. Accretion luminosities were measured for each star in this sample by extracting the excess flux through veiling measurements and using a slab model to account for energy outside the observed bands. The excess luminosity in was measured by subtracting the flux in the band of a main sequence standard with the same magnitude from the observed band fluxes. This correlation was later reproduced using the accretion shock model described in §4.2 (Calvet & Gullbring, 1998). The vs relation is commonly utilized in studies of large populations because it provides a convenient method for finding (Rigliaco et al., 2011a; Ingleby et al., 2009; Grosso et al., 2007; Robberto et al., 2004; White & Ghez, 2001; Rebull et al., 2000; Hartmann et al., 1998). However, as discussed above, the calibration was developed using dwarf stars as templates against which the band excess was measured, and as we have shown, T Tauri stars have active chromospheres which contribute to the excess.
The UV excess observed in the WTTS RECX-1 significantly decreases the estimated excess from the accretion shock emission in the NUV. Assuming that the chromospheric emission in RECX-1 is typical for K5 stars, then the intrinsic chromospheric NUV flux would be 0.05 (§4.1.) If this NUV excess were interpreted as an “accretion luminosity”, using the Gullbring et al. (1998) relation between and band excess, the excess luminosity in the U band just due to chromospheric emission would be 0.01 . This suggests that for the K5 spectral range, band excesses and derived accretion luminosities below these limits should be taken with caution. An extensive survey of the intrinsic chromospheric emission in WTTS covering a wide spectral range is necessary to quantify the expected chromospheric emission in CTTS. A re-calibration of the vs. relation using characteristic chromospheric contributions may extend its range of application to low values of and .
5.2 RECX-11 and Disk Evolution
RECX-11 is in the Chamaeleontis group, with an estimated age of 5-9 Myr. This age range is interesting because disk frequency studies indicate that 80% of the original disks have already dissipated by 5 Myr (Hernández et al., 2008). The disk around RECX-11 is then one of the few survivors and a study of its properties can give insight into the mechanisms of disk survival and dissipation.
In the age range of RECX-11, viscous disk evolution would predict a value for the between and , extrapolating for the dispersion observed in other populations (Calvet et al., 2005). The for RECX-11 is below this range, so additional disk dispersal mechanisms like photoevaporation may be at play. According to one type of photoevaporation model, EUV photons would ionize the disk surface; a wind is established outside a radius where the gas escape velocity becomes higher than the sound speed. The predicted mass loss rates for EUV photoevaporation is (Alexander & Armitage, 2007). After the mass accretion rate becomes comparable to the mass loss rate, mass does not reach the inner disk, which drains onto the star in timescales comparable to the local viscous time, years (Clarke et al., 2001). An inner disk hole is thus created, and EUV irradiation of its edge is expected to quickly erode the rest of the disk (Alexander et al., 2006). For the mass of RECX-11 (Table 1), the value of (Clarke et al., 2001) would be 7 AU. With further refinements of the theory, the value of the critical radius can be decreased to (Font et al., 2004; Adams et al., 2004). This implies that if EUV photoevaporation were active with mass loss rates greater than the low accretion rate of RECX-11, a hole of at least 0.7 AU should have developed in the RECX-11 disk.
A second type of photoevaporation model includes the effects of stellar X-ray and FUV emission and predicts higher mass loss rates than the EUV models (Ercolano et al., 2008; Gorti & Hollenbach, 2009a). According to the predictions of the X-ray driven photoevaporation models, the wind mass loss rate scales with the X-ray luminosity. The X-ray luminosity of RECX-11 has been recently measured by XMM Newton to be (López-Santiago et al., 2010), very similar to the value estimated from ROSAT observations (Mamajek et al., 2000). The disk of RECX-11 must have been subject to this influx of high energy radiation for most of its lifetime, since the X-ray luminosity stays approximately constant in the 1 - 10 Myr age range (Ingleby et al., 2011). With the observed value of the X-ray luminosity, the mass loss rate predicted by X-ray driven photoevaporation is , and the low value of the accretion rate would imply that the disk was quickly clearing its inner regions, with timescales yrs (Owen et al., 2011). So, for the X-ray photoevaporation models, the innermost disk regions should be cleared or in the process of being cleared.
To find evidence of the effects of photoevaporation on the disk of RECX-11, we have constructed the SED shown in Figure 9. We plot fluxes at the , , , bands (Lyo et al., 2004; Lawson et al., 2001) and , , and bands from the 2MASS survey (Skrutskie et al., 2006) along with Spitzer/IRAC [3.6], [4.5], [5.8], and [8] and MIPS [24] and [70] bands from Sicilia-Aguilar et al. (2009). We also include the Spitzer IRS spectrum, observed in the SL1 and LL modes; the spectrum was downloaded from the Spitzer archive and reduced with version S18.7 of the Spitzer Science Center pipeline using the SMART data reduction package (Higdon et al., 2004) following the description in McClure et al. (2010). The SED of a K5 star, scaled at , is shown for comparison; this SED was constructed with colors taken from Kenyon & Hartmann (1995). The median SED of Taurus (D’Alessio et al., 1999), also scaled at , is also shown.

The SED shown in Figure 9 of RECX-11 shows excess above the photosphere at all wavelengths m. Beyond the near infrared, the fluxes are lower than the median SED of Taurus, a proxy for optically thick disks in which dust is present all the way into the dust sublimation radius. The slope of the SED between 13 and 31 m of is steeper than the median value of -0.4 for Taurus, indicating a significant degree of dust settling in the RECX-11 disk (Furlan et al., 2006, 2009; McClure et al., 2010). In addition, the profiles of the 10 m and 20 m silicate features in the IRS spectrum are wider than those found in the ISM (Sicilia-Aguilar et al., 2009) and contain substructure consistent with significant dust evolution, either in the form of grain growth or crystallization (Watson et al., 2009).
Despite the high degree of evolution of dust in the disk, the SED of RECX-11 does not show indications of an inner cleared region. In fact, the location of RECX11 in the K-[8] vs. K-[24] diagram corresponds to that of full disks according to the study of circumstellar disks at various stages of evolution by Ercolano et al. (2011). Moreover, the SED of RECX-11 shows a substantial near-IR excess, comparable to the median SED of Taurus, despite the low fluxes at longer wavelengths. The largest contributor to the near-IR excess in T Tauri star disks is the optically thick “wall” at the dust destruction radius, the sharp transition between the dust and gas disk (D’Alessio et al., 2006; Dullemond & Monnier, 2010). For the parameters of RECX-11, the dust destruction radius is of the order of AU, taking the simple expression for the equilibrium temperature, with K as the dust sublimation temperature, and = 4350K for a K5 star (Dullemond & Monnier, 2010).
The evidence then seems to rule out inner clearing in the disk of RECX-11. First, it is accreting, so mass has to reach the magnetospheric radius, 3-5 stellar radii, 0.03 AU. Substantial H2 emission is observed, coming from gas regions as close in as 0.01-0.1 AU to the central star, typical of all accretors. Moreover, dust extends inwards to 0.06 AU. These inner radii, where disk material is present, are not consistent with those predicted for photoevaporation models, according to which the innermost AU of the disk should be clear. It could be argued that the disk of RECX-11 has been caught in the short phase when the inner disk is still accreting its remaining mass onto the star. However, the recent analysis of the disk of another star in the Cha group, ET Cha (ECHA J0843.3-7915 = RECX-15) casts some doubt on this suggestion (Woitke et al., 2011). The disk of ET Cha is also accreting (Lawson et al., 2004); it is very evolved with very low dust and gas masses, but still has a very substantial near-IR excess consistent with emission from the dust destruction radius (Woitke et al., 2011). For a 5-9 Myr population of less than 20 stars (Mamajek et al., 2000) the probability of finding 2 stars in a phase lasting only years is low. Overall, the evidence provided by low accretors in evolved populations suggests that current models of disk dissipation by photoevaporation with high mass loss rates may need to be re-visited. Our upper limit on does not, however, rule out photoevaporation at the low mass loss rates predicted by the EUV photoevaporation models and indeed, evidence for EUV driven mass loss has been observed in several young stars (Pascucci & Sterzik, 2009b).
6 Summary and Conclusions
We used multi-wavelength observations of the CTTS RECX-11 and the WTTS RECX-1 to investigate their accretion properties. We found:
-
•
Multi-wavelength observations provide the clearest picture of the accretion properties of a low T Tauri star. Observations of molecular gas in the FUV may be the most sensitive accretion probe, since these lines are only present in accreting sources (Ingleby et al., 2009), and their line profiles are consistent with an origin in the disk, very close to the star. In the optical and near infrared, the most sensitive indications of accretion come from high resolution observations of the H and He I 10830 emission lines. These show variable and multiple redshifted absorption components which reveal the complex structure of the magnetosphere in a low source. For very low values of , lines normally used as accretion indicators such as the Ca II IR triplet lines, arise mostly in the stellar chromosphere and are not sensitive to accretion.
-
•
The contribution from the stellar chromosphere to the NUV flux can be substantial and may result in estimates of the accretion luminosity from excesses that are significantly higher than the actual value of . For RECX-1, a K5 star that is not accreting, as determined from its narrow H line profile and from the lack of H2 lines in the FUV, its chromospheric NUV excess over the photosphere of a standard dwarf star would result in incorrect estimates of and . For the middle K spectral range, estimates of accretion less than these limits based on methods calibrated with standard dwarf stars should be taken with caution.
-
•
When accounting for the active chromospheres of T Tauri stars by using a WTTS as a template against which to measure the NUV excess, we determine a very low for RECX-11, .
-
•
Given the low mass accretion rate, the high X-ray luminosity, and the advanced age of RECX-11, photoevaporation is expected to be driving the final evolution of its disk; if this was the case, the innermost disk regions, AU should be clear. However, we find evidence for gas and dust in the innermost disk of RECX-11, as indicated by ongoing accretion, the detection of H2 lines formed in the innermost disk, and emission from optically thick dust at the dust destruction radius at levels consistent with other CTTS. This, together with similar evidence provided by other slowly accreting, old disks, suggests that models for photoevaporation-driven disk dissipation resulting in high values of the mass loss rate should be revisited.
7 Acknowledgments
We thank Will Fischer for help reducing the Phoenix data to obtain the He I line profile. We thank the SMARTS service for obtaining the SMARTS spectra. Stony Brook University is a member of the SMARTS partnership. This work was supported by NASA grants for Guest Observer program 11616 to the University of Michigan, Caltech, Stony Brook University and the University of Colorado. Based on observations made with the NASA/ESA Hubble Space Telescope, obtained from the Space Telescope Science Institute data archive. STScI is operated by the Association of Universities for Research in Astronomy, Inc. under NASA contract NAS 5-26555. C.E. was supported by the National Science Foundation under Award No. 0901947. RA acknowledges support from the Science & Technology Facilities Council (STFC) through an Advanced Fellowship (ST/G00711X/1).
References
- Adams et al. (2004) Adams, F. C., Hollenbach, D., Laughlin, G., & Gorti, U. 2004, ApJ, 611, 360
- Alexander & Armitage (2007) Alexander, R. D., & Armitage, P. J. 2007, MNRAS, 375, 500
- Alexander et al. (2006) Alexander, R. D., Clarke, C. J., & Pringle, J. E. 2006, MNRAS, 369, 229
- Ardila & Johns-Krull (2009) Ardila, D. R., & Johns-Krull, C. M. 2009, American Institute of Physics Conference Series, 1094, 309
- Bary et al. (2008) Bary, J. S., Weintraub, D. A., Shukla, S. J., Leisenring, J. M., & Kastner, J. H. 2008, ApJ, 678, 1088
- Bergin et al. (2004) Bergin, E., et al. 2004, ApJ, 614, L133
- Bernstein et al. (2003) Bernstein, R., Shectman, S. A., Gunnels, S. M., Mochnacki, S., & Athey, A. E. 2003, Proc. SPIE, 4841, 1694
- Bethell & Bergin (2009) Bethell, T., & Bergin, E. 2009, Science, 326, 1675
- Bitner et al. (2008) Bitner, M. A., Richter, M. J., Lacy, J. H., et al. 2008, ApJ, 688, 1326
- Bouvier et al. (2007) Bouvier, J., et al. 2007, A&A, 463, 1017
- Brandeker et al. (2006) Brandeker, A., Jayawardhana, R., Khavari, P., Haisch, K. E., Jr., & Mardones, D. 2006, ApJ, 652, 1572
- Calvet & Gullbring (1998) Calvet, N., & Gullbring, E. 1998, ApJ, 509, 802
- Calvet et al. (2004) Calvet, N., Muzerolle, J., Briceño, C., Hernández, J., Hartmann, L., Saucedo, J. L., & Gordon, K. D. 2004, AJ, 128, 1294
- Calvet et al. (2005) Calvet, N., Briceño, C., Hernández, J., Hoyer, S., Hartmann, L., Sicilia-Aguilar, A., Megeath, S. T., & D’Alessio, P. 2005, AJ, 129, 935
- Cardini & Cassatella (2007) Cardini, D., & Cassatella, A. 2007, ApJ, 666, 393
- Carr & Najita (2008) Carr, J. S., & Najita, J. R. 2008, Science, 319, 1504
- Clarke et al. (2001) Clarke, C. J., Gendrin, A., & Sotomayor, M. 2001, MNRAS, 328, 485
- Cranmer (2009) Cranmer, S. R. 2009, ApJ, 706, 824
- D’Alessio et al. (2006) D’Alessio, P., Calvet, N., Hartmann, L., Franco-Hernández, R., & Servín, H. 2006, ApJ, 638, 314
- D’Alessio et al. (1999) D’Alessio, P., Calvet, N., Hartmann, L., Lizano, S., & Cantó, J. 1999, ApJ, 527, 893
- Danforth et al. (2010) Danforth, C. W., Keeney, B. A., Stocke, J. T., Shull, J. M., & Yao, Y. 2010, ApJ, 720, 976
- Dullemond & Monnier (2010) Dullemond, C. P., & Monnier, J. D. 2010, ARA&A, 48, 205
- Edwards et al. (2006) Edwards, S., Fischer, W., Hillenbrand, L., & Kwan, J. 2006, ApJ, 646, 319
- Ercolano et al. (2011) Ercolano, B., Clarke, C. J., & Hall, A. C. 2011, MNRAS, 410, 671
- Ercolano et al. (2008) Ercolano, B., Drake, J. J., Raymond, J. C., & Clarke, C. C. 2008, ApJ, 688, 398
- Findeisen & Hillenbrand (2010) Findeisen, K., & Hillenbrand, L. 2010, AJ, 139, 1338
- Fischer et al. (2008) Fischer, W., Kwan, J., Edwards, S., & Hillenbrand, L. 2008, ApJ, 687, 1117
- Font et al. (2004) Font, A. S., McCarthy, I. G., Johnstone, D., & Ballantyne, D. R. 2004, ApJ, 607, 890
- France et al. (2010) France, K., Linsky, J. L., Brown, A., Froning, C. S., & Béland, S. 2010, ApJ, 715, 596
- France et al. (2011) France, K., Schindhelm, E., Burgh, E. B., et al. 2011, ApJ, 734, 31
- Franchini et al. (1998) Franchini, M., Morossi, C., & Malagnini, M. L. 1998, ApJ, 508, 370
- Furlan et al. (2009) Furlan, E., et al. 2009, ApJ, 703, 1964
- Furlan et al. (2006) Furlan, E., et al. 2006, ApJS, 165, 568
- Gómez de Castro & Ferro-Fontán (2005) Gómez de Castro, A. I., & Ferro-Fontán, C. 2005, MNRAS, 362, 569
- Gorti & Hollenbach (2009a) Gorti, U., & Hollenbach, D. 2009a, ApJ, 690, 1539
- Gorti et al. (2009b) Gorti, U., Dullemond, C. P., & Hollenbach, D. 2009b, ApJ, 705, 1237
- Grosso et al. (2007) Grosso, N., Audard, M., Bouvier, J., Briggs, K. R., Güdel, M. 2007, A&A, 468, 557
- Gullbring et al. (2000) Gullbring, E., Calvet, N., Muzerolle, J., & Hartmann, L. 2000, ApJ, 544, 927
- Gullbring et al. (1998) Gullbring, E., Hartmann, L., Briceno, C., & Calvet, N. 1998, ApJ, 492, 323
- Günther et al. (2007) Günther, H. M., Schmitt, J. H. M. M., Robrade, J., & Liefke, C. 2007, A&A, 466, 1111
- Hartigan et al. (1995) Hartigan, P., Edwards, S., & Ghandour, L. 1995, ApJ, 452, 736
- Hartmann et al. (1998) Hartmann, L., Calvet, N., Gullbring, E., & D’Alessio, P. 1998, ApJ, 495, 385
- Heap & Lindler (2007) Heap, S. R., & Lindler, D. J. 2007, From Stars to Galaxies: Building the Pieces to Build Up the Universe, 374, 409
- Herczeg & Hillenbrand (2008) Herczeg, G. J., & Hillenbrand, L. A. 2008, ApJ, 681, 594
- Herczeg et al. (2002) Herczeg, G. J., Linsky, J. L., Valenti, J. A., Johns-Krull, C. M., & Wood, B. E. 2002, ApJ, 572, 310
- Herczeg et al. (2004) Herczeg, G. J., Wood, B. E., Linsky, J. L., Valenti, J. A., & Johns-Krull, C. M. 2004, ApJ, 607, 369
- Hernández et al. (2008) Hernández, J., Hartmann, L., Calvet, N., Jeffries, R. D., Gutermuth, R., Muzerolle, J., & Stauffer, J. 2008, ApJ, 686, 1195
- Higdon et al. (2004) Higdon, S. J. U., et al. 2004, PASP, 116, 975
- Holmberg et al. (2009) Holmberg, J., Nordström, B., & Andersen, J. 2009, A&A, 501, 941
- Houdebine et al. (1996) Houdebine, E. R., Mathioudakis, M., Doyle, J. G., & Foing, B. H. 1996, A&A, 305, 209
- Ingleby et al. (2009) Ingleby, L., et al. 2009, ApJ, 703, L137
- Ingleby et al. (2011) Ingleby, L., Calvet, N., Hernández, J., Briceño, C., Espaillat, C., Miller, J., Bergin, E., & Hartmann, L. 2011, AJ, 141, 127
- Jayawardhana et al. (2006) Jayawardhana, R., Coffey, J., Scholz, A., Brandeker, A., & van Kerkwijk, M. H. 2006, ApJ, 648, 1206
- Johns-Krull et al. (2000) Johns-Krull, C. M., Valenti, J. A., & Linsky, J. L. 2000, ApJ, 539, 815
- Kenyon & Hartmann (1995) Kenyon, S. J., & Hartmann, L. 1995, ApJS, 101, 117
- Köhler & Petr-Gotzens (2002) Köhler, R., & Petr-Gotzens, M. G. 2002, AJ, 124, 2899
- Kurosawa et al. (2006) Kurosawa, R., Harries, T. J., & Symington, N. H. 2006, MNRAS, 370, 580
- Lawson et al. (2001) Lawson, W. A., Crause, L. A., Mamajek, E. E., & Feigelson, E. D. 2001, MNRAS, 321, 57
- Lawson et al. (2004) Lawson, W. A., Lyo, A.-R., & Muzerolle, J. 2004, MNRAS, 351, L39
- Lima et al. (2010) Lima, G. H. R. A., Alencar, S. H. P., Calvet, N., Hartmann, L., & Muzerolle, J. 2010, A&A, 522, A104
- Lord (1992) Lord, S. D., 1992, NASA Technical Memorandum 103957
- López-Santiago et al. (2010) López-Santiago, J., Albacete Colombo, J. F., & López-García, M. A. 2010, A&A, 524, A97
- Luhman & Steeghs (2004) Luhman, K. L., & Steeghs, D. 2004, ApJ, 609, 917
- Lyo et al. (2004) Lyo, A.-R., Lawson, W. A., & Bessell, M. S. 2004, MNRAS, 355, 363
- Mamajek et al. (1999) Mamajek, E. E., Lawson, W. A., & Feigelson, E. D. 1999, ApJ, 516, L77
- Mamajek et al. (2000) Mamajek, E. E., Lawson, W. A., & Feigelson, E. D. 2000, ApJ, 544, 356
- Martínez-Arnáiz et al. (2010) Martínez-Arnáiz, R., Maldonado, J., Montes, D., Eiroa, C., & Montesinos, B. 2010, A&A, 520, A79
- McClure et al. (2010) McClure, M. K., et al. 2010, ApJS, 188, 75
- Meijerink et al. (2008) Meijerink, R., Glassgold, A. E., & Najita, J. R. 2008, ApJ, 676, 518 2010, ApJS, 188, 75
- Muzerolle et al. (1998) Muzerolle, J., Calvet, N., & Hartmann, L. 1998, ApJ, 492, 743
- Muzerolle et al. (2001) Muzerolle, J., Calvet, N., & Hartmann, L. 2001, ApJ, 550, 944
- Muzerolle et al. (2003) Muzerolle, J., Hillenbrand, L., Calvet, N., Briceño, C., & Hartmann, L. 2003, ApJ, 592, 266
- Najita et al. (2010) Najita, J. R., Carr, J. S., Strom, S. E., Watson, D. M., Pascucci, I., Hollenbach, D., Gorti, U., & Keller, L. 2010, ApJ, 712, 274
- Natta et al. (2004) Natta, A., Testi, L., Muzerolle, J., Randich, S., Comerón, F., & Persi, P. 2004, A&A, 424, 603
- Owen et al. (2011) Owen, J. E., Ercolano, B., & Clarke, C. J. 2011, MNRAS, 412, 13
- Pascucci et al. (2009a) Pascucci, I., Apai, D., Luhman, K., et al. 2009a, ApJ, 696, 143
- Pascucci & Sterzik (2009b) Pascucci, I., & Sterzik, M. 2009b, ApJ, 702, 724
- Pinte et al. (2010) Pinte, C., et al. 2010, A&A, 518, L126
- Rayner et al. (2009) Rayner, J. T., Cushing, M. C., & Vacca, W. D. 2009, ApJS, 185, 289
- Rebull et al. (2000) Rebull, L. M., Hillenbrand, L. A., Strom, S. E., Duncan, D. K., Patten, B. M., Pavlovsky, C. M., Makidon, R., & Adams, M. T. 2000, AJ, 119, 3026
- Rigliaco et al. (2011a) Rigliaco, E., Natta, A., Randich, S., Testi, L., & Biazzo, K. 2011a, A&A, 525, A47
- Robberto et al. (2004) Robberto, M., Song, J., Mora Carrillo, G., Beckwith, S. V. W., Makidon, R. B., & Panagia, N. 2004, ApJ, 606, 952
- Rodriguez et al. (2011) Rodriguez, D. R., Bessell, M. S., Zuckerman, B., & Kastner, J. H. 2011, ApJ, 727, 62
- Shkolnik et al. (2011) Shkolnik, E. L., Liu, M. C., Reid, I. N., Dupuy, T., & Weinberger, A. J. 2011, ApJ, 727, 6
- Sicilia-Aguilar et al. (2009) Sicilia-Aguilar, A., et al. 2009, ApJ, 701, 1188
- Siess et al. (2000) Siess, L., Dufour, E., & Forestini, M. 2000, A&A, 358, 593
- Skrutskie et al. (2006) Skrutskie, M. F., et al. 2006, AJ, 131, 1163
- Takeda et al. (2007) Takeda, G., Ford, E. B., Sills, A., Rasio, F. A., Fischer, D. A., & Valenti, J. A. 2007, ApJS, 168, 297
- Tody (1993) Tody, D. 1993, Astronomical Data Analysis Software and Systems II, 52, 173
- Valenti et al. (2003) Valenti, J. A., Fallon, A. A., & Johns-Krull, C. M. 2003, ApJS, 147, 305
- Walter (1999) Walter, F. M. 1999, Solar and Stellar Activity: Similarities and Differences, 158, 87
- Watson et al. (2009) Watson, D. M., et al. 2009, ApJS, 180, 84
- White & Basri (2003) White, R. J., & Basri, G. 2003, ApJ, 582, 1109
- White & Ghez (2001) White, R. J., & Ghez, A. M. 2001, ApJ, 556, 265
- Woitke et al. (2011) Woitke, P., et al. 2011, arXiv:1103.5309
- Yang et al. (2011) Yang, H., Linsky, J. L., & France, K. 2011, ApJ, 730, L10
| Object | Class | Spectral Type | Luminosity | Mass | Radius | Distance | Age |
|---|---|---|---|---|---|---|---|
| pc | Myr | ||||||
| RECX-1 | WTTS | K5–K6 | 1.0 | 0.9 | 1.8 | 97 | 5–9 |
| RECX-11 | CTTS | K5–K6 | 0.6 | 1.0 | 1.4 | 97 | 5–9 |
| HD 154363 | Dwarf | K5 | 0.2 | 0.6 | 0.8 | 11 | 1400 |
| Object | RA | DEC | Telescope/ Instrument | Date of Obs |
|---|---|---|---|---|
| (J2000) | (J2000) | |||
| RECX-1 | 08 36 56.12 | -78 56 45.3 | HST/ COS G130M/G160M | 2010-01-22 |
| HST/ STIS G230L/G430L | 2010-01-22 | |||
| Magellan/ MIKE | 2010-03-10 | |||
| VLT-UT1/ CRIRES | 2011-05-22 | |||
| RECX-11 | 08 47 01.28 | -78 59 34.1 | HST/ COS G130M/G160M | 2009-12-12 |
| HST/ STIS G230L/G430L | 2009-12-12 | |||
| Magellan/ MIKE | 2010-03-10 | |||
| CTIO/ SMARTS RC Spectrograph | 2009-11-26 | |||
| CTIO/ SMARTS RC Spectrograph | 2009-11-27 | |||
| CTIO/ SMARTS RC Spectrograph | 2009-12-15 | |||
| CTIO/ SMARTS RC Spectrograph | 2009-12-19 | |||
| Gemini South/ Phoenix | 2009-12-12 | |||
| VLT-UT1/ CRIRES | 2011-05-22 |