TopicViz: Semantic Navigation of Document Collections
Abstract
When people explore and manage information, they think in terms of topics and themes. However, the software that supports information exploration sees text at only the surface level. In this paper we show how topic modeling – a technique for identifying latent themes across large collections of documents – can support semantic exploration. We present TopicViz, an interactive environment for information exploration. TopicViz combines traditional search and citation-graph functionality with a range of novel interactive visualizations, centered around a force-directed layout that links documents to the latent themes discovered by the topic model. We describe several use scenarios in which TopicViz supports rapid sensemaking on large document collections.
1 Introduction
As information repositories continue to expand and diversify, there is an urgent need for systems that help people explore and make sense of large document collections. While researchers in information-seeking and related areas have developed increasingly effective interaction techniques for navigating document collections [1, 16], these methods are hampered by a view of language that is generally restricted to the surface level; such techniques are oblivious to the semantic meaning behind the text. Meanwhile, researchers in machine learning and natural language processing have developed powerful statistical methods for recovering latent semantics [2], but the output of these methods is difficult to present to both domain expert and novice users alike.
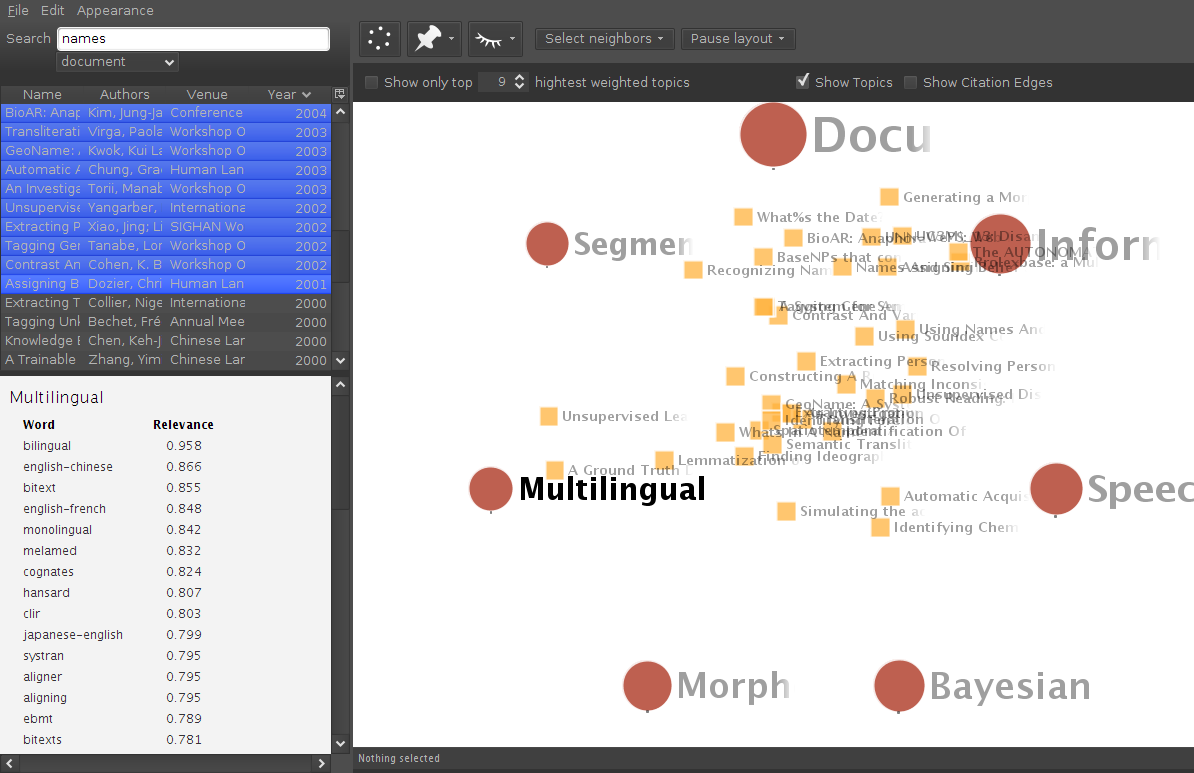
In this paper, we introduce TopicViz, a new tool for searching and navigating large document collections (Figure 1). TopicViz infers a set of topics that summarize the latent high-level semantic organization of a collection, and provides a novel interactive view that exposes this semantic organization using a force-directed layout. This layout permits a range of interactive affordances, allowing users to gradually refine their understanding of the search results and citations links, while focusing in on key semantic distinctions of interest.
The analytic engine of our approach is the topic model – a powerful statistical technique for identifying latent themes in a document collection [2]. Without any annotation, topic models can extract topics – sets of semantically-related words – and describe each document as a mixture of these topics. For example, a given research paper might be characterized as 70% human-computer interaction, and 30% machine learning.111This distinguishes topic models from more coarse-grained techniques that treat each document as a member of a single cluster [7]. Topic models have been successfully applied to a broad range of text, and the extracted topics have been shown to cohere with readers’ semantic judgments [4]. But while topic models are often motivated as a technique to support information seeking, there has been little investigation of how users can understand and exploit them.
One of the principle strengths of topic models is their flexibility: topics need not correspond to any predefined taxonomy, but rather represent the latent structure inherent to the document collection. However, this means that the content of each topic must somehow be conveyed to the user. In topic modeling research, this issue is almost invariably addressed by showing ranked lists of words and documents that are closely associated with each topic. But such lists have undesirable properties: it is difficult to show more than a few entries per topic, the meaning of individual terms may be unknown to non-experts;222For example, “muc”, “muc-6” and “muc-7” are three of the four most relevant terms for one of the topics learned by our model. These terms are well-known to experts in natural language processing (they are the names of shared research tasks), but are incomprehensible to an outsider. in addition, the numerical scores for each word and topic are hard to interpret.
While hundreds of papers address the mathematical methodology of topic modeling, relatively few take up the question of how topic models can support information exploration. Our approach is distinguished from prior work in its emphasis on interaction: the user is empowered to manipulate the visualization by adding, rearranging or removing topics, and by controlling the set of documents to visualize. The motivation for this design stems from our focus on local information exploration: we aim to provide a deep understanding of a local area of the information landscape that is relevant to the user’s goals, rather than a surface-level static view of thousands of documents. We provide affordances for users to quickly focus in on the topical distinctions that are relate to their goals, allowing them to interactively manipulate topics within this space to better understand document-document, document-topic, and topic-topic relationships.
2 Background
Topic models of document collections
A topic model is a hierarchical probabilistic model of document content [2]. Each topic is a probability distribution over words, ; every word in every document is assumed to be randomly generated from one topic. In a given document the proportion of words generated from each topic is given by a latent vector . Thus, the matrix provides a succinct summary of the semantics of each document.
Both the topics and the document descriptions can be obtained through offline statistical inference [2, 10], without any need for manual annotation. Thus, topics need not correspond to any predefined categories; indeed, this is why they are useful for exploratory analysis. In the research literature, topic models are often displayed through textual tables showing the most relevant words and documents for each topic, as in Figure 2.
| “Morphology” | “Multilingual” | “Parsing” |
|---|---|---|
| morphemes | bilingual | nonterminal |
| morpheme | english-chinese | nonterminals |
| affixes | bitext | adjoining |
| affix | english-french | cfgs |
| kanji | monolingual | cfg |
| endings | melamed | subtree |
| inflections | cognates | non-terminal |
| suffixes | hansard | subtrees |
| inflectional | japanese-english | adjunction |
| katakana | systran | non-terminals |
In typical scenarios, the number of topics ranges from 10-200, and the number of documents can range from a few hundred to hundreds of thousands. The number of topics can be determined automatically [20], or set in advance through interactive exploration by a domain expert. Note that TopicViz is not currently designed to support the user in training new topic models or exploring alternative topic model parametrizations. Rather, we target the case where a topic model is trained in advance, to be used by many novices who are interested in a given domain, such as legal documents or research literature. We consider the problem of supporting end users to train new topic models to be an important area of future work.
Visualizing large document collections
Most prior work on visualizing large document collections can be divided into two high-level streams: citation graphs and static projection. In citation graph approaches, each document is a node, and edges are used to represent citation links; clustering is then performed over the resulting graph [19, 3]. The clusters are displayed using techniques such as triangulation [19] or force-directed layout [3]. Such approaches are well-suited to discover connected disciplines in science at a high-level, but do not consider the textual content of individual documents.
Projection-based methods apply topic models [12, 9, 21] or related techniques like Latent Semantic Analysis [14]. The high-dimensional document descriptions ( in our notation from earlier in this section) are then projected into two-dimensional coordinates for visualization (Landauer et al. user color as an additional dimension [14]). A related, recent approach to use visualize topic models is the work of Liu et al., who emphasize the temporal dimension by placing it on the the X-axis of a graph that shows the evolution of topic strength and content over time [15].
We differ from this prior work in our emphasis on document search and interactive sensemaking [8, 13]. Rather than viewing the entire collection and topic model in a single static view, the user manipulates an ever-shifting subset of documents and topics. This approach is driven by the intuition – dating back to early work on Scatter/Gather [7] – that only a small corner of the topic space will be relevant for any given information search. We allow documents to be easily added and removed from the view, either through additional search queries or by exploring citation links; similarly, topics can be moved and manipulated to reveal subtle semantic distinctions. The remainder of the paper describes these affordances in greater detail.
3 Scenarios
The key idea behind TopicViz is to integrate a force-directed layout for topic models with an integrated environment for expanding and refining a document list. As in conventional document search, the entrance point is the search query; however, rather than simply listing the search results, they are visualized in an interactive force-directed layout with a range of affordances. As these capabilities are best described by example, this section is centered around a detailed novice user scenario and two briefer expert scenarios.333Video of many of these affordances can be found at http://www.cs.cmu.edu/~dchau/topicviz/topicviz.mp4. The mechanisms underlying TopicViz are described in detail in the following section.
3.1 Novice scenario
Consider an individual given the task of searching an unfamiliar research literature, with the goal of identifying whether a particular technology can be applied to a commercial problem. In our scenario, the individual is tasked with determining whether it is possible to automatically identify names on foreign language websites, using a collection of 15,032 research papers on computational linguistics [18].
The user begins by devising a query; with current tools like Google Scholar and Lexis Nexis, the response to the query would be an ordered list of results. Only some of the resulting documents will be relevant, and almost surely there will be relevant documents that do not match the query. The user may then vary the search terms or navigate the citation links to try to get a complete sense of the research literature in this unfamiliar area.
Now consider the same task, performed with TopicViz. The first step is the same: the user supplies a search query. The results are shown in a list (the top-left part of Figure 1). The user then drags as many documents as desired into the main area, which is called the Topic Field: each document is displayed as a node, and these nodes are surrounded by a ring of topic centers. The topic centers are “pinned,” while the position of each document is set by a force-directed layout in which the topics each exert an attractive force proportional to the document’s topical relevance. Thus, documents with similar content will be located near each other.
The size of each topic center is determined by its relevance to the documents in the field, and only the most relevant topics are shown. The panel on the lower-left shows the most relevant words for each topic (selected by mouseover). The user can also see the relevance of each topic to the documents in the field both statically (by the document’s position) and dynamically (by dragging the topic center around to see how the document nodes are affected). The topic names are specified in advance, either manually by a domain expert, or through automatic methods [17]; the user is free to rename topics with more familiar terms.
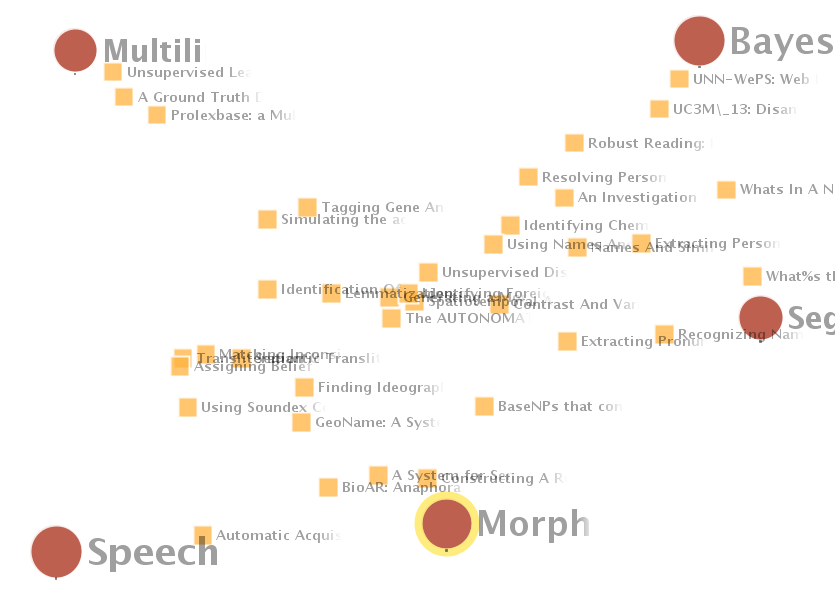
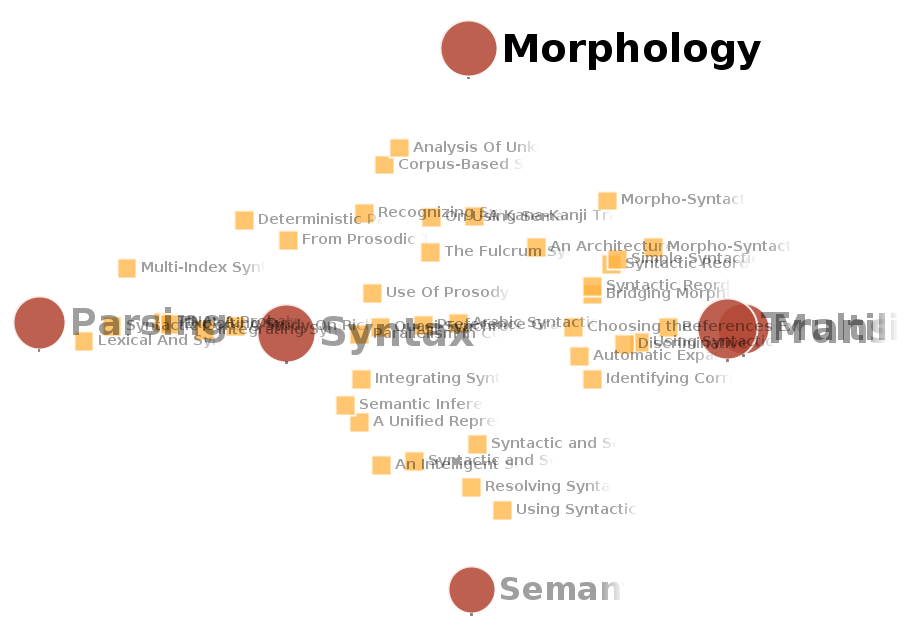
In our scenario, the user recognizes the topic multilingual as especially relevant to the search – but other topics like morphology and Bayesian are not familiar. To better understand if these topics are relevant, the user rearranges the topics, with multilingual in the upper-left corner and the unfamiliar topics in an arc across the screen (Figure 3). From this view, the user sees that morphology is related to multilingual, as several documents have strong connections with both topics.
The user inspects the set of terms associated with the topic morphology (Figure 2). While terms like “morpheme” and “inflection” are confusing, the user recognizes the terms “affix” and “suffix” as referring to parts of individual words. Based on this insight, the user renames the topic from morphology to subwords. While this name is not typically used in the research literature, it helps the user relate the topic model to her pre-existing ontology.
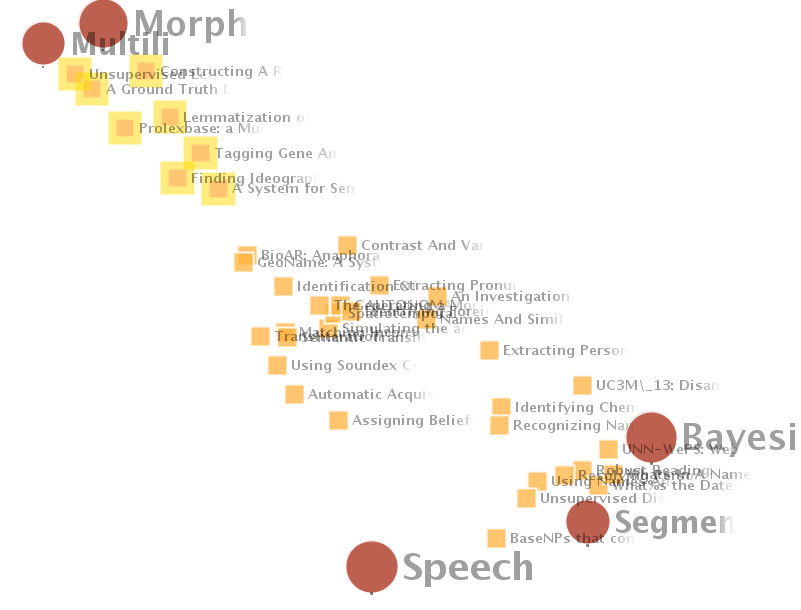
Having identified morphology and multilingual as key topics of interest, the user again rearranges the topics, placing the relevant topics in one corner of the screen and the others in another corner. This causes the document nodes to form a line, with location governed by relevance to the topics of the interest (Figure 4). The user now removes documents that are not close to the desired topics by selecting and deleting their nodes.
The user has now culled the original list of query hits to a set of documents that are closely related to multiple topics of interest. But the coverage of this document set depends on the quality of the original query. To make sure that important documents have not been missed, the user selects a subset of particularly promising documents and adds documents that cite them. These new documents may not match the search query by name, but may still be relevant. The user can now investigate the topical characteristics of these new documents and further refine the search.
Ultimately, the user arrives at a set of documents that reflect the underlying semantics of the information search. By investigating the topic structure, the user has pruned away “false positives” that match the query but are in fact irrelevant; by walking the citation graph, the user has identified “false negatives” that are relevant but did not match the original query. Morever, by interatively exploring the documents, topics, and terms that relate to the initial query, the user acquires a deeper, structured understanding of the relevant area of the document collection. This elucidates the specific role played by each document in the relevant research literature, and contextualizes previously unknown themes, such as the topic morphology. The user is now prepared to summarize the desired content, having obtained both a comprehensive, high-precision list of documents and a clearer understanding of this area of research.
3.2 Expert scenarios
Determining author expertise
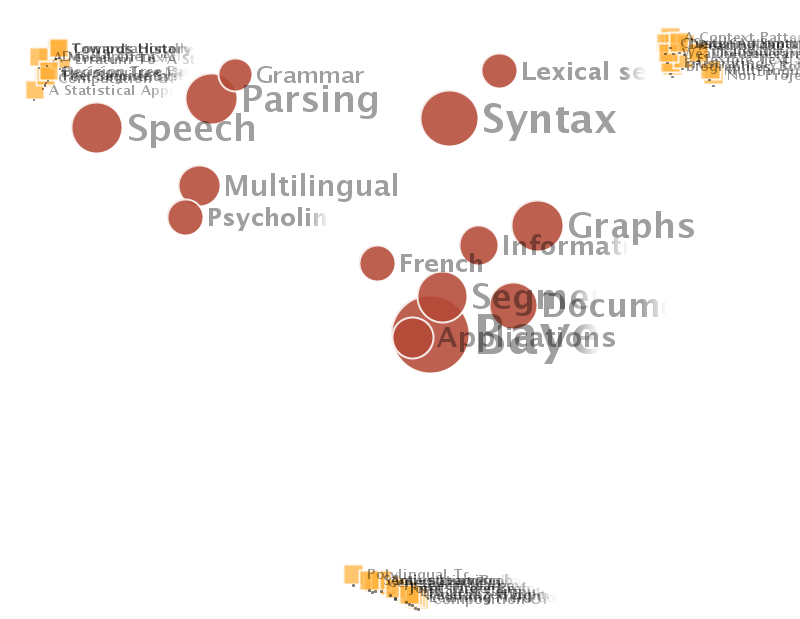
We briefly consider a scenario involving a user who has more expertise in the domain of the document collection. Here, the expert wants to identify the topical interests of several authors – perhaps to distinguish the specific contributions of multiple authors on a single paper. To do this, the user searches for papers by each author and drags them into the field. However, unlike the previous view, the documents are pinned in place, and the topics float between them (such non-default behavior can be easily set using the toolbar at the topic of the window). The edges in the force-directed layout are bidirectional, and work identically in this setting; the user need only pin sets of documents for each author, and then add relevant topics to the view. Figure 5 shows such a view for the relationship between the three authors of a heavily-cited paper in computational linguistics; this view reveals that the author to the upper-left has focused more on the speech topic; the author to the upper-right has focused more on syntax and lexical semantics; and the author on the bottom has focused more on the Bayesian and applications topics.
Direct manipulation 2D projections
Finally, we consider a scenario in which an expert user has a detailed understanding of the topic model, and wants to select a set of documents that fit a very specific semantic profile. The novice scenario explored an affordance in which documents were arranged on a spectrum between two topics (Figure 4). In fact, much more expressive arrangements are possible, yielding a direct-manipulation inferface for creating two-dimensional projections.
Suppose that the expert user wants documents that describe multilingual analysis and translation, but avoid syntax and parsing; in fact, let us suppose that parsing is completely inappropriate due to technical constraints. The user can arrange the topic centers on a line, with parsing to the far left and syntax slightly left of center, while locating the multilingual and translation topics to the far right. Such a configuration can be viewed as a one-dimensional projection that assigns a large negative weight to parsing, a smaller negative weight to syntax, and a equal positive weights to multilingual and translation. Next, the user wants to distinguish documents that focus on morphology from those that focus on semantics – this time using the Y-axis. The final configuration is shown in Figure 6. The user can now select the documents in the desired subspace for further viewing and refinement, as described in the novice scenario.
Overall, we see that in two dimensions, the location of each topic center defines a projection matrix that reduces the high-dimensional topic proportion vector to an easily viewable two dimensional representation. By dragging topics further from the center, their absolute weight is increased, causing them to exert a greater influence on the position of each document. Thus, TopicViz offers an intuitive direct manipulation interface for designing projections that isolate the desired region of topic space.
4 The TopicViz System
We now describe in more detail the mechanisms and affordances underlying the TopicViz system. The core idea of TopicViz is to provide affordances for interactively exploring the topical affiliations of a set of documents, while facilitating refinement and expansions of the document set. Thus, the main entry point is the search query, which will be familiar to users from traditional information search interfaces. However, from this point, we diverge from prior approaches, emphasizing the direct manipulation design of novel 2D projections and interactive exploration of document-topic and topic-topic relationships. The previous section described the envisioned use cases for such interactions; we now describe the underlying mechanisms.
4.1 Document positioning
As described in Section 2, a topic model is defined by the topic-term relations and the topic-document relations. Both objects are high-dimensional: the topic-term matrix contains a row for each topic, and a column for each word in the vocabulary; the topic-document matrix contains a row for each document and a column for each topic. The number of documents and vocabulary size are each typically in the thousands;444In the scenario, the number of topics is 25; the vocabulary size is 18,743 (after pruning infrequent words) the number of documents is 15,032., and the numerical values are not intuitively meaningful on their own; rather, the structure of the topic model is best understood in a relational setting. Thus, we present a document field view incorporating topics and documents.
In the document field, we see the relationship between documents and topics. Inspired by “dust-and-magnet” approaches to information visualization, (e.g., [22]), we initially arrange a ring of topic nodes around the outside of the field, which act as magnets. Documents are represented as nodes within this field; edge weights are based on Hooke’s law, with as the force of the spring between topic and document . A document that is a near 100% match for a given topic will be placed almost directly on that topic’s magnet; a document that is a 50% match for each of two topics will be positioned halfway between them. Thus, documents that have similar topic proportions are located near each other, reflecting semantic differences directly in the spatial layout. Visualizing such a high-dimensional model in 2D inevitably causes information to be lost, but the force-directed layout permits interactive manipulation of document nodes, allowing users to more closely examine regions of particular interest.
4.2 Document set refinement
As the number of documents in a collection is typically in the thousands, it is not helpful to view all of the documents at the same time. Our interface includes two affordances for selecting sets of documents to visualize. The first affordance – which is the entry point to interaction with our system – is the search query. Just as in traditional search interfaces, the user enters a query and receives a list of results (in a separate panel). These results can be sorted by traditional metadata: titles, author, year, and venue. The user can then drag documents into the document field, which provides an intuitive graphical visualization of the semantic structure of the search results. The second affordance permits the user to walk to the citation graph, adding citing or cited documents for any set of documents already in the view; the citation links are made visible.
By default, the set of topic magnets is dynamically updated to show the topics that are most relevant to the documents currently in the field. This feature can be turned off, allowing topics to be added and deleted manually.
4.3 Implementation
TopicViz is implemented through Shiftr [5], a Java platform designed to support interactive exploration and querying of large graph data with millions of nodes and edges. Shiftr builds on the Prefuse library for force-directed layouts [11], providing a collection of fundamental operations over graph data: querying nodes by arbitrary node attributes; visualizing user-specified subgraphs; and flexible spatial arrangement for nodes through pinning and unpinning. TopicViz uses these lower-level operations to provide a force-directed layout interface for exploring topic models of document content.
5 Future work
A key target for future work is empirical validation. Indeed, beyond the necessary task of evaluating the specific design decisions taken in TopicViz, we also believe that this tool can serve as a platform for in situ user studies of whether and how topic models can best support document set exploration and sensemaking. Specifically, we plan to develop a battery of information-exploration tasks (similar to the email exploration tasks of Liu et al. [15]) and compare the efficacy of TopicViz with traditional search interfaces, as well as textual and table-based representations of topic models.
From a visualization standpoint, we see several intriguing directions for future work. While TopicViz offers an innovative take on the document-topic relationship, the connection between topics and terms is still expressed through traditional term lists. We plan to explore whether a more spatial visualization for this relationship would be possible, or whether an alternative approach such as DocuBurst [6] could be incorporated in the TopicViz environment. We also believe that an integrated presentation of document metadata such as time, authorship, and venue would substantially improve the practical usability of the system. Finally, we are eager to investigate the use of color as a third dimension, either to visualize such metadata, or to enable gestalt high-level comparisons between document sets [14].
6 Summary
Topic models can give powerful insights on document collections – but only if used in combination with a comprehensible presentation and an interaction design built around the information exploration process. TopicViz presents an interactive visualization that places topic models in the context of a search interface, filling the same role currently played by keyword search. We see two main advantages of our approach: it accounts for latent document semantics, and provides an interactive spatial visualization that allows the user to rapidly focus on key areas of interest.
Acknowledgments
This work was supported by the following grants: AFOSR FA9550010247, ONR N0001140910758, NSF OCI-0943148, NSF IIS-0968484, NSF IIS-0713379, NSF CAREER DBI-0546594, and an Alfred P. Sloan Fellowship.
References
- [1] M. Baldonado and T. Winograd. SenseMaker: an information-exploration interface supporting the contextual evolution of a user’s interests. In Proceedings of CHI, pages 11–18, 1997.
- [2] D. M. Blei, A. Y. Ng, and M. I. Jordan. Latent Dirichlet allocation. Journal of Machine Learning Research, 3:993–1022, 2003.
- [3] K. W. Boyack, R. Klavans, and K. Börner. Mapping the backbone of science. Scientometrics, 64(3):351–374, 2005.
- [4] J. Chang, J. Boyd-Graber, S. Gerrish, C. Wang, and D. M. Blei. Reading tea leaves: How humans intepret topic models. In NIPS, 2009.
- [5] D. H. Chau, A. Kittur, C. Faloutsos, and J. I. Hong. Shiftr: a user-directed, link-based system for ad hoc sensemaking of large heterogeneous data collections. In Proceedings of CHI, pages 3535–3536, 2009.
- [6] C. Collins, S. Carpendale, and G. Penn. Docuburst: Visualizing document content using language structure. Computer Graphics Forum, 28(3):1039–1046, 2009.
- [7] D. Cutting, D. Karger, J. Pedersen, and J. Tukey. Scatter/gather: A cluster-based approach to browsing large document collections. In Proceedings of SIGIR, pages 318–329, 1992.
- [8] B. Dervin. An overview of sense-making research: concepts, methods, and results to date. In Annual Meeting of the International Communication Association, 1983.
- [9] H. et al. The NIH visual browser: An interactive visualization of biomedical research. In Proceedings of IEEE Conference on Information Visualisation, 2009.
- [10] T. Griffiths and M. Steyvers. Finding scientific topics, 2004.
- [11] J. Heer, S. K. Card, and J. A. Landay. prefuse: a toolkit for interactive information visualization. In Proceedings of CHI, pages 421–430, 2005.
- [12] T. Iwata, T. Yamada, and N. Ueda. Probabilistic latent semantic visualization: Topic model for visualizing documents. In Proceedings of KDD, 2008.
- [13] C. C. Kuhlthau. Inside the search process: Information seeking from the user’s perspective. Journal of the American Society for Information Science, 42:361–371, 1991.
- [14] T. K. Landauer, D. Laham, and M. Derr. From paragraph to graph: Latent semantic analysis for information visualization. PNAS, 101:5214–5219, April 2004.
- [15] S. Liu, M. X. Zhou, S. Pan, W. Qian, W. Cai, and X. Lian. Interactive, topic-based visual text summarization and analysis. In Proceedings of CIKM, pages 543–552, 2009.
- [16] G. Marchionini. Exploratory search: from finding to understanding. Communications of the ACM, 49(4):46, 2006.
- [17] Q. Mei, X. Shen, and C. Zhai. Automatic labeling of multinomial topic models. In Proceedings of KDD, pages 490–499, 2007.
- [18] D. R. Radev, P. Muthukrishnan, and V. Qazvinian. The ACL anthology network corpus. In Workshop on Text and Citation Analysis for Scholarly Digital Libraries, pages 54–61, 2009.
- [19] H. Small. Visualizing science by citation mapping. Journal of the American Society for Information Science, 50(9):799–813, 1999.
- [20] Y. Teh, M. Jordan, M. Beal, and D. Blei. Hierarchical dirichlet processes. Journal of the American Statistical Association, 101(576):1566–1581, 2006.
- [21] L. van der Maaten and G. Hinton. Visualizing high-dimensional data using t-sne. Journal of Machine Learning Research, 9:2579–2605, 2008.
- [22] J. S. Yi, R. Melton, J. Stasko, and J. A. Jacko. Dust & magnet: multivariate information visualization using a magnet metaphor. Information Visualization, 4:239–256, 2005.