A Reverberation Lag for the High-Ionization Component of the Broad Line Region in the Narrow-Line Seyfert 1 Mrk 335
Abstract
We present the first results from a detailed analysis of photometric and spectrophotometric data on the narrow-line Seyfert 1 galaxy Mrk 335, collected over a 120-day span in the fall of 2010. From these data we measure the lag in the He ii broad emission line relative to the optical continuum to be 2.7 0.6 days and the lag in the H broad emission line to be 13.9 0.9 days. Combined with the line width, the He ii lag yields a black hole mass, = (). This measurement is consistent with measurements made using the H line, suggesting that the He ii emission originates in the same structure as H, but at a much smaller radius. This constitutes the first robust lag measurement for a high-ionization line in a narrow-line Seyfert 1 galaxy and supports a scenario in which the He ii emission originates from gas in virial motion rather than outflow.
1 INTRODUCTION
Narrow-line Seyfert 1 galaxies (NLS1s) are a subset of active galactic nuclei (AGNs) that show narrower broad emission-line components than typical Type 1 AGNs, as well as a number of other distinguishing properties (Osterbrock & Pogge 1985, Goodrich 1989, Boller et al. 1996). Explanations for their unique characteristics include the possibility that they are either low-inclination or high-Eddington rate accreters (or both – see Boroson 2011). Substantial blue enhancements in high ionization lines such as C iv1549 and He ii1640 are apparently typical of, although not restricted to, NLS1 galaxies (e.g., Richards et al. 2002, Sulentic et al. 2000). This may be evidence for material in a disk wind (Richards et al. 2011, Leighly & Moore 2004). If the blue enhancement is due to a wind, the use of high ionization emission lines to measure virial black hole masses () in these objects may be problematic, as the method relies on the assumption that the emitting gas is in virial motion around the black hole.
To investigate the structure in this region, we turn to reverberation mapping (Blandford & McKee 1982, Peterson 1993). This method has been extensively used to measure the physical size of the broad line region (BLR) in Type 1 AGNs, including NLS1s. Reverberation mapping relies on the correlation between variations of the AGN continuum emission and the subsequent response of the broad emission lines that are seen in Type 1 AGNs. By monitoring AGN spectra over a period of time, one can measure the radius of the emitting gas from the central source by observing a time delay between variations in the continuum and emission line fluxes. Assuming the gas is in virial motion, this radius can be combined with BLR gas velocity dispersion estimates to obtain a measurement of . To date, this method has been applied to measure BLR radii in nearly 50 AGNs (e.g., Peterson et al. 2004, Denney et al. 2010, Bentz et al. 2010).
If broad high-ionization lines like He ii are emitted from virialized gas near the black hole, we expect much shorter reverberation time lags for He ii than for low ionization lines like H because both ionization stratification and the line width require this gas to be much closer to the central source. Peterson et al. (2000) investigated the NLS1 NGC 4051 and detected very broad, blue-enhanced He ii emission in the RMS spectrum. Unfortunately, their time resolution was inadequate to reliably measure a He ii lag. Denney et al. (2009) measured an improved H lag for NGC 4051 using data from their 2007 campaign, but were similarly unable to recover a He ii lag. Bentz et al. (2010) report marginal detections of He ii lags in two NLS1 galaxies observed in their 2008 observing campaign. These recent studies achieved similar high sampling rates, but the expected He ii lags for these targets are too short for a robust detection in these datasets. We have therefore been unable to test whether this emission originates in outflowing gas or is in virial motion.
We included the NLS1 galaxy Mrk 335 in a recent reverberation mapping campaign that will be described in detail elsewhere (Grier et al., in preparation). One goal of this high sampling rate program was to measure the reverberation lag for a high-ionization line, He ii , in this source. Here we present the He ii results, having obtained a high enough sampling rate to measure its short time delay, and show that the estimate from the high ionization He ii line agrees with those from low ionization lines.
2 OBSERVATIONS
In general, we follow the observational and analysis practices of Denney et al. (2010), which largely follows the analysis described by Peterson et al. (2004). Details on observations and subsequent analysis techniques will be discussed in the accompanying work by Grier et al.
2.1 Spectroscopy
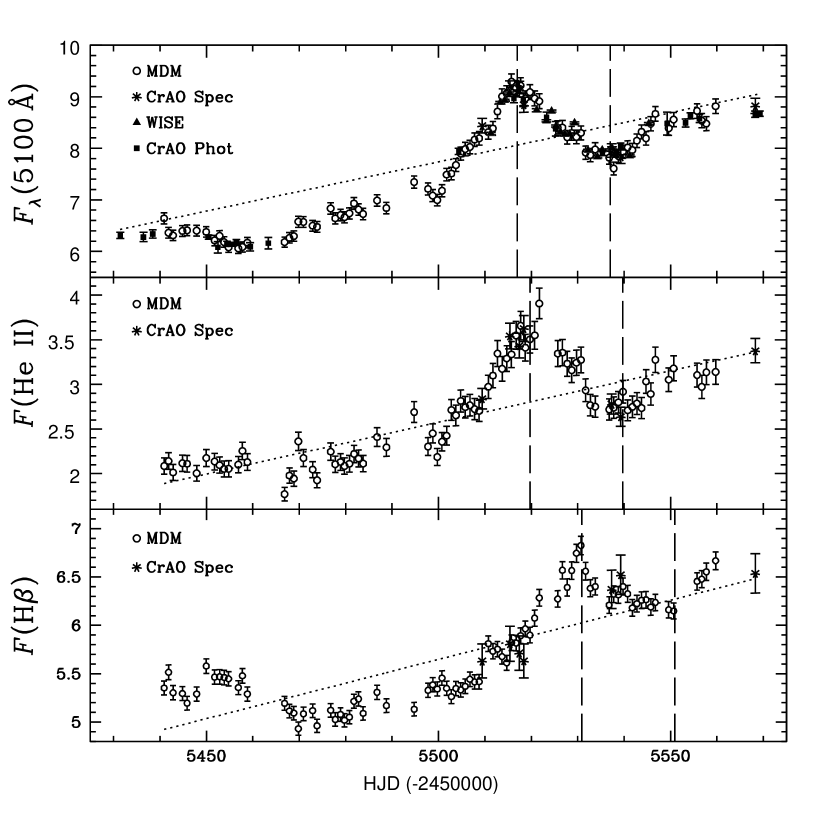
The majority of the spectra were obtained using the 1.3m McGraw-Hill telescope at MDM Observatory. We used the Boller and Chivens CCD spectrograph to obtain 82 spectra over the course of 120 nights from 2010 Aug 31 to Dec 28. We used the 350 mm-1 grating to obtain a dispersion of 1.33 Å pixel-1, with a central wavelength of 5150 Å and overall spectral coverage from roughly 4400 Å to 5850 Å. The slit was oriented north-south and set to a width of and we used an extraction window of , which resulted in a spectral resolution of 7.9 Å. Figure 1 shows the mean and root mean square (RMS) spectra of Mrk 335 from the MDM spectra.
We also obtained 7 spectra with the Nasmith spectrograph and SPEC-10 CCD at the 2.6m Shajn telescope at the Crimean Astrophysical Observatory (CrAO). We used a slit at a position angle of 90∘. Spectral coverage was from approximately 3900 Å to 6100 Å.
2.2 Photometry
We collected 25 epochs of -band photometry from the 70-cm telescope at CrAO using the AP7p CCD at prime focus, covering a 15′15′ field of view. The flux was measured within an aperture of . See Sergeev et al. (2005) for more details.
We also obtained 19 epochs of -band photometry at the Wise Observatory of Tel-Aviv University using the Centurion 18-inch telescope with a 3072 2048 STL-6303E CCD and a field of view of 75′50′. For these data, we used the ISIS image subtraction package rather than aperture photometry to measure fluxes (Alard & Lupton 1998; Alard 2000) following the procedure of Shappee & Stanek (2011).
3 LIGHT CURVES AND TIME SERIES ANALYSIS
3.1 Light Curves
The reduced spectra were flux-calibrated assuming that the [O iii] emission line flux is constant (see Denney et al. 2010 for details on data processing). Emission-line light curves were created for both the MDM and CrAO data sets by fitting linear continua underneath the H and He ii lines and integrating the flux above them. H fluxes were measured between 4910–5100 Å in the observed frame, with the continuum interpolation defined by the regions 4895–4910 and 5215–5240 Å. He ii fluxes were measured from 4660–4895 Å, with the continuum defined from 4550–4575 and 4895–4910 Å. The CrAO light curves were then scaled to the MDM light curve to account for the different amounts of [O iii] light that enters the slits due to differences in seeing, slit orientation, and aperture size.
The continuum light curve was created by taking the average 5100 Å continuum flux of the MDM spectra, measured between 5215-5240 Å in the observed frame. This light curve was then scaled and merged with the other continuum and photometric light curves with corrections for the host galaxy starlight in the different apertures (see Peterson et al. 1995). The final continuum and emission-line light curves are shown in Figure 2. Light curve statistics are given in Table 1.
3.2 Time delay measurements
For comparison with previous results, we used the interpolation method originally described by Gaskell & Sparke (1986) and Gaskell & Peterson (1987) which was later modified by White & Peterson (1994) and Peterson et al. (1998, 2004) to measure the time lag. We cross-correlated the two light curves with one another, calculating the value of the cross correlation coefficient at each value of time lag. Figure 3 shows the resulting cross correlation functions (CCFs) for the light curves. Uncertainties in lags are calculated using Monte Carlo simulations that employ the methods of Peterson et al. (1998) and refined by Peterson et al. (2004). For each realization, we measure the location of the peak value of the cross correlation coefficient (), and the centroid of the CCF (), calculated using points surrounding the peak. We adopt the mean and from the Monte Carlo realizations for our delay measurements and the standard deviation as our formal uncertainties. Before the light curves were cross correlated, we removed the long-term linear upward trend that is clearly visible in all three light curves (see Figure 2). Welsh (1999) discusses the value in this practice of “detrending” the light curves, as the cross correlation function (CCF) tends to latch onto long-term trends unassociated with reverberation, often resulting in incorrect lags. From our cross correlation analysis, we measure (H) = 13.9 0.9 days and (He ii) = 2.7 0.6 days. All lag measurements are listed in Table 2.
Previous reverberation studies have relied on these fairly simple cross correlation methods to measure . Recently, however, Zu et al. (2011) discussed an alternative method of measuring reverberation time lags called the Stochastic Process Estimation for AGN Reverberation (SPEAR) and demonstrated its ability to recover accurate time lags. The basic idea is to assume all emission-line light curves are scaled and shifted versions of the continuum light curve. One then fits the light curves using a damped random walk model (e.g. Kelly et al. 2009, Kozłowski et al. 2010, MacLeod et al. 2010) and then aligns them to determine the time lag. Uncertainties in lags are computed using a Markov Chain Monte Carlo method (see Zu et al. 2011). SPEAR is remarkably good at predicting time lags in data sets with relatively large gaps in the sampling. Using SPEAR, we successfully recover time lags for both the H and He ii emission lines. We allowed SPEAR to automatically remove the linear trend and include any resulting uncertainties in the overall lag uncertainties. We measure (H) = 14.0 0.3 days and (He ii) = days, also reported in Table 2. We see good agreement with the CCF results from the H emission line, and while there is a small difference between SPEAR and CCF lags for the He ii line, they are still statistically consistent with one another. We suspect this small difference is due to the gap in data that is very close to the peak in the He ii light curve. We adopt the CCF values for our mass calcuations to allow comparison with previous reverberation efforts.
3.3 Line width measurement and calculations
Assuming that the motion of the H-emitting gas is dominated by gravity, the relation between , line width, and time delay is
| (1) |
where is the measured emission-line time delay, is the velocity dispersion of the BLR, and is a dimensionless factor that accounts for the structure within the BLR. The BLR velocity dispersion can be estimated using the line width of the measured broad emission line in question. This width is usually characterized by either the FWHM or the line dispersion, . We use because there is evidence that it produces less biased measurements (Peterson 2011). We measure the line width in the RMS spectrum, which eliminates contributions from the contaminating narrow components. We adopt an average value of based on the assumption that AGNs follow the same – relationship as quiescent galaxies (Onken et al. 2004). This is consistent with Woo et al. (2010) and allows easy comparison with previous results, but is about a factor of two larger than the value of computed by Graham et al. (2011).
To determine the best value of , we use Monte Carlo simulations following Peterson et al. (2004). The resulting line widths are given in Table 2. Using our measured values of for the average time lag and from the RMS spectrum as , we compute using both the H and He ii emission lines. We measure = () using the H emission line and = () using He ii.
4 DISCUSSION
As discussed above, several studies involving NLS1 galaxies have found indications of outflows in high-ionization lines in the form of enhanced flux on the blue side of the emission lines. Inspection of Mrk 335 spectra from the archive shows this enhanced blueward flux is present in the C iv1549 line as well, but the He ii1640 line is blended with C iv, so we cannot see if it too exhibits this blue enhancement. In fact, the shape of the He ii emission line in the RMS spectrum of Mrk 335 (Figure 1) shows red and blue shoulders that could be a signature of disk structure. To search for possible outflow signatures in the He ii emission line, we divided it into red and blue components and integrated each component separately, creating two He ii light curves. We then cross-correlated the red and blue light curves with one another to see if there is any time delay between the two components. Cross correlation analysis yields a centroid lag = 0.4 0.8 days. This is consistent with zero and thus presents no evidence for bulk outflows in the He ii emission of Mrk 335. The consistency of the measurements made using the He ii lines with those from H are also suggestive of virial motion rather than outflowing gas.
Previous reverberation measurements of Mrk 335 were made by Kassebaum et al. (1997) and Peterson et al. (1998) and subsequently reanalyzed by Peterson et al. (2004) and Zu et al. (2011). Zu et al. (2011) report a time delay of 15.3 days and 920 km s-1 for H, but were unable to make a robust He ii measurement, as their average time sampling was on the order of 10 days. Peterson et al. (2004) measure = () from the H emission line. Our measurements deviate from theirs by almost a factor of two. We suspect the difference in is due to the difference in the line width measurements between the two campaigns. The uncertainties in line width measurements and in the factor are the main sources of uncertainties in reverberation measurements – when the light curves are well-sampled, the lag measurements themselves have been shown to be remarkably robust (e.g. Watson et al. 2011). Peterson et al. (2004) (Table 6) find that the virial products computed for an object using data from different epochs often differ from one another by as much as a factor of two (e.g. NGC 5548) and that the typical fractional error in the virial products is about 33%. Given our uncertainties in the factor and the limitations in trying to accurately describe the BLR velocity field with a single line-width characterization, we probably cannot actually do better than about a factor of two or three in individual measurements.
Ground-based reverberation campaigns in the past have been limited to objects with H time lags that are expected to be less than a month or two due to both the finite length of the campaigns (which typically last 50–100 days) and the fact that most objects are only observable from the ground for only about half of the year. Measurement of longer time lags would require extended campaigns, which are difficult to schedule. If, as our evidence suggests, the He ii emission line is in virial motion around the black hole, we can use this emission line to measure in objects at higher redshifts, as expected He ii lags in many of these high-luminosity objects are short enough to measure in one observing season.
5 SUMMARY
We have presented the first robust He ii reverberation lag measurement in a NLS1 galaxy. We also measure the H time lag in this galaxy and compute using both emission lines. The measurements from He ii and H are consistent with one another, suggesting that the gas producing the He ii emission resides in the same structure as that producing H emission. While other high-ionization lines such as C iv show evidence for outflows, we do not see this in He ii, possibly because the He ii-emitting gas does not arise cospatially with gas producing C iv emission. This has practical implications for future reverberation efforts, as the He ii emission may allow us to more efficiently measure in objects at high redshift.
References
- Alard (2000) Alard, C. 2000, A&AS, 144, 363
- Alard & Lupton (1998) Alard, C., & Lupton, R. H. 1998, ApJ, 503, 325
- Bentz et al. (2010) Bentz, M. C., et al. 2010, ApJ, 716, 993
- Blandford & McKee (1982) Blandford, R. D., & McKee, C. F. 1982, ApJ, 255, 419
- Boller et al. (1996) Boller, T., Brandt, W. N., & Fink, H. 1996, A&A, 305, 53
- Boroson (2011) Boroson, T. A. 2011, in Narrow-Line Seyfert 1 Galaxies and their Place in the Universe
- Denney et al. (2009) Denney, K. D., et al. 2009, ApJ, 702, 1353
- Denney et al. (2010) —. 2010, ApJ, 721, 715
- Gaskell & Peterson (1987) Gaskell, C. M., & Peterson, B. M. 1987, ApJS, 65, 1
- Gaskell & Sparke (1986) Gaskell, C. M., & Sparke, L. S. 1986, ApJ, 305, 175
- Goodrich (1989) Goodrich, R. W. 1989, ApJ, 342, 224
- Graham et al. (2011) Graham, A. W., Onken, C. A., Athanassoula, E., & Combes, F. 2011, MNRAS, 412, 2211
- Kassebaum et al. (1997) Kassebaum, T. M., Peterson, B. M., Wanders, I., Pogge, R. W., Bertram, R., & Wagner, R. M. 1997, ApJ, 475, 106
- Kelly et al. (2009) Kelly, B. C., Bechtold, J., & Siemiginowska, A. 2009, ApJ, 698, 895
- Kozłowski et al. (2010) Kozłowski, S., et al. 2010, ApJ, 708, 927
- Leighly & Moore (2004) Leighly, K. M., & Moore, J. R. 2004, ApJ, 611, 107
- MacLeod et al. (2010) MacLeod, C. L., et al. 2010, ApJ, 721, 1014
- Onken et al. (2004) Onken, C. A., Ferrarese, L., Merritt, D., Peterson, B. M., Pogge, R. W., Vestergaard, M., & Wandel, A. 2004, ApJ, 615, 645
- Osterbrock & Pogge (1985) Osterbrock, D. E., & Pogge, R. W. 1985, ApJ, 297, 166
- Peterson (1993) Peterson, B. M. 1993, PASP, 105, 247
- Peterson (2011) Peterson, B. M. 2011, in Narrow-Line Seyfert 1 Galaxies and their Place in the Universe
- Peterson et al. (1995) Peterson, B. M., Pogge, R. W., Wanders, I., Smith, S. M., & Romanishin, W. 1995, PASP, 107, 579
- Peterson et al. (1998) Peterson, B. M., Wanders, I., Bertram, R., Hunley, J. F., Pogge, R. W., & Wagner, R. M. 1998, ApJ, 501, 82
- Peterson et al. (2000) Peterson, B. M., et al. 2000, ApJ, 542, 161
- Peterson et al. (2004) —. 2004, ApJ, 613, 682
- Richards et al. (2002) Richards, G. T., Vanden Berk, D. E., Reichard, T. A., Hall, P. B., Schneider, D. P., SubbaRao, M., Thakar, A. R., & York, D. G. 2002, AJ, 124, 1
- Richards et al. (2011) Richards, G. T., et al. 2011, AJ, 141, 167
- Sergeev et al. (2005) Sergeev, S. G., Doroshenko, V. T., Golubinskiy, Y. V., Merkulova, N. I., & Sergeeva, E. A. 2005, ApJ, 622, 129
- Shappee & Stanek (2011) Shappee, B. J., & Stanek, K. Z. 2011, ApJ, 733, 124
- Sulentic et al. (2000) Sulentic, J. W., Zwitter, T., Marziani, P., & Dultzin-Hacyan, D. 2000, ApJ, 536, L5
- Watson et al. (2011) Watson, D., Denney, K. D., Vestergaard, M., & Davis, T. M. 2011, ApJ, 740, L49
- Welsh (1999) Welsh, W. F. 1999, PASP, 111, 1347
- White & Peterson (1994) White, R. J., & Peterson, B. M. 1994, PASP, 106, 879
- Woo et al. (2010) Woo, J.-H., et al. 2010, ApJ, 716, 269
- Zu et al. (2011) Zu, Y., Kochanek, C. S., & Peterson, B. M. 2011, ApJ, 735, 80


| Sampling | Mean | ||||||
|---|---|---|---|---|---|---|---|
| Time | Interval (days) | Mean | Fractional | ||||
| Series | Flux | Error | |||||
| (1) | (2) | (3) | (4) | (5) | (6) | (7) | (8) |
| 5100 Å | 133 | 1.0 | 0.95 | 0.013 | 0.129 | ||
| He ii | 89 | 1.5 | 1.00 | 0.016 | 0.130 | ||
| H4861 | 89 | 1.5 | 1.00 | 0.015 | 0.091 | ||
| Parameter | H | He ii |
|---|---|---|
| (1) | (2) | (3) |
| aafootnotemark: | 13.9 0.9 days | 2.7 0.6 days |
| bbfootnotemark: | 13.8 0.8 days | 2.1 1.2 days |
| 14.0 0.3 days | 1.6 days | |
| (mean) | 1641 12 km s-1 | 3465 26 km s-1 |
| FWHM (mean) | 1363 15 km s-1 | 3191 571 km s-1 |
| (RMS) | 1336 51 km s-1 | 3001 277 km s-1 |
| FWHM (RMS) | 1149 38 km s-1 | 7380 1275 km s-1 |
| () | () |