Istituto Nazionale di Fisica Nucleare, Sezione di Pisa, I-56127 Pisa, Italy
Laboratoire AIM, CEA-IRFU/CNRS/Université Paris Diderot, Service d’Astrophysique, CEA Saclay, 91191 Gif sur Yvette, France
Istituto Nazionale di Fisica Nucleare, Sezione di Trieste, I-34127 Trieste, Italy
Dipartimento di Fisica, Università di Trieste, I-34127 Trieste, Italy
Istituto Nazionale di Fisica Nucleare, Sezione di Padova, I-35131 Padova, Italy
Dipartimento di Fisica “G. Galilei”, Università di Padova, I-35131 Padova, Italy
INAF-Istituto di Astrofisica Spaziale e Fisica Cosmica, I-20133 Milano, Italy
Istituto Nazionale di Fisica Nucleare, Sezione di Perugia, I-06123 Perugia, Italy
Dipartimento di Fisica, Università degli Studi di Perugia, I-06123 Perugia, Italy
Dipartimento di Fisica “M. Merlin” dell’Università e del Politecnico di Bari, I-70126 Bari, Italy
Istituto Nazionale di Fisica Nucleare, Sezione di Bari, 70126 Bari, Italy
Laboratoire Leprince-Ringuet, École polytechnique, CNRS/IN2P3, Palaiseau, France
Institut de Ciències de l’Espai (IEEE-CSIC), Campus UAB, 08193 Barcelona, Spain
Artep Inc., 2922 Excelsior Springs Court, Ellicott City, MD 21042, resident at Naval Research Laboratory, Washington, DC 20375
ASI Science Data Center, I-00044 Frascati (Roma), Italy
Laboratoire Univers et Particules de Montpellier, Université Montpellier 2, CNRS/IN2P3, Montpellier, France
Dipartimento di Fisica, Università di Udine and Istituto Nazionale di Fisica Nucleare, Sezione di Trieste, Gruppo Collegato di Udine, I-33100 Udine, Italy
Space Science Division, Naval Research Laboratory, Washington, DC 20375-5352
Université Bordeaux 1, CNRS/IN2p3, Centre d’Études Nucléaires de Bordeaux Gradignan, 33175 Gradignan, France
Department of Physical Sciences, Hiroshima University, Higashi-Hiroshima, Hiroshima 739-8526, Japan
INAF Istituto di Radioastronomia, 40129 Bologna, Italy
Current address: Max-Planck-Institut für Radioastronomie, Auf dem Hügel 69, 53121 Bonn, Germany
Center for Space Plasma and Aeronomic Research (CSPAR), University of Alabama in Huntsville, Huntsville, AL 35899
NASA Goddard Space Flight Center, Greenbelt, MD 20771, USA
Science Institute, University of Iceland, IS-107 Reykjavik, Iceland
College of Science , Ibaraki University, 2-1-1, Bunkyo, Mito 310-8512, Japan
Research Institute for Science and Engineering, Waseda University, 3-4-1, Okubo, Shinjuku, Tokyo 169-8555, Japan
CNRS, IRAP, F-31028 Toulouse cedex 4, France
Université de Toulouse, UPS-OMP, IRAP, Toulouse, France
Yukawa Institute for Theoretical Physics, Kyoto University, Kitashirakawa Oiwake-cho, Sakyo-ku, Kyoto 606-8502, Japan
Max-Planck Institut für extraterrestrische Physik, 85748 Garching, Germany
Department of Physics and Department of Astronomy, University of Maryland, College Park, MD 20742
Istituto Nazionale di Fisica Nucleare, Sezione di Roma “Tor Vergata”, I-00133 Roma, Italy
Department of Physics, Boise State University, Boise, ID 83725, USA
Hiroshima Astrophysical Science Center, Hiroshima University, Higashi-Hiroshima, Hiroshima 739-8526, Japan
Institute of Space and Astronautical Science, JAXA, 3-1-1 Yoshinodai, Chuo-ku, Sagamihara, Kanagawa 252-5210, Japan
Department of Physics and Astronomy, University of Denver, Denver, CO 80208, USA
Max-Planck-Institut für Physik, D-80805 München, Germany
Center for Earth Observing and Space Research, College of Science, George Mason University, Fairfax, VA 22030, resident at Naval Research Laboratory, Washington, DC 20375
Institut für Astro- und Teilchenphysik and Institut für Theoretische Physik, Leopold-Franzens-Universität Innsbruck, A-6020 Innsbruck, Austria
Santa Cruz Institute for Particle Physics, Department of Physics and Department of Astronomy and Astrophysics, University of California at Santa Cruz, Santa Cruz, CA 95064, USA
NYCB Real-Time Computing Inc., Lattingtown, NY 11560-1025, USA
Department of Physics, Center for Cosmology and Astro-Particle Physics, The Ohio State University, Columbus, OH 43210, USA
Partially supported by the International Doctorate on Astroparticle Physics (IDAPP) program
Institució Catalana de Recerca i Estudis Avançats (ICREA), Barcelona, Spain
Consorzio Interuniversitario per la Fisica Spaziale (CIFS), I-10133 Torino, Italy
INTEGRAL Science Data Centre, CH-1290 Versoix, Switzerland
NASA Postdoctoral Program Fellow, USA
Dipartimento di Fisica, Università di Roma “Tor Vergata”, I-00133 Roma, Italy
Department of Physics, Stockholm University, AlbaNova, SE-106 91 Stockholm, Sweden
The Oskar Klein Centre for Cosmoparticle Physics, AlbaNova, SE-106 91 Stockholm, Sweden
Laboratoire d’Astrophysique de Bordeaux, Université de Bordeaux, CNRS/INSU, Floirac cedex, France
11email: isabelle.grenier@cea.fr
11email: luigi.tibaldo@pd.infn.it
The cosmic-ray and gas content of the Cygnus region as measured in gamma rays by the Fermi Large Area Telescope
Abstract
Context. The Cygnus region hosts a giant molecular-cloud complex that actively forms massive stars. Interactions of cosmic rays with interstellar gas and radiation fields make it shine at -ray energies. Several -ray pulsars and other energetic sources are seen in this direction.
Aims. In this paper we analyze the -ray emission measured by the Fermi Large Area Telescope in the energy range from 100 MeV to 100 GeV in order to probe the gas and cosmic-ray content on the scale of the whole Cygnus complex. The -ray emission on the scale of the central massive stellar clusters and from individual sources is addressed elsewhere.
Methods. The signal from bright pulsars is greatly reduced by selecting photons in their off-pulse phase intervals. We compare the diffuse -ray emission with interstellar gas maps derived from radio/mm-wave lines and visual extinction data. A general model of the region, including other pulsars and -ray sources, is sought.
Results. The integral H i emissivity above MeV averaged over the whole Cygnus complex amounts to photons s-1 sr-1 H-atom-1, where the systematic error is dominated by the uncertainty on the opacity to calculate its column densities. The integral emissivity and its spectral energy distribution are both consistent within the systematics with LAT measurements in the interstellar space near the solar system. The average ratio is found to be molecules cm-2 (K km s-1)-1, consistent with other LAT measurements in the Local Arm. We detect significant -ray emission from dark neutral gas for a mass corresponding to of what is traced by CO. The total interstellar mass in the Cygnus complex inferred from its -ray emission amounts to at a distance of 1.4 kpc.
Conclusions. Despite the conspicuous star formation activity and high masses of the interstellar clouds, the cosmic-ray population in the Cygnus complex averaged over a few hundred parsecs is similar to that of the local interstellar space.
Key Words.:
ISM: abundances – ISM: clouds – cosmic rays – Gamma rays: ISM1 Introduction
Regions with conspicuous star formation activity are of great interest for understanding the life cycle of interstellar matter and the properties of cosmic rays (CRs) in the Galaxy. Interstellar -ray emission produced by CR interactions with the interstellar gas via nucleon-nucleon inelastic collisions and electron Bremsstrahlung can be used to probe their CR and gas content.
High-energy -ray observations have entered a new era since the launch of the Fermi Gamma-ray Space Telescope in 2008. The Fermi Large Area Telescope (LAT; Atwood et al. 2009) has already measured strong -ray emission toward the 30 Doradus starburst region in the Large Magellanic Cloud (Abdo et al. 2010d), and it also pointed out a global correlation between the -ray luminosity and star-formation rate in a few normal galaxies (Abdo et al. 2010c).
A primary observational target for Fermi in our Galaxy is the Cygnus X star-forming region, owing to its proximity ( kpc; Hanson 2003; Negueruela et al. 2008) and the availability of numerous multiwavelength observations. Named after the strong emission at X-ray wavelengths (Cash et al. 1980), Cygnus X is located around the Galactic longitude , tangent to the Local Spur. It contains numerous H ii regions and OB associations (Uyanıker et al. 2001; Le Duigou & Knödlseder 2002). It has long been debated whether it represents a coherent complex or the alignment of different structures along the line of sight. Recent high-resolution observations by Schneider et al. (2006) and Roy et al. (2011) have pointed out that most of the molecular clouds in the Cygnus X region are connected and partly show evidence of interactions with the massive stellar cluster Cygnus OB2 and other OB associations in the region. Foreground molecular clouds from the Great Cygnus Rift, at 0.6–0.8 kpc, contribute little to the high mass seen in interaction with the Cygnus X region itself, at 1.4 kpc. Therefore, the molecular cloud complex appears as one of the most massive in the Galaxy. Atomic gas seen in these directions is probably more widespread along the line of sight.
Abdo et al. (2007, 2008) analyzed Milagro measurements at energies TeV and reports an excess of diffuse -ray emission with respect to predictions based on CR spectra equivalent to those near the Earth. They attribute the excess to the possible presence of freshly accelerated particles.
The escape of CRs from their sources and the early propagation in the surrounding medium have so far been poorly constrained by observations. In particular, particles accelerated in regions of massive star-formation are likely to be significantly influenced by the turbulent environment. It is therefore interesting to investigate how the CR populations on the scale of the massive stellar clusters and on the larger scale of the parent interstellar complex compare with each other and with the average CR population of the Local Spur.
This paper reports our analysis of the -ray emission measured by the LAT in the energy range between 100 MeV and 100 GeV across the entire Cygnus region. We focus on the large-scale properties of the interstellar emission to probe the CR population and to complement gas and dust observations at other wavelengths to constrain the amount of gas in different phases over the whole Cygnus complex. We also build an improved interstellar background framework for the study of individual -ray sources that will be treated in companion papers. We discuss interstellar emission in the star-forming region of Cygnus X in a dedicated paper (Ackermann et al. 2011a).
2 Data
In this section we describe the data used in the paper. First of all, we describe the -ray data sample (§ 2.1), including the selection criteria (§ 2.1.1) and the procedure to mitigate the signals from the brightest pulsars (§ 2.1.2). Then, we present an overview of the other data used to trace the distribution of the interstellar matter (§ 2.2), including radio and mm-wave lines (§ 2.2.1) to trace neutral gas, visual extinction (§ 2.2.2) to trace dark neutral gas, and the free-free emission intensities obtained from microwave observations (§ 2.2.3) to trace the ionized gas.
2.1 Gamma-ray data
2.1.1 Observations and data selection
The LAT is a pair-tracking telescope detecting photons from 20 MeV to more than 300 GeV. The instrument is described in Atwood et al. (2009) and its on-orbit calibration in Abdo et al. (2009a). The LAT operates most of the time in continuous sky-survey mode. We accumulated data for our region of interest from August 5, 2008 (MET111Fermi Mission Elapsed Time, i.e. seconds since 2001 January 1 at 00:00:00 UTC. 239587201) to August 5, 2010 (MET 302659202).
We selected data according to the tightest available background rejection criteria, corresponding to the Pass 6 Dataclean event class (Abdo et al. 2010e)222 Performance figures for the Dataclean event selection are given in the reference.. In order to limit the contamination from the Earth’s atmospheric -ray emission, we selected events with measured arrival directions within of the local zenith and within of the instrument boresight, taken during periods when the LAT rocking angle was less than .
The angular resolution of the LAT strongly depends on the photon energy, improving as the energy increases (Atwood et al. 2009). Confusion at low energies is a problem since we aim to spatially separate the different components in the crowded Cygnus X region. We therefore accepted below 1 GeV only photons that produced electron-positron pairs in the thin converter planes of the front section of the tracker, which provides a higher angular resolution (Atwood et al. 2009). Above 1 GeV, we kept all events which converted either in the front or back section of the tracker.
We analysed data at Galactic longitudes and latitudes . The longitude window contains the interstellar complexes associated with Cygnus X; the latitude window is large enough to allow a reliable separation of the large-scale emission from atomic gas, isotropic background and inverse-Compton (IC) scattering of low-energy radiation fields by CR electrons. We analysed the data in the 100 MeV–100 GeV energy band. Below 100 MeV the instrumental systematics are large (Rando et al. 2009) and the angular resolution is poor, whereas above 100 GeV we are limited by the low photon statistics.
2.1.2 Removal of bright pulsars
Three bright pulsars dominate the -ray emission from the region below a few GeV: the radio pulsar J20213651 (Abdo et al. 2009e) and the two LAT-discovered pulsars J20214026 and J20324127 (Abdo et al. 2009b). To increase the sensitivity to faint sources and to the spatial structure of the diffuse emission, we reduced their contribution by excluding the periodic time intervals when their pulsed emission is the most intense. Removing the intense pulsed flux helps to reduce the impact of any incorrect modeling of such bright sources on the results.
To assign pulse phases for each of the three pulsars, we produced timing models using Tempo2 (Hobbs et al. 2006) according to the method described in Ray et al. (2011)333For the three pulsars, the RMS of the timing residuals is below 1.1% of their rotational period.. Figure 1 shows the three light curves and the phase intervals with bright pulsed emission. The phase boundaries are reported in Table 1, together with the fraction of time in the off-pulse interval suitable for our study. There is a considerable level of off-pulse emission toward PSR J20214026 that cannot be removed (Abdo et al. 2010b); however, given the brightness of the source, the removal of the on-pulse interval is useful for our aims.

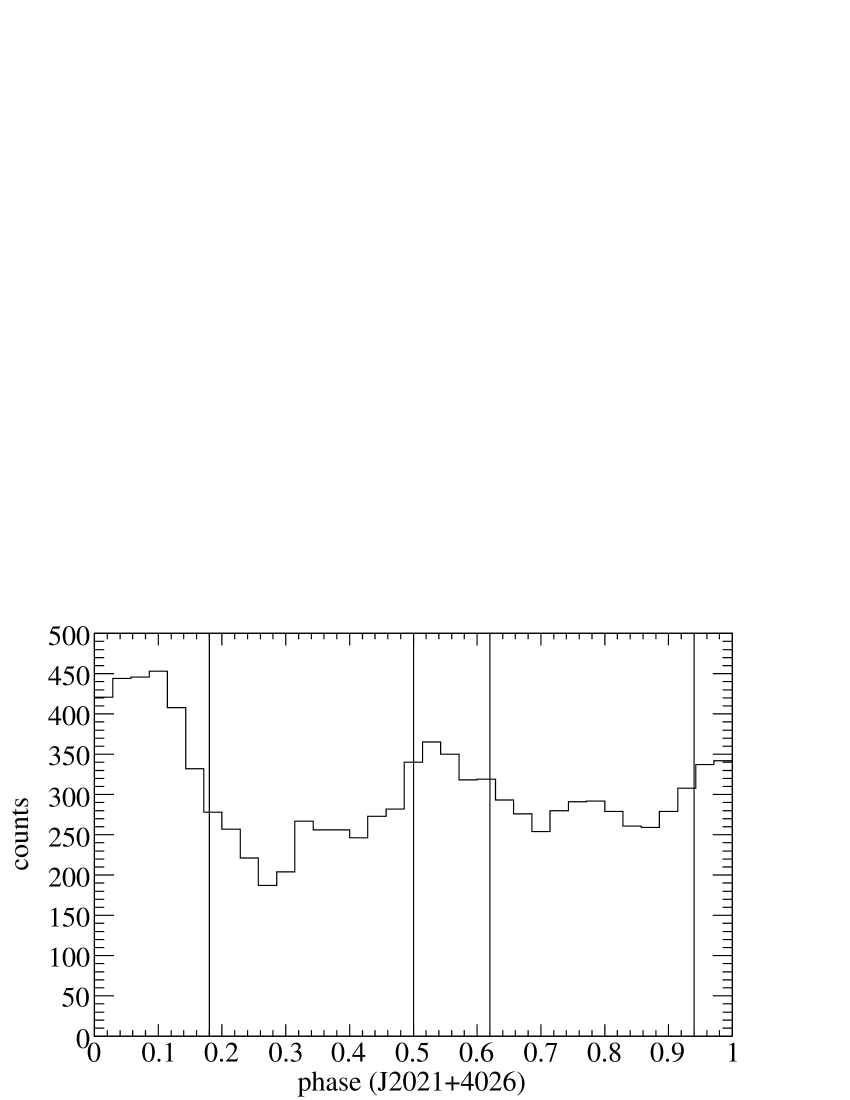
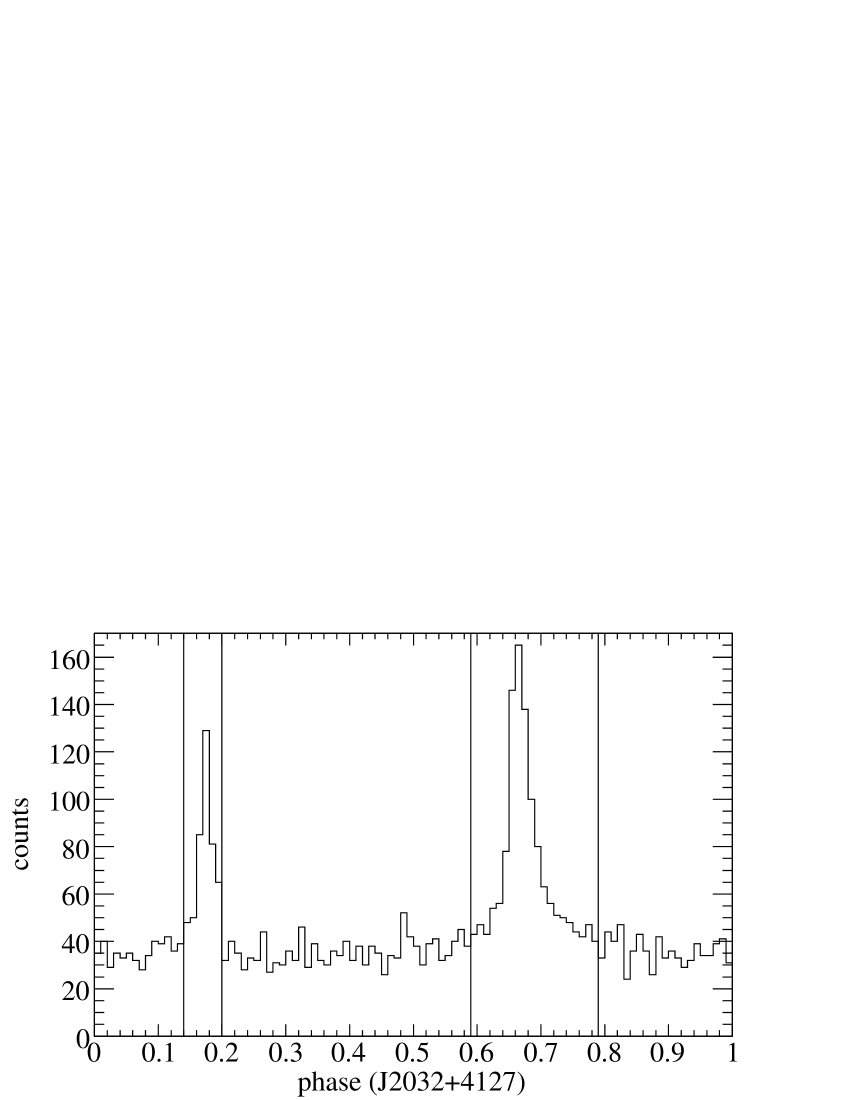
of the three bright pulsars. PSR phase interval time fraction (%) J20213651 0–0.12, 0.22–0.59, 0.7–1 79 J20214026 0.18–0.5, 0.62–0.94 64 J20324127 0–0.14, 0.2–0.59, 0.79–1 74
A total count map in the off-pulse phase intervals of the three bright pulsars is provided for illustration in Fig. 2.

To remove the pulsar signal without excessively sacrificing the photon statistics in other directions, we restricted the timing selection to a circular region around the pulsar position, namely to pixels in our angular grid (described later in § 3.2) the centroids of which lie within the energy-dependent radius
| (1) |
where the symbol indicates addition in quadrature. This is an approximate representation of the LAT containment angle as a function of energy. We note that the accurate parametrization of the LAT point spread function (PSF) depends on energy, pair-conversion point in the tracker and, to a lesser extent, on the incidence angle. The PSF is best represented by the LAT instrument response functions (IRFs), which are used later for the likelihood analysis. The above acceptance-averaged approximation for the containment angle is only useful for calculating the radius , and we verified that the results are insensitive to reasonable variations in this parameter.
To take the cut on pulsar phases into account, for each direction in the sky and energy the exposure (see again § 3.2) was multiplied by the remaining livetime fraction. The remainder of the pulsar emission was included in the model using
-
•
a point source to represent emission in the off-pulse interval;
-
•
a second point source, for which the number of expected counts is set to zero at from the pulsar position, to represent on-pulse -rays spilling over at in the tails of the PSF.
The two sources have free independent fluxes in each energy bin of the analysis. This is particularly important to account for the different spectra of the on-pulse and off-pulse -ray emission and also to compensate for any mismatch between the tails of the model PSF and the emission at large angles from the brightest sources in the region.
Since the three pulsars have exponential spectral cutoffs near GeV (Abdo et al. 2010b) the phase selection was not applied above GeV where the level of pulsed emission is low and each pulsar was accounted for by a single point source. On the other hand, given the abundant statistics but poor angular resolution at low energies (more than half of the region of interest would be subject to on-pulse event removal), we selected off-pulse photons for the whole region below MeV 444See § 3.2 for the definition of the energy grid used in the analysis.. In this case no “spill-over” source was necessary.
2.2 Ancillary data
2.2.1 Radio/mm-wave lines: neutral gas
Neutral atomic hydrogen, H i, was traced thanks to its 21-cm line. Where available555The CGPS coverage is almost complete at for this longitude range. we used data from the Canadian Galactic Plane Survey (CGPS; Taylor et al. 2003) rebinned onto the grid used for the other maps. Elsewhere, we used data from the Leiden/Argentine/Bonn (LAB; Kalberla et al. 2005) survey, with a coarser binning of . We checked the consistency of the two survey calibrations in the overlap region.
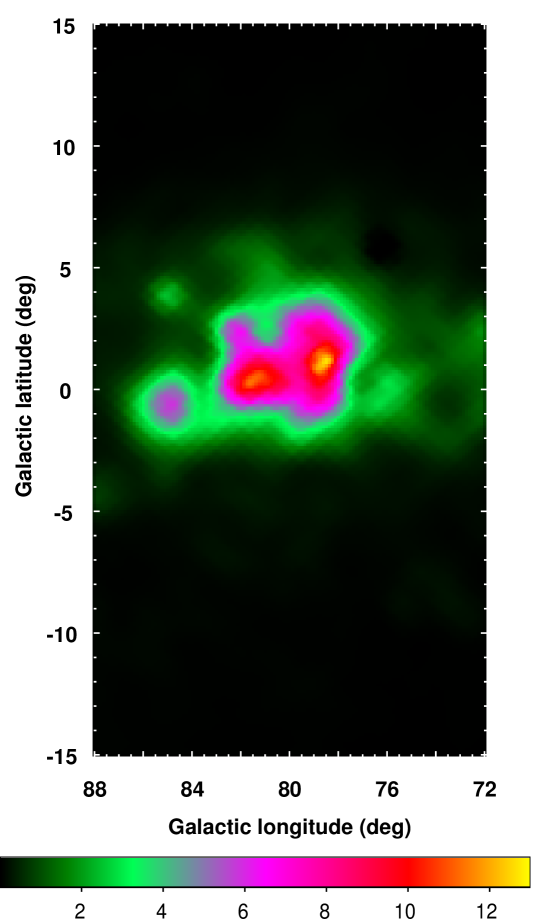
Molecular hydrogen cannot be observed directly in its most abundant cold phase. The velocity-integrated brightness temperature of the 12CO 2.6-mm line, , is often assumed to linearly scale with the column density. We used CO data from the composite survey by Dame et al. (2001), filtered with the moment-masking technique (Dame 2011) in order to reduce the noise while preserving the faint cloud edges and keeping the resolution of the original data.
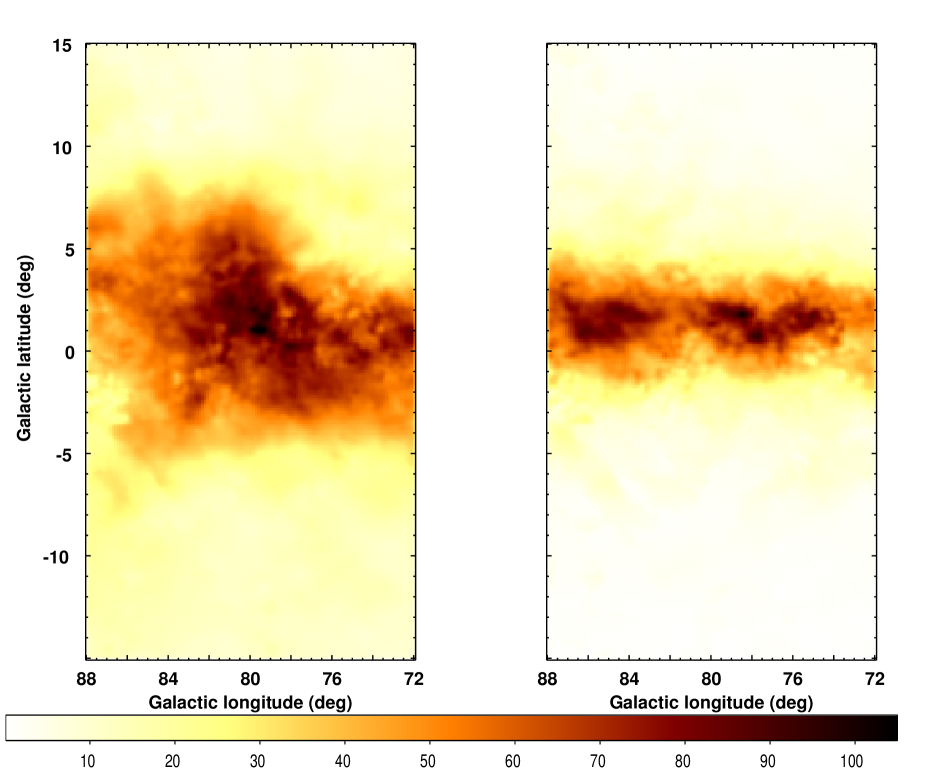
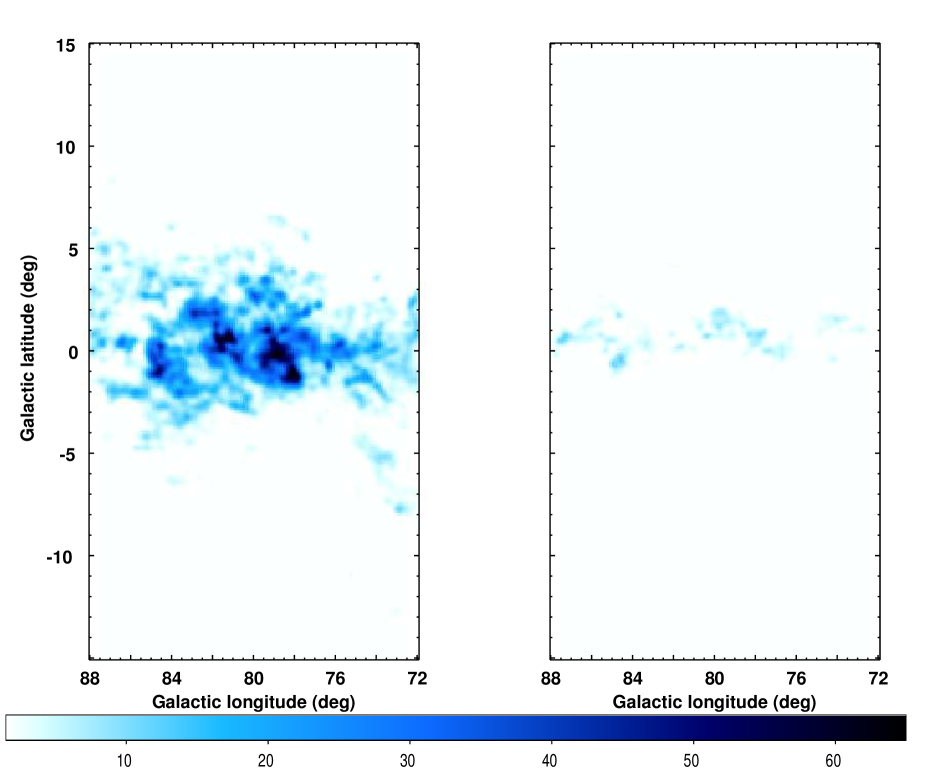
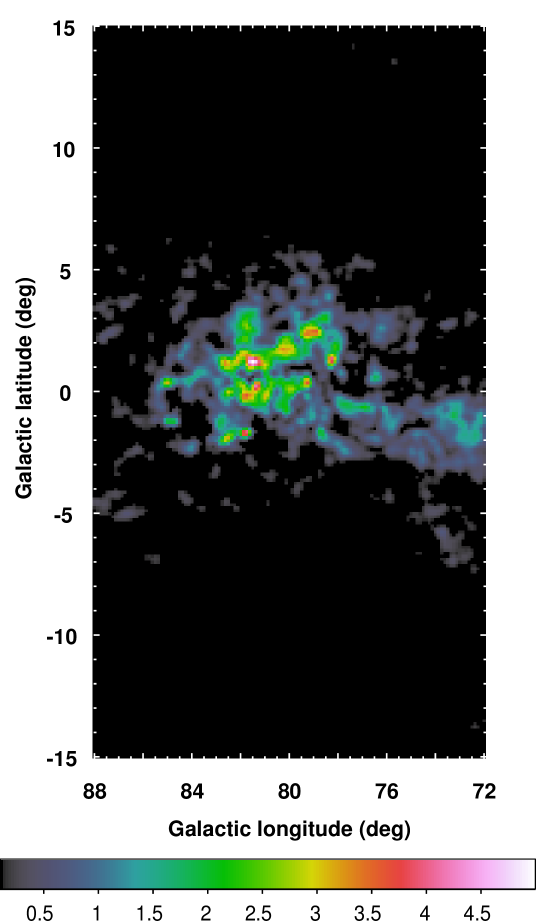
The Doppler shift of radio/mm-wave lines can be used to kinematically separate the Cygnus complex from two faint segments of the Perseus and outer spiral arms seen beyond Cygnus in the same direction. We applied the kinematic separation procedure illustrated by Abdo et al. (2010f), starting from a preliminary boundary located at a Galactocentric radius666Based on the assumption of a flat rotation curve with solar radius kpc and Galactic rotation velocity at the solar circle km s-1 kpc and then adapting the separation to the cloud structures and correcting for the spill-over due to the broad velocity dispersion of H i lines. The separation into two regions is accurate enough to model the interstellar -ray emission in Cygnus since Abdo et al. (2010f) and Ackermann et al. (2011b) did not find any significant gradients of the gas -ray emissivities in the outer region of the Milky Way. We applied the kinematic separation procedure to prepare maps of the column densities of atomic gas, , and of . The maps are shown in Fig. 3 for H i and Fig. 4 for CO. All the gas maps mentioned in the paper have borders around the analysis region used to properly convolve the model with the LAT PSF.
Substantial uncertainties in the determination of arise from the choice of spin temperature for the optical depth correction. We adopted a uniform K as baseline case, which is the average spin temperature that best reproduces the blending of cold and warm atomic gas according to observations of emission-absorption pairs in the region covered by the CGPS (Dickey et al. 2009). Other values K will be considered later to evaluate the related systematic uncertainties affecting the results of our analysis.
2.2.2 Visual extinction: dark neutral gas
Multiwavelength observations indicate that the combination of the H i and CO lines does not properly trace the total column densities of the neutral interstellar medium (ISM) (e.g. Magnani et al. 2003; Grenier et al. 2005; Abdo et al. 2010f; Langer et al. 2010; Ade et al. 2011). Since the work by Grenier et al. (2005), dust tracers have been used in -ray analyses to complement the H i and CO lines, under the assumption that dust grains are well mixed with gas in the warm and cold phases of the ISM and therefore provide an estimate of total gas column densities. Grenier et al. (2005) and Abdo et al. (2010f) adopted the color excess map by Schlegel et al. (1998) as a tracer of the total column densities, and used the residuals –i.e. minus the best-fit linear combination of and maps– as a tracer of the dark-gas column densities in nearby clouds of the Gould Belt.
The use of the map is problematic in the Cygnus X region for two reasons:
-
•
numerous infrared point sources contaminate the map;
-
•
the temperature correction used by Schlegel et al. (1998) to derive the dust column-density map from IRAS/ISSA measurements is highly uncertain in regions of massive star-formation because of the enhanced radiation fields.
We have therefore adopted the visual extinction as derived from the reddening of near-infrared sources in the 2MASS catalog (Skrutskie et al. 2006). The maps produced by Rowles & Froebrich (2009) and Froebrich & Rowles (2010) were used for mag. They exhibit saturation effects at higher extinction values, so we complemented them with an map obtained from 2MASS data using the code and method developed by Schneider et al. (2011). The latter use the Besançon stellar population model (Robin & Creze 1986; Robin et al. 2003) to filter out the contribution from the foreground bluest stars777To do so, a distance from the observer needs to be assumed for the clouds under consideration. We verified that variations of a few hundred parsecs do not significantly change the results presented in the paper.. The second map was built in a region centered on , and, compared with the first set of maps, it presented an offset of mag at low extinction. We constructed the final map from the direct Rowles & Froebrich (2009) data below 5 mag and from the second map, offset by 0.46 mag, at higher extinction.
The map was binned onto the same grid in Cartesian projection as the other maps. The map was fitted with a linear combination of the and maps previously described. The input map minus the best-fit linear combination of the and maps yielded the excess map, , which will be used to trace the dark neutral gas. Only residuals corresponding to input mag were kept to limit the noise off the plane. The excess map is shown in Fig. 5.
2.2.3 Microwave emission: ionized gas
Away from regions around massive stars and stellar clusters, the ionized gas constitutes a layer of characteristic height kpc over the Galactic plane with little mass compared to the neutral phases (Cordes & Lazio 2002). Therefore, it has often been neglected in previous -ray studies. However, we find in the Cygnus X region many conspicuous regions excited by the intense radiation fields of the numerous massive stars (Uyanıker et al. 2001; Paladini et al. 2003).
Ionized gas masses can be traced by free-free emission following the prescription by Sodroski et al. (1989, 1997) to derive the column densities:
| (2) |
where is the free-free emission intensity at the frequency , is the electron temperature, and the effective electron number density. We adopted a free-free emission map derived from the seven-year WMAP data in the Q band ( GHz) by Gold et al. (2011) using the maximum entropy method from the prior template given by the extinction-corrected H map by Finkbeiner (2003). It was rebinned onto the grid used for the other maps, as shown in Fig. 6.
3 Analysis
3.1 Analysis model
3.1.1 Diffuse emission
Since the bulk of Galactic CRs in the relevant energy ranges are expected to be smoothly distributed on scales exceeding the typical dimensions of interstellar clouds and to penetrate all the phases of the ISM uniformly, the -ray emission produced by CR-gas interactions can be modeled to first order as a linear combination of the gas column densities summed for the different phases and different regions along the line of sight.
Ionized gas, with a total mass over the region of for K, represents less than of the total atomic mass present in the Cygnus complex (assuming cm-3, Sodroski et al. 1997). The corresponding column densities are highest in the massive star-forming region of Cygnus X where we detected a bright and hard extended -ray source powered by freshly-accelerated particles, that will be called hereinafter “the cocoon” (Ackermann et al. 2011a). The free-free emission map was significantly detected in addition to the other interstellar components, but only at the expense of an unusually hard spectrum. To model the entire region, we introduced an extended source to account for the cocoon, as described in 3.1.2. The latter was found to provide the best fit to the LAT data, yielding a higher maximum-likelihood value than the free-free emission template. Since the cocoon source overlaps most of the ionized clouds, it absorbs their contribution to the -ray emission, so ionized gas was not included in the baseline model through the free-free emission template. The Cygnus X region is treated in detail in a companion paper (Ackermann et al. 2011a). The results presented in this paper were checked against the inclusion of the free-free emission template in the model.
The interstellar IC emission is produced by interactions of CR electrons and positrons with the low-energy interstellar radiation field (ISRF). To account for large-scale IC emission from the Milky Way we adopted a template calculated using the GALPROP CR propagation code888http://galprop.stanford.edu (Strong & Moskalenko 1998; Strong et al. 2007), run 54_87Xexph7S. The IC emission was calculated on the basis of a CR electron spectrum consistent with recent measurements at the Earth (Abdo et al. 2009c) and the new calculation of the Galactic ISRF by Porter et al. (2008).
Local radiation fields could leave unmodeled structures in IC emission, notably in the massive star-forming region of Cygnus X (e.g. Orlando & Strong 2007). In the companion paper we show that an upper bound to the IC emission from the stellar and interstellar low-energy radiation fields upscattered by CR electrons with the local spectrum is two orders of magnitude fainter than the cocoon emission, which in turn is fainter than the emission from the neutral gas (Fig. 9). The CR electron sources within Cygnus X could further enhance the IC -ray yield. Any enhanced IC contribution from the inner region is accounted for in this analysis by the extended cocoon source, and it should not bias the determination of the gas emissivities we aim to study here.
The diffuse emission model is completed by the isotropic background which combines the residual backgrounds from misclassified CR interactions in the LAT and the isotropic, presumably extragalactic, -ray emission (studied in detail in Abdo et al. 2010e).
3.1.2 Sources
We included in the model the identified sources in the region of interest: Cygnus X-3 (Abdo et al. 2009f), PSR J19575033 (Saz Parkinson et al. 2010) and PSR J20303641 (Camilo et al. 2011), in addition to the three bright pulsars as discussed in § 2.1.2.
We also iteratively included significant 1FGL point sources (Abdo et al. 2010a) either associated with active galactic nuclei (AGN) or characterized by variability or both. The sources were added with decreasing brightness: J2116.13338, J2001.14351, J2027.63335, J2115.52937, J2015.73708, J2029.24924, J2012.24629, and J2128.03623. The iterative procedure is useful for stabilizing the likelihood fitting procedure and assessing the significance of sources added at each step.
We detected extended -ray emission above the global interstellar emission model discussed here associated with the supernova remnants known as the Cygnus Loop (G74.0-8.5, e.g. Sun et al. 2006) and Cygni (G78.2+2.1, e.g. Ladouceur & Pineault 2008) and with the inner 100 pc of the Cygnus X complex. They are discussed in detail elsewhere. We briefly summarize here how these extended sources are modeled. For each of them we have tested different models and therefore verified that their presence does not bias the results concerning the properties of large-scale interstellar emission presented in the paper.
The Cygnus Loop was modeled using a ring centered at and with inner/outer radii of and , respectively, which best reproduces -ray emission from the Cygnus Loop (Katagiri et al. 2011).
We included two sources in the region of Cygni in addition to PSR J20214026:
-
•
a uniform disk centered at and a radius of (G78.22.1; Green 2009);
- •
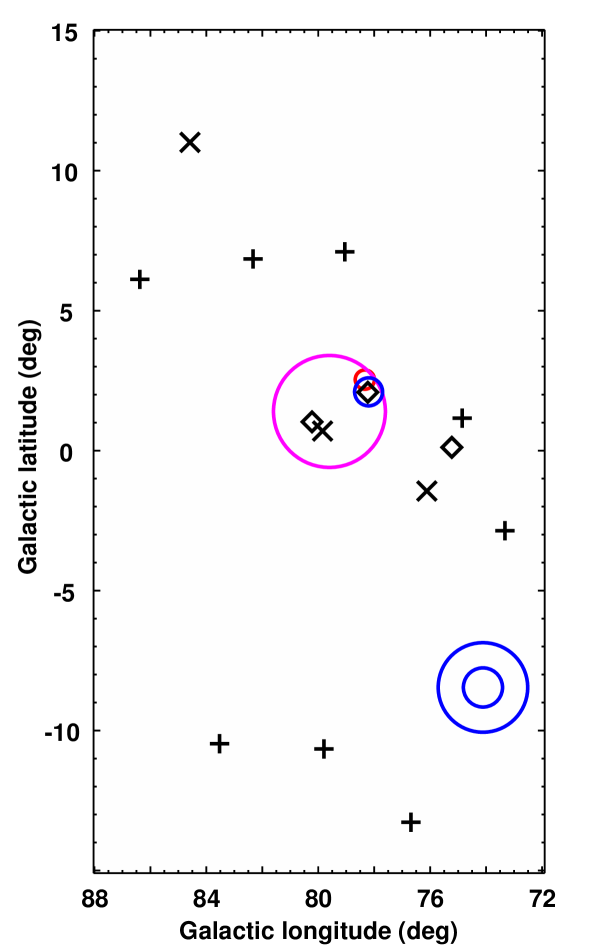
We detected extended -ray emission toward the inner pc of Cygnus X, which is effectively treated here as a source named “the cocoon”. We discuss the nature of the cocoon and its relation with CR acceleration in the massive star-forming region in a dedicated paper (Ackermann et al. 2011a), where we determine a Gaussian centered at with a width to be the model providing the best fit to the LAT data. As noted above, the cocoon source effectively accounts for the contribution from ionized gas and from enhanced IC emission in the Cygnus X massive star-forming region, as well as for locally-accelerated CRs. The spatial distribution of the sources included in the analysis model is summarized in Fig. 7.
3.1.3 Summary of the analysis model
To summarize, the -ray intensities (photons cm-2 s-1 sr-1) are modeled in each energy bin by
| (3) | |||||
The sum over represents the combination of the two regions: 1) Cygnus complex and 2) outer Galaxy. The free parameters of the diffuse emission model are the emissivities per hydrogen atom, (s-1 sr-1), the emissivities per unit of intensity, (cm-2 s-1 sr-1 (K km s-1)-1), the emissivity per excess unit (cm-2 s-1 sr-1 mag-1), and the isotropic intensity (cm-2 s-1 sr-1). stands for the IC emission model described above. The sum over represents the combination of the sources, either point-like or extended, as described in § 3.1.2, including a free parameter (flux normalization) independently for each of them.
3.2 Analysis method
The model was fit to LAT data by using a binned maximum likelihood with Poisson statistics101010As implemented in the standard LAT analysis tools 09-18-05. independently over several energy bins. We used a binning in Cartesian projection, comparable to the LAT angular resolution at the highest energies. We considered three energy bands: low ( MeV– GeV), mid ( GeV– GeV) and high energies ( GeV– GeV). The low and mid-energy bands were divided further into four logarithmic-spaced energy bins, the higher-energy band in two because of the limited statistics111111The bounds of the energy bins are reported in Table 2.. The analysis was based on the post-launch IRFs of the P6_V3 series, which consider efficiency losses due to pile-up and accidental coincidence effects in the detector (Rando et al. 2009).
To perform the convolution with the LAT PSF, a power-law spectrum with index was assumed for the gas maps and other sources modeled by geometrical templates (the results do not significantly depend on this value). For all other sources we used power-law spectra with the spectral index reported in the 1FGL Catalog. For the pulsars included in the LAT pulsar catalog (Abdo et al. 2010b), we used the spectral functions described therein.
4 Results and discussion
4.1 Summary of the results and uncertainties
The -ray residuals corresponding to the best-fit model are shown in Fig. 8.
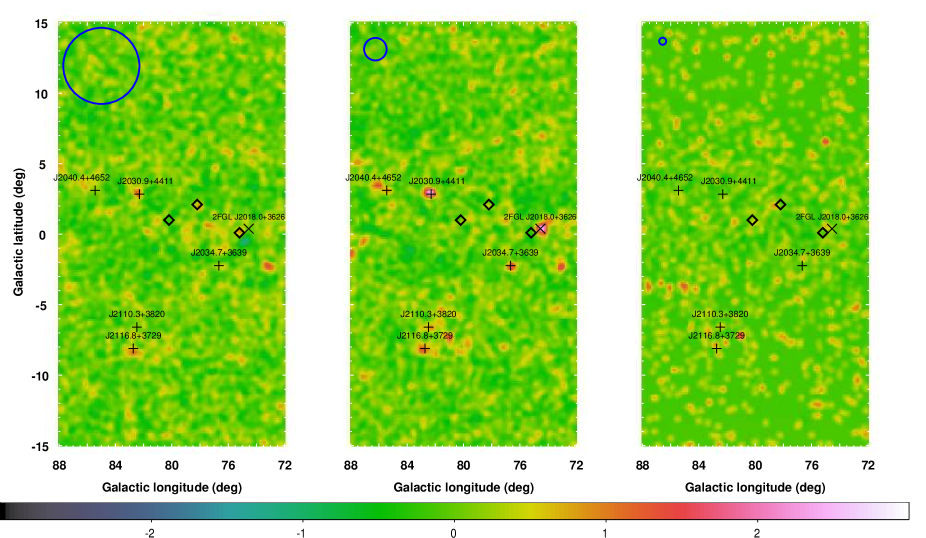
They indicate that the model satisfactorily reproduces the morphology of the -ray emission on larger angular scales than the LAT PSF in all the energy bands. Localized positive residuals are still present. Some of them coincide with unassociated 1FGL sources and others are associated with sources of the 2FGL catalog121212The preparation of the 2FGL catalog ran in parallel with the analysis reported in this paper. The source list is now available from http://fermi.gsfc.nasa.gov/ssc/data/access/lat/2yr_catalog/., notably 2FGL J also coincident with the TeV source MGRO J2019+27 (Abdo et al. 2007). We verified that including sources accounting for those residuals in the analysis model would not significantly affect the determination of -ray emissivities associated with the different gas components summarized in Table 2.
| energy bina𝑎aa𝑎aGeV | b𝑏bb𝑏b s-1 sr-1 | c𝑐cc𝑐c cm-2 s-1 sr-1 (K km s-1)-1 | b𝑏bb𝑏b s-1 sr-1 | c𝑐cc𝑐c cm-2 s-1 sr-1 (K km s-1)-1 | d𝑑dd𝑑d cm-2 s-1 sr-1 mag-1 | |||||
|---|---|---|---|---|---|---|---|---|---|---|
| 0.1–0.178 | 7.9 | 1.1 | 3.3 | 1.0 | 8.5 | 1.4 | 0.00 | 0.06 | 10 | 30 |
| 0.178–0.316 | 5.9 | 0.3 | 2.2 | 0.3 | 4.7 | 0.4 | 0.000 | 0.002 | 19 | 5 |
| 0.316–0.562 | 3.27 | 0.11 | 1.16 | 0.08 | 3.23 | 0.14 | 0.00 | 0.06 | 11.0 | 1.8 |
| 0.562–1 | 1.95 | 0.06 | 0.59 | 0.04 | 1.72 | 0.10 | 0.5 | 0.3 | 6.2 | 0.7 |
| 1–1.78 | 0.98 | 0.03 | 0.328 | 0.016 | 0.74 | 0.04 | 0.12 | 0.13 | 2.6 | 0.3 |
| 1.78–3.16 | 0.389 | 0.016 | 0.141 | 0.008 | 0.36 | 0.02 | 0.02 | 0.06 | 0.86 | 0.15 |
| 3.16–5.62 | 0.151 | 0.005 | 0.044 | 0.004 | 0.113 | 0.013 | 0.02 | 0.03 | 0.39 | 0.08 |
| 5.62–10 | 0.050 | 0.003 | 0.016 | 0.002 | 0.046 | 0.006 | 0.000 | 0.005 | 0.15 | 0.04 |
| 10–31.6 | 0.0085 | 0.0015 | 0.0059 | 0.0010 | 0.021 | 0.003 | 0.002 | 0.008 | 0.043 | 0.019 |
| 31.6-100 | 0.0024 | 0.0007 | 0.0016 | 0.0004 | 0.0007 | 0.0014 | 0.002 | 0.003 | 0.002 | 0.007 |
Figure 9 shows the -ray spectral energy distribution measured by the LAT over the whole region of interest.
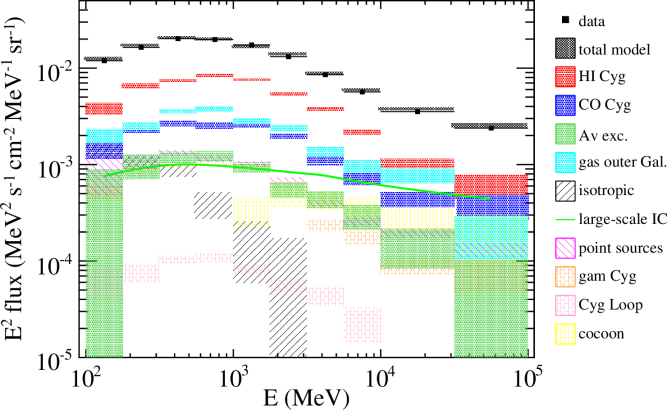
The LAT measurements are compared with the final model, and the different components are outlined. The data sample is dominated by emission from interstellar gas in the Cygnus complex. The largest contributor is . Emission associated with CO and excesses exceeds the signals from individual sources for the whole energy range considered. The cocoon has a very hard spectrum and becomes comparable to emission from CO-bright gas at energies GeV.
All the results presented so far have been based on the assumption of a uniform spin temperature of K. To gauge the impact of the optical depth correction of data on the results, we repeated the analysis with other assumptions. K is considered since it is the value best reproducing pairs of emission/absorption spectra over most of the regions analyzed by Dickey et al. (2009), although they find that K is preferred in the region covered by CGPS data. K is considered because it has long been used for -ray studies (e.g. Bloemen et al. 1984; Hunter et al. 1997; Strong et al. 2004). We also considered two extreme assumptions: a low141414The spin temperature is higher than the brightness temperature, measured K along many directions in the region. K, and the optically thin approximation (equivalent to infinitely high spin temperature). Figure 10 shows the maximum likelihood profile obtained for the final model as a function of .
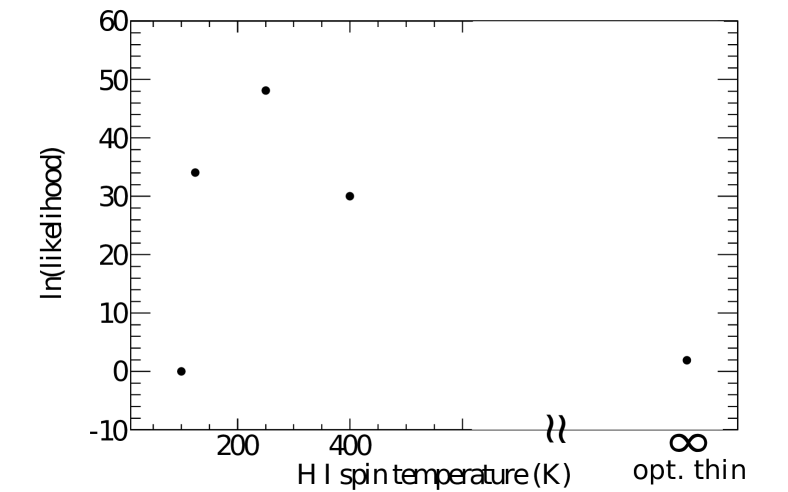
The results support the average spin temperatures of a few hundred K deduced from radio absorption/emission measurements by Dickey et al. (2009), implying a mix of cold and warm .
To test the robustness of the results against the presence of ionized gas beyond the extended cocoon source, we replaced the latter in the baseline model with the free-free emission template. All the results for the gas emissivities were found to be consistent with the values listed in Table 2 within statistical errors.
The large-scale IC model introduced in § 3.1.1 is affected by considerable uncertainties related to the distribution of CR densities and of the ISRF in the Galaxy. The intensity of IC emission expected over our region of interest is comparable to the one from interstellar gas. The latter, however, is highly structured and has a lower characteristic height above the Galactic plane, and can therefore be reliably determined in the likelihood fit. We verified that completely neglecting the large-scale IC emission leads to negligible variations in the emissivities of CO-bright gas and excesses, and to variations lower than or comparable to statistical uncertainties for the emissivities of the atomic hydrogen, which is less structured than the other ISM components and has a larger characteristic height.
Other systematic uncertainties are due to the LAT instrument response. The uncertainties in the -ray selection efficiency are estimated to be at MeV, at MeV, and above GeV for the IRFs we used here (Abdo et al. 2010e). The Monte Carlo-based PSF used for this study is known to not accurately reproduce in-flight data over the whole energy range considered. We verified by means of dedicated simulations that this does not significantly affect the determination of the gas emissivities considered for the discussion. The energy dispersion is routinely neglected in the likelihood fitting of LAT data for limitations in computing power: Monte Carlo simulations indicate that this approximation causes a bias on the order of at 100 MeV decreasing to above MeV.
4.2 H i emissivity and CR densities
The emissivity per hydrogen atom relates to the average CR density in each of the regions considered. LAT measurements (Abdo et al. 2009d) show that the emissivity spectrum in the local ISM is consistent with production via electron Bremsstrahlung and nucleon-nucleon interactions by CRs with a spectrum consistent with that directly measured in the neighborhood of the Earth.
The integrated -ray emissivity MeV we measure in the Cygnus complex amounts to s-1 sr-1. Figure 11 shows the emissivity spectrum obtained for the Cygnus complex and compares it with the expectations for the local interstellar spectrum estimated in Abdo et al. (2009d). The latter is compatible (within ) with LAT observations at mid latitudes in the third Galactic quadrant in the energy range MeV– GeV (Abdo et al. 2009d).
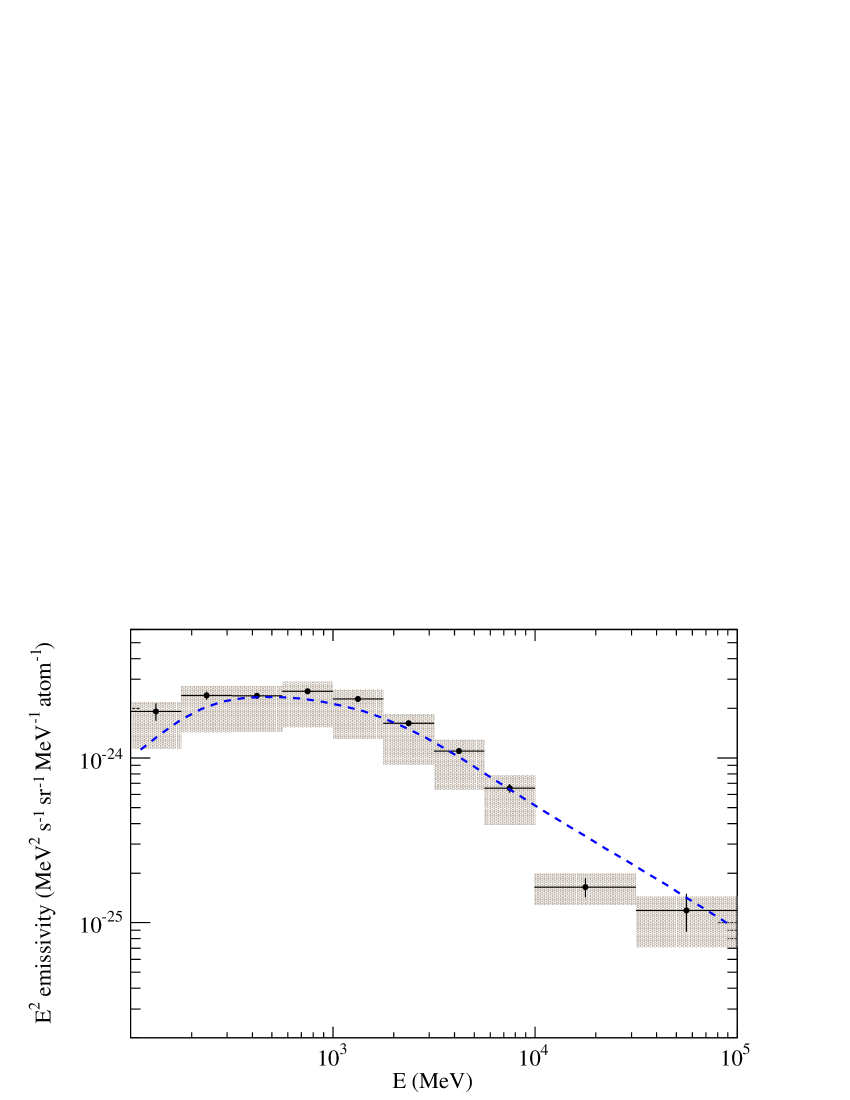
The spectrum is presented for a uniform spin temperature K; systematic uncertainties due to the opacity correction and to the -ray selection efficiency are added in quadrature for display. The latter give a non-negligible contribution only at energies larger than a few GeV.
The emissivity of atomic gas in the Cygnus region, averaged over pc, is consistent with the local emissivity in the MeV– GeV energy range, except for the deviant point at GeV. This can be explained by the difficulty distinguishing the and CO components at high energies, for which the -ray statistics are limited and the hard cocoon source is brighter (Fig. 9). The emissivity spectrum implies that the CR spectra in the relevant energy ranges ( GeV/n for nucleons) are similar to those measured in the vicinity of the Earth and inferred from -ray observations in the nearby interstellar space within kpc.
The variations in average CR densities along the Local Spur between the dense Cygnus complex, two segments in the second and third quadrants that exhibit lower surface densities of gas (Abdo et al. 2010f; Ackermann et al. 2011b), and the mid-latitude diffuse medium with a factor lower surface density (Abdo et al. 2009d) are constrained to within 10% to 35%. This is difficult to reconcile with the idea of a dynamical coupling between gas and CR densities (e.g. Bertsch et al. 1993; Hunter et al. 1997). They are consistent, on the other hand, with the small arm-interarm emissivity contrast estimated from LAT data in the third Galactic quadrant (Ackermann et al. 2011b). In spite of the high column densities of gas, exceeding atoms cm-2 over many directions within the Cygnus complex, we find no hints of excluding CRs from the densest parts of the atomic clouds.
Owing to the bright foreground of the Cygnus complex and individual sources, studying the gas emissivity in the outer disk of the Milky Way in detail is beyond the scope of this study. However, the ratio of the integrated emissivity of the outer region over that in the Local Spur is , in very good agreement with the results by Abdo et al. (2010f) and Ackermann et al. (2011b). It confirms in another direction the presence of high CR densities beyond the solar circle.
Located at a distance of kpc and , the Cygnus complex lies at kpc from the Galactic center, at a slightly smaller radius than the solar system. We measure in this direction an emissivity that is consistent with other values found in the Local Spur and in three outer segments of the Milky Way with Galactocentric radii up to kpc. It yields a decrease in H i emissivity over kpc in Galactocentric radius across and beyond the solar circle. Nevertheless, those measurements span a narrow range in azimuth around the Galactic center and may not be representative enough for comparison with axisymmetric propagation models in order to study the CR gradient across the solar circle .
4.3 CO-bright molecular gas
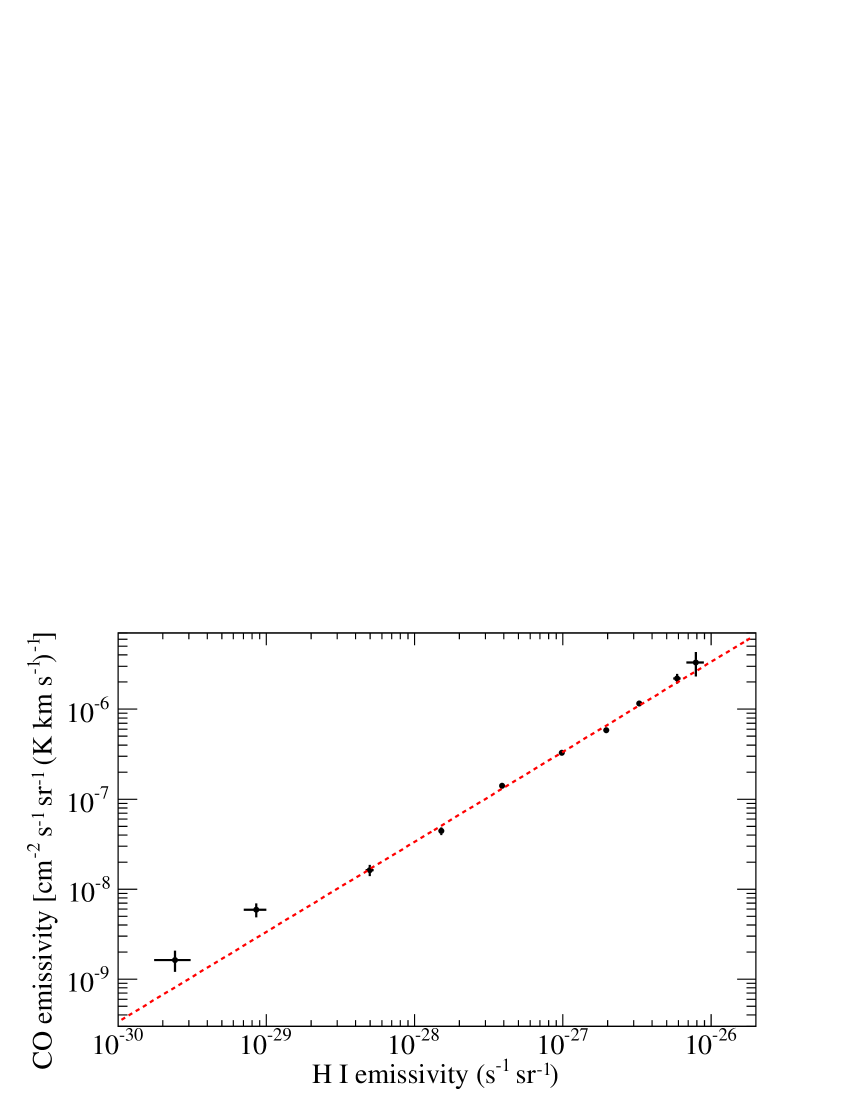
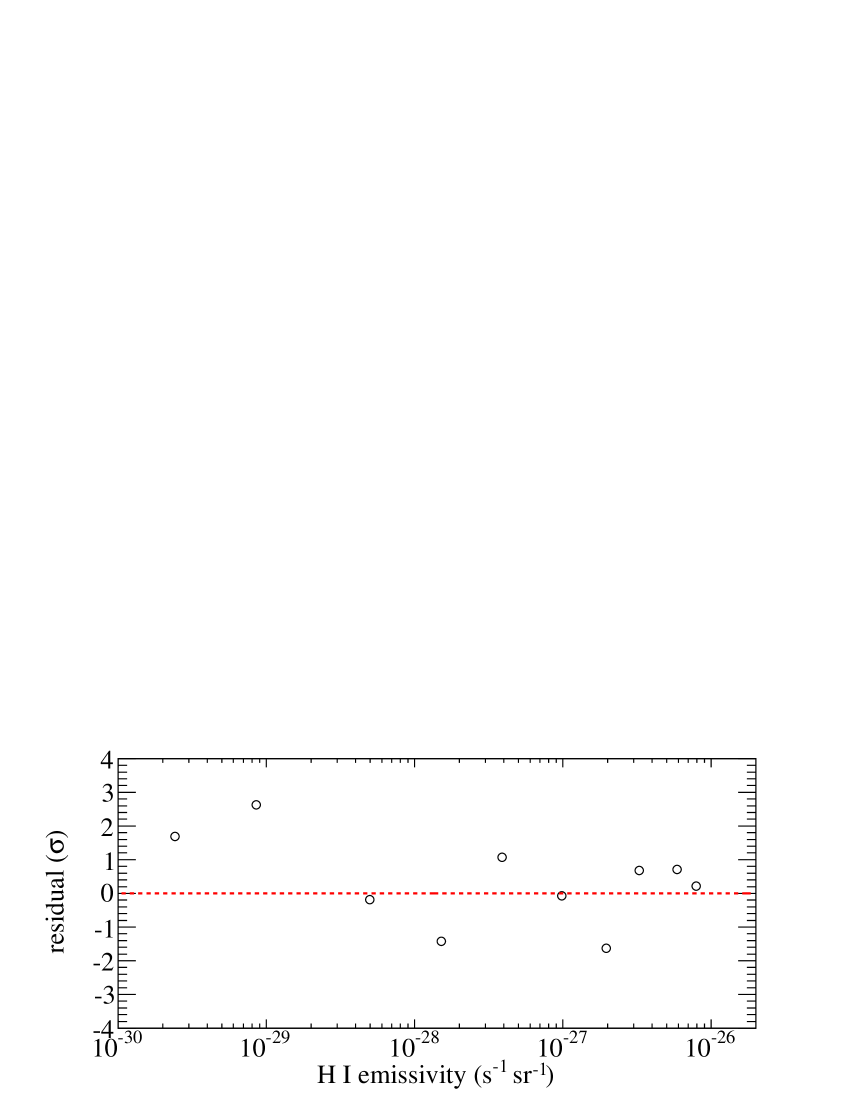
If molecular and atomic gas are illuminated by the same CR fluxes, we expect the emissivity per hydrogen molecule to be twice the emissivity per hydrogen atom, so we can calibrate the ratio. We performed a linear fit, , taking the uncertainties on both emissivities into account to derive the best linear relation shown in Figure 12. We also give the residuals in units of standard deviations.
|
|
A good linearity is found in the 0.1-10 GeV energy range. The highest energy (lowest emissivity) points show excess of emission associated with CO with respect to the ratio determined at low energies. The high CO emissivity recorded at GeV (second point) corresponds to a low emissivity in (Fig. 11) and may result from a fluctuation in the difficult spatial separation between the atomic and molecular components when photons are sparse given the hard source that partially overlaps the CO peaks. Up to GeV, the linearity is good, so there is no sign of CR exclusion from the dense cores of this giant molecular complex.
The slope of the best-fit linear relation provides a value of cm-2 (K km s-1)-1 in the case of K. We obtain cm-2 (K km s-1)-1 in the limit of small optical depth and cm-2 (K km s-1)-1 in the case of K. The uncertainties in associated with the spin temperature are particularly severe for the high-density clouds of the Cygnus complex. High optical depths (low spin temperatures) imply a large increase in , therefore substantially lower CR densities. Given the -ray luminosity of the molecular clouds, this subsequently implies a significant increase in their estimated masses151515The same level of uncertainty would affect the derivation from another total gas tracer such as the dust column-density.. The systematic errors on the -ray selection efficiency cancel out to the first order in the estimate of the ratio.
The conversion factor cm-2 (K km s-1)-1 is consistent with other LAT measurements in the Local Spur, which range from 1.5 to 2 cm-2 (K km s-1)-1 (Abdo et al. 2010f; Ackermann et al. 2011b). From the different -ray measurements in the Galactic plane, the ratio at the solar circle appears well defined. It is, however, significantly greater than in nearby well-resolved clouds off the plane in Cassiopeia and Cepheus (Abdo et al. 2010f). Whether the discrepancy is due to the sampling resolution or to an intrinsic variation on different scales inside a cloud will be investigated in the future.
Using the ratio, we estimated the CO-bright molecular mass in the complex. For this purpose we considered the region at , , where most of the gas associated with the Cygnus complex is located. Assuming a distance of kpc and a mean atomic weight per hydrogen atom in the ISM of , we obtain a mass (where the uncertainties are dominated by the opacity correction). This value (taking the different assumption on the distance into account) is consistent with the results by Schneider et al. (2006) based on higher resolution, multi-isotopolog CO observations, and it depicts Cygnus as a super-massive molecular complex.
The small amount of CO-bright molecular gas in the outer region of the Milky Way in this longitude window (Fig. 4) makes determining its emissivities extremely sensitive to the details of the model (including point sources), so we do not consider it for scientific interpretation.
4.4 Dark neutral gas
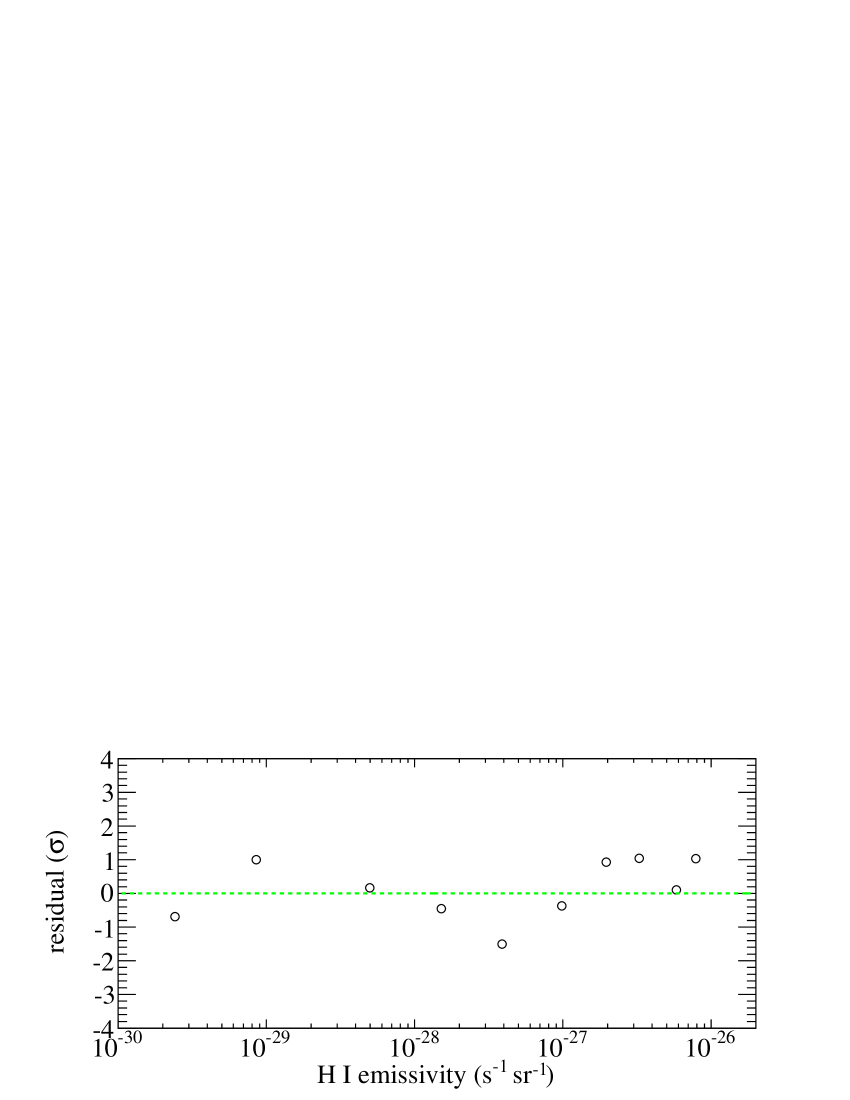
Including the excess map in the model corresponds to an increase of in the logarithm of the likelihood (for ten additional degrees of freedom). This corresponds to a significant detection of -ray emission associated with excesses, formally equivalent to a confidence level. Figure 13 shows the emissivity per unit, , versus the emissivity per hydrogen atom, , in the Cygnus complex. A good linear correlation is found between the two emissivities over three decades in energy, proving that -ray emission associated with excesses comes from the same physical processes as that associated with . residuals therefore trace interstellar gas.

|
|
With a procedure analogous to what is adopted to estimate , we can use the emissivity per hydrogen atom to calibrate the dust-to-gas ratio in the dark neutral phase . We obtain cm-2 mag-1 in the case of K, cm-2 mag-1 in the case of K and cm-2 mag-1 in the case of optically thin medium, so is cm-2 mag-1.
Assuming a standard total-to-selective extinction ratio (Wegner 2003), the dust-to-gas ratio just estimated appears to be higher than the average value in the diffuse ISM, cm-2 mag-1 (Bohlin et al. 1978), and a factor of three higher than what is inferred for the dark phase in local clouds from -ray measurements, cm-2 mag-1 (Grenier et al. 2005; Abdo et al. 2010f). The discrepancy is confirmed by the extinction data. By fitting the latter with the H i and CO maps (§ 2.2.2), we obtained cm-2 mag-1 (statistical error only for K). A possible explanation is provided by an anomalous ratio driven by a peculiar distribution of dust grain sizes (Cardelli et al. 1989). Straižys et al. (1999) indeed report an anomalous extinction law in the Cygnus region, showing stronger extinction in the violet and near UV region.
The chemical state of the dark neutral gas cannot be deduced from -ray observations. Whereas there are compelling theoretical and observational reasons to believe that CO-quiet is ubiquitous in the ISM (e.g. Wolfire et al. 2010; Magnani et al. 2003; Langer et al. 2010), we cannot exclude that part of the dark gas traced by excesses is missing cold atomic gas, especially since the dark neutral phase appears at the interface between the atomic and CO-bright phases in the nearby clouds (Grenier et al. 2005). Temperatures as low as K were measured in cold clouds (Heiles & Troland 2003), and self absorption can be strong when cold clouds are seen against more diffuse warm . The excesses in Fig. 5 partially overlap an self-absorption feature associated with the Cygnus complex (Gibson et al. 2005, Fig. 1d). Nevertheless, the to transition is very dynamical, both in space and time, and it is difficult at this stage to conclude anything about the exact mix of cold dense and diffuse CO-quiet that forms the dark neutral phase in the outskirts of CO-bright molecular clouds.
Regardless of its nature, the mass of the dark neutral gas in the Cygnus complex at kpc amounts to . Adding an atomic mass of and including the CO-bright mass estimated above the total interstellar mass of the Cygnus complex amounts to .
Assuming that all the dark neutral gas is molecular, we can calculate the molecular dark-gas fraction , which amounts to161616The dark neutral gas fraction is very stable against the choice of spin temperature, therefore the error on the dark-gas fraction is only statistical. , in excellent agreement with the model by Wolfire et al. (2010). The dark-gas fraction is also consistent with the one by Abdo et al. (2010f) for the nearby Cepheus and Cassiopeia clouds, which have a factor of two lower column densities and masses of that contained in the Cygnus complex. This also agrees with the prediction by Wolfire et al. (2010) that the dark-gas fraction is fairly independent of the mean cloud column density and total mass for giant molecular clouds.
5 Conclusions
We performed an analysis of -ray emission across the entire Cygnus region measured by the Fermi LAT in the energy range 100 MeV-100 GeV. We built a general model for the region able to satisfactorily reproduce the LAT data. The model includes extended sources that have been detected over the interstellar emission model described here in association with the Cygnus Loop and Cygni supernova remnants and with a cocoon of freshly-accelerated CRs in the innermost part of the Cygnus X region. They are discussed in detail in companion papers.
We measured the average factor for clouds in Cygnus, finding a value cm-2 (K km s-1)-1 that is well consistent with other LAT measurements for cloud complexes in the Local and Perseus spiral arms (Abdo et al. 2010f; Ackermann et al. 2011b). These ratios, averaged over complexes, are, however, significantly higher than the values found at higher sampling resolution in nearby clouds of the Gould Belt (Abdo et al. 2010f). Thanks to the correlation between dust and -ray emission excesses, we detected the presence of conspicuous masses of dark neutral gas not traced by the combination of the H i and CO lines, with total mass of the mass of the clouds traced by CO. The good correlation over three decades in energy between the -ray emissivity per excess unit and per H atom strengthens the interpretation of such excesses as produced by dark neutral gas. The neutral gas in the Cygnus complex, combining atomic, CO-bright, and dark masses, amounts to at a distance of 1.4 kpc.
The emissivity of atomic gas measured over the whole Cygnus complex is consistent with other estimates in the local interstellar space. We do not find evidence of any possible exclusion of CRs by enhanced magnetic fields in the dense clouds. The emissivity per hydrogen atom compares with LAT estimates in other regions of the local and outer Galaxy, regardless of differences in gas surface density by about one order of magnitude and in Galactocentric radius by kpc. This uniformity does not support models based on the dynamical coupling of CRs with matter densities or predicting a strong emissivity gradient toward the outer Galaxy.
The CR population averaged over the whole Cygnus complex ( pc) is similar to the Local Spur average, in spite of the embedded regions of conspicuous massive star-formation and potential CR accelerators. Their impact on the CR population is only detected in the innermost region bounded by the ionization fronts from the massive stellar clusters on a scale pc (Ackermann et al. 2011a). No counterpart to the broadly distributed excess of -ray emission seen at energies TeV at (Abdo et al. 2007, 2008) have been detected at GeV energies so far.
Acknowledgements.
The Fermi LAT Collaboration acknowledges generous ongoing support from a number of agencies and institutes that have supported both the development and the operation of the LAT, as well as scientific data analysis. These include the National Aeronautics and Space Administration and the Department of Energy in the United States, the Commissariat à l’Energie Atomique and the Centre National de la Recherche Scientifique / Institut National de Physique Nucléaire et de Physique des Particules in France, the Agenzia Spaziale Italiana and the Istituto Nazionale di Fisica Nucleare in Italy, the Ministry of Education, Culture, Sports, Science and Technology (MEXT), High Energy Accelerator Research Organization (KEK) and Japan Aerospace Exploration Agency (JAXA) in Japan, and the K. A. Wallenberg Foundation, the Swedish Research Council, and the Swedish National Space Board in Sweden. Additional support for science analysis during the operations phase is gratefully acknowledged from the Istituto Nazionale di Astrofisica in Italy and the Centre National d’Études Spatiales in France. We made use of data from the Canadian Galactic Plane Survey (CGPS). CGPS is a Canadian project with international partners. The Dominion Radio Astrophysical Observatory is operated as a national facility by the National Research Council of Canada. The CGPS is supported by a grant from the Natural Sciences and Engineering Research Council of Canada. We thank T. M. Dame for providing the moment-masked CO data.References
- Abdo et al. (2010a) Abdo, A. A., Ackermann, M., Ajello, M., et al. 2010a, ApJS, 188, 405
- Abdo et al. (2009a) Abdo, A. A., Ackermann, M., Ajello, M., et al. 2009a, Astroparticle Physics, 32, 193
- Abdo et al. (2009b) Abdo, A. A., Ackermann, M., Ajello, M., et al. 2009b, Science, 325, 840
- Abdo et al. (2010b) Abdo, A. A., Ackermann, M., Ajello, M., et al. 2010b, ApJS, 187, 460
- Abdo et al. (2009c) Abdo, A. A., Ackermann, M., Ajello, M., et al. 2009c, Physical Review Letters, 102, 181101
- Abdo et al. (2009d) Abdo, A. A., Ackermann, M., Ajello, M., et al. 2009d, ApJ, 703, 1249
- Abdo et al. (2010c) Abdo, A. A., Ackermann, M., Ajello, M., et al. 2010c, ApJ, 709, L152
- Abdo et al. (2009e) Abdo, A. A., Ackermann, M., Ajello, M., et al. 2009e, ApJ, 700, 1059
- Abdo et al. (2010d) Abdo, A. A., Ackermann, M., Ajello, M., et al. 2010d, A&A, 512, A7
- Abdo et al. (2010e) Abdo, A. A., Ackermann, M., Ajello, M., et al. 2010e, Physical Review Letters, 104, 101101
- Abdo et al. (2009f) Abdo, A. A., Ackermann, M., Ajello, M., et al. 2009f, Science, 326, 1512
- Abdo et al. (2010f) Abdo, A. A., Ackermann, M., Ajello, M., et al. 2010f, ApJ, 710, 133
- Abdo et al. (2008) Abdo, A. A., Allen, B., Aune, T., et al. 2008, ApJ, 688, 1078
- Abdo et al. (2007) Abdo, A. A., Allen, B., Berley, D., et al. 2007, ApJ, 658, L33
- Ackermann et al. (2011a) Ackermann, M., Ajello, M., Allafort, A., et al. 2011a, Science, 334, 1103
- Ackermann et al. (2011b) Ackermann, M., Ajello, M., Baldini, L., et al. 2011b, ApJ, 726, 81
- Ade et al. (2011) Ade, P. A. R., Aghanim, N., Arnaud, M., et al. 2011, A&A, in press, arXiv:1101.2029
- Atwood et al. (2009) Atwood, W. B., Abdo, A. A., Ackermann, M., et al. 2009, ApJ, 697, 1071
- Bertsch et al. (1993) Bertsch, D. L., Dame, T. M., Fichtel, C. E., et al. 1993, ApJ, 416, 587
- Bloemen et al. (1984) Bloemen, J. B. G. M., Bennett, K., Bignami, G. F., et al. 1984, A&A, 135, 12
- Bohlin et al. (1978) Bohlin, R. C., Savage, B. D., & Drake, J. F. 1978, ApJ, 224, 132
- Camilo et al. (2011) Camilo, F., Kerr, M., Ray, P. S., et al. 2011, ApJ, in press, arXiv:1111.4270
- Cardelli et al. (1989) Cardelli, J. A., Clayton, G. C., & Mathis, J. S. 1989, ApJ, 345, 245
- Cash et al. (1980) Cash, W., Charles, P., Bowyer, S., et al. 1980, ApJ, 238, L71
- Cordes & Lazio (2002) Cordes, J. M. & Lazio, T. J. W. 2002, arXiv:astro-ph/0207156v3
- Dame (2011) Dame, T. M. 2011, arXiv:1101.1499
- Dame et al. (2001) Dame, T. M., Hartmann, D., & Thaddeus, P. 2001, ApJ, 547, 792
- Dickey et al. (2009) Dickey, J. M., Strasser, S., Gaensler, B. M., et al. 2009, ApJ, 693, 1250
- Finkbeiner (2003) Finkbeiner, D. P. 2003, ApJS, 146, 407
- Froebrich & Rowles (2010) Froebrich, D. & Rowles, J. 2010, MNRAS, 406, 1350
- Gibson et al. (2005) Gibson, S. J., Taylor, A. R., Higgs, L. A., Brunt, C. M., & Dewdney, P. E. 2005, ApJ, 626, 195
- Gold et al. (2011) Gold, B., Odegard, N., Weiland, J. L., et al. 2011, ApJS, 192, 15
- Green (2009) Green, D. A. 2009, Bulletin of the Astronomical Society of India, 37, 45
- Grenier et al. (2005) Grenier, I. A., Casandjian, J.-M., & Terrier, R. 2005, Science, 307, 1292
- Hanson (2003) Hanson, M. M. 2003, ApJ, 597, 957
- Heiles & Troland (2003) Heiles, C. & Troland, T. H. 2003, ApJ, 586, 1067
- Hobbs et al. (2006) Hobbs, G. B., Edwards, R. T., & Manchester, R. N. 2006, MNRAS, 369, 655
- Hunter et al. (1997) Hunter, S. D., Bertsch, D. L., Catelli, J. R., et al. 1997, ApJ, 481, 205
- Kalberla et al. (2005) Kalberla, P. M. W., Burton, W. B., Hartmann, D., et al. 2005, A&A, 440, 775
- Katagiri et al. (2011) Katagiri, H., Tibaldo, L., Ballet, J., et al. 2011, ApJ, 741, 44
- Ladouceur & Pineault (2008) Ladouceur, Y. & Pineault, S. 2008, A&A, 490, 197
- Langer et al. (2010) Langer, W. D., Velusamy, T., Pineda, J. L., et al. 2010, A&A, 521, L17
- Le Duigou & Knödlseder (2002) Le Duigou, J. & Knödlseder, J. 2002, A&A, 392, 869
- Magnani et al. (2003) Magnani, L., Chastain, R. J., Kim, H. C., et al. 2003, ApJ, 586, 1111
- Mori (2009) Mori, M. 2009, Astroparticle Physics, 31, 341
- Negueruela et al. (2008) Negueruela, I., Marco, A., Herrero, A., & Clark, J. S. 2008, A&A, 487, 575
- Orlando & Strong (2007) Orlando, E. & Strong, A. W. 2007, Ap&SS, 309, 359
- Paladini et al. (2003) Paladini, R., Burigana, C., Davies, R. D., et al. 2003, A&A, 397, 213
- Porter et al. (2008) Porter, T. A., Moskalenko, I. V., Strong, A. W., Orlando, E., & Bouchet, L. 2008, ApJ, 682, 400
- Rando et al. (2009) Rando, R. et al. 2009, arXiv:0907.0626
- Ray et al. (2011) Ray, P. S., Kerr, M., Parent, D., et al. 2011, ApJS, 194, 17
- Robin & Creze (1986) Robin, A. & Creze, M. 1986, A&AS, 64, 53
- Robin et al. (2003) Robin, A. C., Reylé, C., Derrière, S., & Picaud, S. 2003, A&A, 409, 523
- Rowles & Froebrich (2009) Rowles, J. & Froebrich, D. 2009, MNRAS, 395, 1640
- Roy et al. (2011) Roy, A., Ade, P. A. R., Bock, J. J., et al. 2011, ApJ, 727, 114
- Saz Parkinson et al. (2010) Saz Parkinson, P. M., Dormody, M., Ziegler, M., et al. 2010, ApJ, 725, 571
- Schlegel et al. (1998) Schlegel, D. J., Finkbeiner, D. P., & Davis, M. 1998, ApJ, 500, 525
- Schneider et al. (2006) Schneider, N., Bontemps, S., Simon, R., et al. 2006, A&A, 458, 855
- Schneider et al. (2011) Schneider, N., Bontemps, S., Simon, R., et al. 2011, A&A, 529, A1
- Skrutskie et al. (2006) Skrutskie, M. F., Cutri, R. M., Stiening, R., et al. 2006, AJ, 131, 1163
- Sodroski et al. (1989) Sodroski, T. J., Dwek, E., Hauser, M. G., & Kerr, F. J. 1989, ApJ, 336, 762
- Sodroski et al. (1997) Sodroski, T. J., Odegard, N., Arendt, R. G., et al. 1997, ApJ, 480, 173
- Straižys et al. (1999) Straižys, V., Corbally, C. J., & Laugalys, V. 1999, Baltic Astronomy, 8, 355
- Strong & Moskalenko (1998) Strong, A. W. & Moskalenko, I. V. 1998, ApJ, 509, 212
- Strong et al. (2007) Strong, A. W., Moskalenko, I. V., & Ptuskin, V. S. 2007, Annual Review of Nuclear and Particle Science, 57, 285
- Strong et al. (2004) Strong, A. W., Moskalenko, I. V., & Reimer, O. 2004, ApJ, 613, 962
- Sun et al. (2006) Sun, X. H., Reich, W., Han, J. L., Reich, P., & Wielebinski, R. 2006, A&A, 447, 937
- Taylor et al. (2003) Taylor, A. R., Gibson, S. J., Peracaula, M., et al. 2003, AJ, 125, 3145
- Uyanıker et al. (2001) Uyanıker, B., Fürst, E., Reich, W., Aschenbach, B., & Wielebinski, R. 2001, A&A, 371, 675
- Wegner (2003) Wegner, W. 2003, Astronomische Nachrichten, 324, 219
- Weinstein et al. (2009) Weinstein, A. et al. 2009, arXiv:0912.4492
- Wolfire et al. (2010) Wolfire, M. G., Hollenbach, D., & McKee, C. F. 2010, ApJ, 716, 1191