Pitch angles of distant spiral galaxies
Abstract
We have studied the pitch angles of spiral arms for 31 distant galaxies at from three Hubble Deep Fields (HDF-N, HDF-S, HUDF). Using the pitch angle – rotation velocity relation calibrated from nearby galaxies, we have estimated the rotation velocities of galaxies from the deep fields. These estimates have a low accuracy (50 km/s), but they allow low-mass and giant galaxies to be distinguished. The Tully–Fisher relation constructed using our velocity estimates shows satisfactory agreement with the actually observed relations for distant galaxies and provides evidence for the luminosity evolution of spiral galaxies.
1 Introduction
The pitch angle of spiral arms is a major parameter of the classical morphological classification of galaxies (Hubble 1936). The pitch angle is the angle between the tangents to the spiral arm and to the circumference centered at the galaxy nucleus drawn through a given point. Galaxies with tightly wound spirals and open arms have small and large pitch angles, respectively. Typically, the pitch angle lies within the range (Kennicutt 1981; Ma 2001).
In 1981, Kennicutt published a paper in which the relation between the pitch angle of a spiral galaxy and its maximum rotation velocity was studied. It followed from this paper that galaxies with tightly wound arms (smaller pitch angles) rotated, on average, faster than those with more open arms (larger pitch angles), with this dependence being linear. In recent years, investigating the pitch angle of spiral arms has become increasingly popular, because several unexplained empirical relationships of this quantity to the parameters of the galaxy rotation curve and to the mass of the central black hole have been found (see, e.g., Seigar et al. 2008; Shields et al. 2010).
The goal of this paper is to develop the results from Kennicutt (1981) and to try to apply the pitch angle – rotation velocity relation to determine the rotation velocities of distant spiral galaxies from the Hubble Deep Fields HUDF, HDF-N, and HDF-S. Since many of these galaxies are very faint and have small angular sizes, measuring their rotation velocities by spectroscopic methods requires instrumentation that will not be available in the near future. However, knowledge of these velocities is needed to study the evolution of galaxies at high . In addition, there are virtually no data on the pitch angles of spiral arms for distant spiral galaxies at present.
All numerical values in the paper are given for the cosmological model with the Hubble constant 70 km s-1 Mpc-1, , and .
2 Measurements
2.1 Determining the orientation of galaxy disks
An important preliminary stage of our work to study the shape of spiral arms is to estimate the orientation of galaxy disks in space. This orientation is specified by two parameters: the inclination of the disk plane to the plane of the sky and the position angle of the major axis. Knowing these parameters is needed for two reasons. First, because of the galaxy inclination to the plane of the sky, the apparent spiral structure is distorted and, therefore, the galaxy image should be deprojected to the ‘‘face-on’’ orientation. Second, the galaxy rotation velocity derived from spectroscopic measurements should also be corrected for the inclination.
In this paper, we decided to use the relatively new method of spiral-arm monotony (SAM; Poltorak and Fridman 2007; Fridman and Poltorak 2010). This method is based on the assumption that every spiral arm is a monotonic function, i.e., following along the spiral from the galaxy center to the periphery, the radius must increase monotonically (, where is the distance from a point in the spiral arm to the galaxy center and is the azimuthal angle). In this case, the spiral projected onto the plane of the sky can be represented by a nonmonotonic function. Thus, the domain of and for which the deprojected spiral is monotonic will be the domain of possible inclinations and position angles.
An example of using the SAM method to estimate the orientation of four nearby galaxies is shown in Fig. 1. We see from the figure that the domains of possible values are relatively small, which allows both inclination and position angle of the galaxy major axis to be estimated with a good accuracy.

2.2 The pitch angle
Once the galaxy images have been corrected for the inclination, we can turn to the determination of spiral-arm pitch angles. As the published data show, the pitch angles for the same objects often differ markedly. Therefore, for reliability, we decided to implement two different, completely independent methods and to compare their results.
The first method (below called the interactive one) is based directly on the search for the angle between the tangents to the spiral arm and to the circumference centered at the galaxy nucleus. If the spiral arm is represented in polar coordinates: (the coordinate origin at the galaxy center), then the pitch angle for a logarithmic spiral can be determined from the formula (see, e.g., Binney and Tremaine 1987)
| (1) |
The main steps in determining the pitch angle are: (1) determining the coordinates of the galaxy center; (2) finding the polar coordinates of several (10) points on the arm; (3) applying pairwise Eq. (1) to the derived coordinates to obtain the set of pitch angles corresponding to different arm segments; (4) averaging the pitch angles to obtain the final result.
To reduce the random errors, this procedure was repeated several times for each arm. If the galaxy had several (as a rule, two) large-scale arms suitable for measurements, then their pitch angles were also estimated in the same way. As the final pitch angle for a given galaxy, we took the value averaged over the measured arms.
The second method is based on a Fourier analysis of the distribution of points in the spiral arms of a galaxy (Considere and Athanassoula 1982). If the distribution of points in the galaxy arms is represented as the sum of delta functions of their polar coordinates:
| (2) |
where , then its Fourier transform
| (3) |
gives the coefficients in the expansion of this distribution in terms of logarithmic spirals. The pitch angle can be found from the formula
| (4) |
where is the number of spiral arms in the galaxy and is the value of the parameter at which the function has a maximum.
3 Measuring the pitch angles for galaxies of a local sample
3.1 The galaxy sample
To study the spiral pattern of nearby galaxies, we used the galaxy sample described by Kennicutt (1981). The sample includes 113 spiral galaxies of various types with a clearly distinguishable spiral structure. Since the arms of barred galaxies are described more poorly by a logarithmic spiral, most of the sample galaxies are without bars or have small bars.
The galaxy images in the fits format were retrieved from the NED111NASA/IPAC Extragalactic Database, which contains references to observations with different instruments and in different spectral ranges. The pitch angle depends on the filter; for our purposes, we used only the -band images, because the spiral structure is seen best in blue bands. No photometric calibration of the galaxy images was required and, therefore, we used the data obtained with different instruments; from several possible options, we chose the best one from the viewpoint of visual image reduction (where possible, a higher resolution and a better view of the spiral structure).
The maximum rotation velocities of the sample galaxies found from the width of the HI (=21 cm) line profile were retrieved from the HyperLEDA222Lyon-Meudon Extragalactic Database. The HyperLEDA rotation velocity have already been corrected for the inclination found from the apparent flattening of galaxies and, therefore, we initially eliminated this correction and subsequently applied it again using the galaxy inclination estimated by the SAM method (see below).
3.2 Measuring the pitch angle
For all galaxies from the sample by Kennicutt (1981), we estimated their orientation parameters, the inclination and position angle of the major axis, by the SAM method. The agreement of our inclinations with those in HyperLEDA is, on average, good: . However, for several galaxies, the apparent isophote flattening method gives, obviously, incorrect values due to various kinds of peculiarities in the shapes of the outer isophotes of galaxies.
The SAM method has a limitation at low inclinations (i.e., when the galaxies are seen almost face-on): the error in the and estimates increases greatly with decreasing inclination. For this reason, we failed to estimate the orientation parameters for 16 galaxies and they were excluded from our sample, in which, thus, 97 objects remained.
Once the images have been deprojected, we determined the spiral-arm pitch angle for each galaxy by the two methods. At this step, we excluded several more galaxies with an excessively irregular and asymmetric structure from our sample. We failed to find the maximum rotation velocities for four galaxies. In addition, we decided to restrict ourselves to the galaxies with inclinations in the range , because both pitch angles and maximum rotation velocities can be reliably estimated for such galaxies and their pitch angle – rotation velocity relation (see below) is seen much better. As a result, 46 galaxies remained in our sample of nearby galaxies with pitch angles measured by the two methods and with known rotation velocities, 43 and 3 of which have two-armed and three-armed spiral patterns, respectively.

Figure 2 compares our pitch-angle measurements with the results from Kennicutt (1981) for both methods. The straight lines indicate linear fits to the data. They suggest the existence of certain systematics in the pitch-angle measurements probably attributable to the difference between the methods used. The mean differences between the measurements for the same galaxies are small: (the difference between the pitch angle measured by the first (interactive) method and the angle measured by Kennicutt) and (the same for the second method).
Comparison of the two pitch-angle determination methods described above shows good mutual agreement between the results: the difference between the angles estimated by the Fourier and interactive methods is . Both methods yield similar results, although, formally, the accuracy of the method based on a Fourier analysis is higher.
Figure 3 shows the logarithmic spirals constructed from the spiral-pattern parameters we determined and, given with the galaxy inclinations and position angle, they were superimposed on the observed images of NGC 2997 and NGC 4254.
3.3 The pitch angle – rotation velocity relation for nearby galaxies
Figure 4 shows the pitch angle – rotation velocity relations constructed by the two methods. As we see from the figure, both approaches give significant correlations. However, the relation constructed from the measurements using the Fourier transform has a higher statistical significance (the linear correlation coefficient for it is 0.725 versus 0.600 for the relation constructed by the interactive method). In our subsequent discussion, we will use the pitch angles found by a Fourier analysis. Note also that the galaxies with a three-armed pattern in Fig. 4 are near the average relation for galaxies with a two-armed pattern.

The final empirical relation found from 46 nearby galaxies (the solid straight line in Fig. 4b) is
| (5) |
Curiously, our Galaxy may satisfy this relation. It follows from Eq. (5) that for the Milky Way with km/s. This pitch angle is close to the estimates of various authors (see, e.g. Tables 1 and 2 in Vallee 2005). However, greatly differing pitch angles of the Milky Way spiral pattern are also encountered in the literature (see, e.g., Levine et al. 2006).
4 Measuring the pitch angles for galaxies from the deep fields
4.1 The galaxy sample
To find distant galaxies with a spiral structure, we used the original frames of the Hubble Deep Fields HDF-N and HDF-S (Ferguson et al. 2000) as well as the Ultra Deep Field HUDF (Beckwith et al. 2006). The main problem in compiling the sample was that the angular sizes of many distant galaxies are too small and, therefore, several objects with a distinct spiral structure were not included in the sample to avoid the errors due to image discreteness. In addition, a considerable number of deep-field galaxies appear asymmetric and peculiar and no regular spiral arms can be drawn for them.
Our final sample includes 31 galaxies (20 in HUDF, six in HDF-N, and five in HDF-S) with a clearly distinguishable spiral pattern, as a rule, a two-armed ones as in the case of nearby galaxies. The mean redshift of these galaxies is . Our list of distant galaxies is presented in the table.
4.2 Measurements
For all sample galaxies, we downloaded their images in the F606W filter, because this is the only common filter for all three fields. To estimate the orientation of distant galaxies, we used the SAM method. In the cases where this method yielded no definite results, we estimated the inclination and orientation from the outer isophotes of the galaxies. (Such objects were discarded among the nearby galaxies but were retained among the distant galaxies, because of the small size of their sample. Their inclinations are marked by the asterisk in the table.)
The results of our measurements of the inclination () and spiral-pattern pitch angle () are summarized in the table. If a galaxy has only one arm suitable for measurements, the results are presented only for it. The galaxy redshifts (the fourth column of the table) were taken from Wolf et al. (2004) (the COMBO-17 project) for HUDF, from Wirth et al. (2004) for HDF-N, and from Sawicki and Mallen-Ornelas (2003) for HDF-S. (We used the redshift for the HUDF galaxy No. 16 from Coe et al. (2006), because from Wolf et al. (2004) leads to an unrealistically low luminosity of the galaxy.) The eighth column of the table presents the maximum rotation velocity found from the empirical relation (5) and its error. We estimated the rotation-velocity error using the formula for the propagation of the mean error (the formula for the error of a function of several variables) from the pitch angle measurement error and the errors of the numerical coefficients in Eq. (5). The fifth column gives the absolute magnitudes of the galaxies in the Hubble Space Telescope F606W filter. To find the absolute magnitudes, we used the -corrections for galaxies of the corresponding types from Bicker et al. (2003).
| No. | RA | DEC | |||||
| (∘) | (∘) | (km/s) | |||||
| HUDF | |||||||
| 1 | 03:32:39.26 | -27:45:32.37 | 0.917 | -20.76 | 37 | 16.4 0.4 | 129 42 |
| 2 | 03:32:42.81 | -27:46:05.72 | 0.667 | -22.35 | 58 | 17.8 0.4 | 101 40 |
| 3 | 03:32:35.77 | -27:46:27.62 | 1.007 | -20.52 | 57 | 8.9 0.5 | 280 60 |
| 4 | 03:32:38.97 | -27:46:30.30 | 0.457 | -21.05 | 49 | 12.5 0.9 | 208 53 |
| 5 | 03:32:46.10 | -27:47:13.94 | 1.122 | -21.97 | 46 | 17.8 0.7 | 101 41 |
| 6 | 03:32:39.87 | -27:47:14.98 | 1.086 | -23.00 | 41 | 15.5 0.7 | 147 45 |
| 7 | 03:32:34.10 | -27:47:12.13 | 0.153 | -18.24 | 76 | 20.3 1.3 | 51 37 |
| 8 | 03:32:31.35 | -27:47:24.92 | 0.656 | -17.90 | 68 | 19.2 0.7 | 93 44 |
| 9 | 03:32:44.86 | -27:47:27.65 | 0.187 | -20.75 | 58 | 12.0 0.7 | 218 53 |
| 10 | 03:32:45.07 | -27:47:38.65 | 0.349 | -20.76 | 70 | 15.8 1.6 | 141 53 |
| 11 | 03:32:39.17 | -27:48:44.63 | 0.472 | -22.36 | 56 | 9.3 0.8 | 272 61 |
| 12 | 03:32:34.52 | -27:48:48.38 | 0.236 | -21.40 | 43 | 11.5 1.0 | 228 56 |
| 13 | 03:32:42.28 | -27:47:46.16 | 0.939 | -22.65 | 48 | 16.3 0.8 | 131 45 |
| 14 | 03:32:43.25 | -27:47:56.18 | 0.677 | -21.95 | 46 | 15.2 0.4 | 153 44 |
| 15 | 03:32:41.34 | -27:45:54.42 | 0.533 | -20.42 | 17* | 19.5 0.7 | 67 39 |
| 16 | 03:32:38.34 | -27:45:44.29 | 1.314 | -21.46 | 29* | 10.2 0.7 | 254 58 |
| 17 | 03:32:40.78 | -27:46:15.72 | 0.627 | -22.41 | 33* | 14.6 0.8 | 165 48 |
| 18 | 03:32:33.04 | -27:47:30.89 | 1.064 | -22.25 | 33* | 15.4 1.9 | 162 49 |
| 19 | 03:32:37.87 | -27:47:51.13 | 0.795 | -21.16 | 25* | 10.2 1.3 | 254 62 |
| 20 | 03:32:39.80 | -27:46:53.57 | 0.996 | -21.23 | 26* | 17.9 0.9 | 99 43 |
| HDF-S | |||||||
| 1 | 22:32:47.57 | -60:34:08.59 | 0.579 | -21.41 | 52 | 11.1 0.8 | 236 46 |
| 2 | 22:33:03.57 | -60:33:41.67 | 0.734 | -23.50 | 45 | 10.6 1.1 | 249 56 |
| 3 | 22:32:47.65 | -60:33:35.87 | 0.581 | -22.92 | 50 | 8.1 1.1 | 296 66 |
| 4 | 22:33:00.24 | -60:32:34.03 | 0.415 | -21.04 | 41 | 14.2 0.8 | 173 49 |
| 5 | 22:32:57.99 | -60:32:34.32 | 0.761 | -21.83 | 45 | 16.0 1.4 | 137 51 |
| HDF-N | |||||||
| 1 | 12:36:45.86 | +62:13:25.87 | 0.320 | -19.91 | 29 | 7.9 1.4 | 300 68 |
| 2 | 12:36:48.72 | +62:13:19.40 | 0.753 | -20.73 | 16 | 19.1 1.1 | 75 43 |
| 3 | 12:36:50.22 | +62:12:39.74 | 0.474 | -21.42 | 57 | 13.6 1.0 | 185 51 |
| 4 | 12:36:56.65 | +62:12:45.32 | 0.518 | -21.59 | 67 | 14.0 1.1 | 177 51 |
| 5 | 12:36:46.14 | +62:11:43.10 | 1.016 | -23.07 | 0* | 13.6 0.6 | 185 49 |
| 6 | 12:36:43.18 | +62:11:48.00 | 1.007 | -21.45 | 35 | 12.0 0.4 | 218 52 |
5 Comparison of the local and distant galaxies
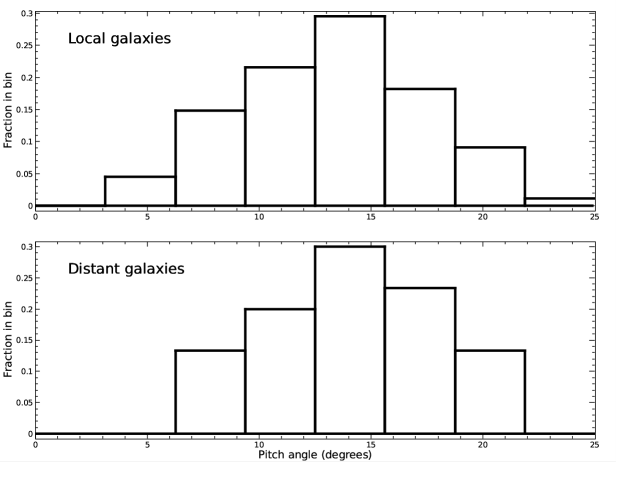
Figure 5 presents the histograms showing the pitch-angle distributions for the local-sample galaxies and for the galaxies from the deep fields. We see good agreement in the distribution of angles: a maximum near 14∘ and a gradual decline on both sides of the maximum. Thus, one might expect the distributions of rotation velocities for galaxies at different to be similar.
Using the maximum rotation velocities of distant galaxies estimated from the empirical relation (5) (the table), we constructed their Tully–Fisher (TF) relation (Fig. 6). The solid line in the figure indicates the relation for nearby galaxies in the same color band (Sakai et al. 2000). As we see from the figure, the distant galaxies are located on this plane with approximately the same slope as that for the nearby galaxies, but their distribution appears shifted towards higher luminosities. The value of this shift depends on the galaxy redshift: the galaxies at , on average, follow the local relation, while those at are shifted upward (Fig. 6).

The most probable cause of the systematic shift in the positions of distant galaxies is the evolution of their luminosity. As was shown in numerous works devoted to studying the evolution of the TF relation and the galaxy luminosity function, spiral galaxies at are brighter than nearby galaxies with the same maximum rotation velocity by (see, e.g., Table 1 in Portinari and Sommer-Larsen 2007). The right panel of Fig. 6 shows the TF relation corrected for the luminosity evolution of distant galaxies (the evolution correction was applied as prescribed by Bicker et al. 2003). As we see from the figure, allowance for the luminosity evolution slightly improved the agreement between the relations for distant and nearby galaxies.
Consider two subsamples approximately equal in size – galaxies with (15 objects) and (16 galaxies). The mean characteristics of the first subsample are (the standard error of the mean is given), (only the -correction was applied), and km/s; the characteristics of the second subsample are , , and km/s.
Using the local TF relation from Sakai et al. (2000), we can estimate the expected absolute magnitude for a galaxy with km/s to be and for a galaxy with km/s to be . The mean observed magnitude for galaxies with is brighter than the expected one by and for the more distant subsample by . According to the model by Bicker et al. (2003), the corresponding values of the luminosity evolution for Sb-Sc galaxies are 0.m3–0.m5 and 0.m6–0.m9. Given the approximate nature of our method for estimating the rotation velocities and the small size of the galaxy sample, it may be concluded that the shift of distant galaxies in the TF relation observed in Fig. 6 agrees satisfactorily with that expected from the luminosity evolution with .
6 Conclusions
We determined the spiral-arm pitch angles for 46 nearby galaxies with by two different methods (the interactive one and using a Fourier analysis of images). The inclination of the galaxy plane to the line of sight was found by the relatively new method of spiral-arm monotony (Poltorak and Fridman 2007; Fridman and Poltorak 2010).
We confirmed the conclusion by Kennicutt (1981) about the existence of a significant correlation between the rotation velocity of a galaxy and the pitch angle of its spiral arms. This correlation is best traced for intermediate galaxy disk inclinations, when both pitch angles and rotation velocities can be found with a good accuracy.
We measured the pitch angles for 31 spiral galaxies from several Hubble Deep Fields at mean redshift . Using the local empirical pitch angle – rotation velocity relation, we estimated the maximum rotation velocities of distant galaxies (the table). These estimates have a low accuracy ( km/s, see the table), but they allow low-mass and giant galaxies to be confidently distinguished.
We constructed the TF relation between the absolute magnitudes and maximum rotation velocities of distant galaxies estimated from the pitch angles of the spiral pattern. Despite the large scatter of data, we can tentatively conclude that the distant galaxies follow the local TF relation with approximately the same slope and, in addition, show evidence of luminosity evolution. These results agree with the direct measurements of the TF relation for distant galaxies by spectroscopic methods.
The ‘‘morphological’’ estimates of the rotation velocities for distant galaxies can be useful in studying the evolution of spiral galaxies, especially in the cases where no data on the rotation of a galaxy can be obtained by spectroscopic methods because of its faintness or its visibility conditions (the galaxy is seen almost face-on).
REFERENCES
1. S.V.W. Beckwith, M. Stiavelli, A.M. Koekemoer, et al., Astron. J. 132, 1729 (2006).
2. J. Bicker, U. Fritze-v. Alvensleben, C.S. Moller, and K. J. Fricke, Astron. Astrophys. 413, 37 (2004).
3. J. Binney and S. Tremaine, Galactic Dynamics (Princeton Univ. Press, Princeton, 1987).
4. D. Coe, N. Benitez, S.F. Sanchez, et al., Astron. J. 132, 926 (2006).
5. S. Considere and E. Athanassoula, Astron. Astrophys. 111, 28 (1982).
6. H.C. Ferguson, M.Dickinson, and R. Williams, Ann. Rev. Astron. Astrophys. 38, 667 (2000).
7. A.M. Fridman and S.G. Poltorak, Mon. Not. R. Astron. Soc. 403, 1625 (2010).
8. E. Hubble, The Realm of the Nebulae (Oxford Univ. Press, 1936).
9. R.C. Kennicutt, Jr., Astron. J. 86, 1847 (1981).
10. E.S. Levine, L. Blitz, and C. Heiles, Science 312, 1773 (2006).
11. J. Ma, Chin. J. Astron. Astrophys. 1, 395 (2001).
12. S.G. Poltorak and A.M. Fridman, Astron. Rep. 51, 460 (2007).
13. L. Portinari and J. Sommer-Larsen, Mon. Not. R. Astron. Soc. 375, 913 (2007).
14. S. Sakai, J.R. Mould, Sh.M.G. Hughes et al., Astrophys. J. 529, 698 (2000).
15. M. Sawicki and G. Mallen-Ornelas, Astron. J. 126, 1208 (2003).
16. M.S. Seigar and P.A. James, Mon. Not. R. Astron. Soc. 299, 685 (1998).
17. M.S. Seigar, D. Kennefick, J. Kennefick, and C.H.S. Lacy, Astrophys. J. 678, L93 (2008).
18. D.W. Shields, J.A. Hughes, R.S. Barrows, et al., Bull. Am. Astron. Soc. 42, 381 (2010).
19. J.P. Vallee, Astron. J. 130, 569 (2005).
20. G.D. Wirth, Ch.N.A. Willmer, and P. Amico, Astron. J. 127, 3121 (2004).
21. C. Wolf, K. Meisenheimer, A. Borch, et al., Astron. Astrophys. 421, 913 (2004).