Measurements of Growth Rates of (0001) Ice Crystal Surfaces
K. G. Libbrecht and M. E. Rickerby
Department of Physics, California Institute of Technology
Pasadena, California 91125
Abstract. We present measurements of growth rates of the (0001) facet surface of ice as a function of water vapor supersaturation over the temperature range C. From these data we infer the temperature dependence of premelting on the basal surface and the effects of premelting on the ice growth dynamics. Over this entire temperature range the growth was consistent with a simple 2D nucleation model, allowing a measurement of the critical supersaturation as a function of temperature. We find that the 2D nucleation barrier is substantially diminished when the premelted layer is partially developed, as indicated by a reduced while the barrier is higher both when the premelted layer is fully absent or fully developed.
1 Introduction
It has long been long suspected that premelting in ice plays an important role in the growth dynamics of ice crystals from water vapor [1, 2, 3]. Although ice is a monomolecular crystal with a simple hexagonal structure under normal atmospheric conditions, ice crystals forming from water vapor exhibit an exceedingly rich spectrum of plate-like and columnar morphologies as a function of temperature and supersaturation over the temperature range C [3]. Since the premelted layer in ice develops over this same temperature range [4, 5, 6], the prevailing thinking holds that temperature-dependent effects of premelting on ice crystal growth are responsible for the observed morphological complexities, together with instabilities arising from diffusion-limited growth and other effects [3]. To date, however, this long-held hypothesis has remained largely unsupported by solid experimental evidence.
We sought to shed light on this problem by making precise measurements of the growth rates of small faceted ice crystals from water vapor under carefully controlled conditions, in order to better quantify the intrinsic ice growth behavior. To this end we measured growth rates of (0001) ice surfaces as a function of water vapor supersaturation and temperature over the temperature range C. Our measurements were made at low background pressure to reduce the effects of particle diffusion, so the growth was mainly limited by attachment kinetics.
As we will show below, our measurements were all consistent with a simple 2D nucleation model of crystal growth, and from our data we extracted the critical supersaturation as a function of temperature. The function showed an interesting behavior from which we were able to infer the onset and development of premelting on the ice surface as well as how premelting affects crystal growth in ice.
2 Ice Crystal Growth Measurements
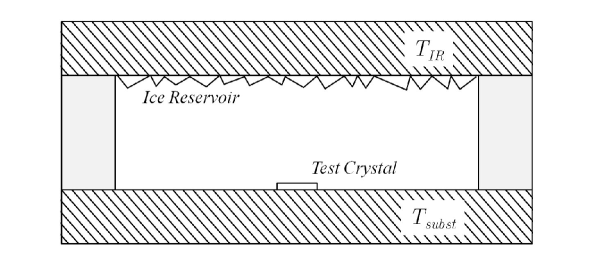
The goal of our ice growth experiments was to examine the growth of individual ice crystals in a carefully controlled environment, and an idealized schematic diagram of our experimental set-up is shown in Figure 1. The top surface of the experimental chamber was a thermal conductor with a uniform temperature and its inside surface was covered with a layer of ice crystals that made up an ice reservoir. At the beginning of each measurement, a single test crystal was placed near the center of the bottom substrate surface held at temperature . The walls were thermally insulating, and the vertical spacing from the top to the bottom of the chamber was 1.0 mm. The temperature difference determined the effective supersaturation seen by the test crystal. During the course of a measurement we increased and observed the size and thickness of the test crystal as a function of time, and from this we extracted crystal growth velocities as a function of supersaturation. A detailed hardware description is provided in [7]. Some important aspects of the experiment included:
1) Our test crystals were small, thin plates, typically m thick and m in diameter. This was important to reduce the effects of particle and heat diffusion, as described quantitatively in [7].
2) We used crystals with one basal facet in contact with the substrate, measuring the perpendicular growth of the opposite (0001) surface using broad-band interferometry as described in [7]. Growth of the prism facets was affected by substrate interactions, particularly at low supersaturations, so these measurements were discarded.
3) We used only crystals with simple morphologies and well formed facets, and each crystal was discarded after growth. Evaporating and regrowing crystals was found to result in generally lower quality data.
4) Our test crystals were freshly made in a clean environment and transported within minutes to our test chamber with minimal processing, as described in [7].
With these precautions, and exercising considerable care to create a stable growth environment with precisely known supersaturations, we were able to obtain quite satisfactory data, and an example is shown in Figure 2. Here we have plotted the effective attachment coefficient , which is derived from the perpendicular growth velocity using where is the supersaturation far from the crystal and is a kinetic velocity [3, 7].
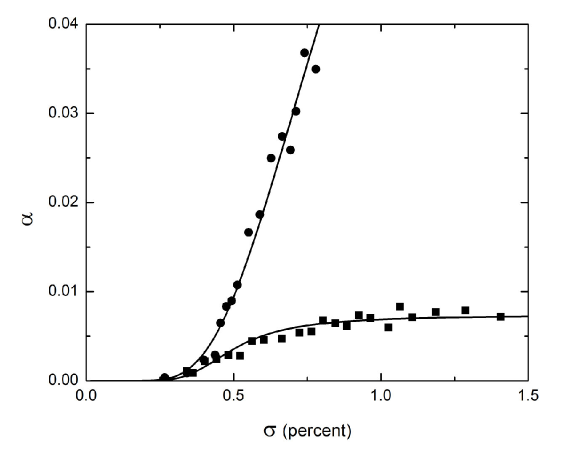
For our main data set, each crystal was grown at a pressure near 20 Torr, where the growth was predominantly limited by attachment kinetics, at least for small crystals at low supersaturations. For essentially all our data, we found that the basal growth was well described by a 2D nucleation model [9], and to describe the growth we adopted a simplified parameterization of the intrinsic attachment coefficient where and are parameters that may depend on temperature but not on supersaturation.
At high supersaturations our data were distorted by the effects of particle and heat diffusion, so we modeled our data by fitting to the functional form
| (1) |
as described in [7]. To produce more stable fits in our analysis, we adjusted and while keeping the scale factor fixed, and we chose to give the physically reasonable result that as becomes large. In Figure 2, for example, the fit parameters are = and for the low-pressure and high-pressure crystals, respectively. As described in [7], the value of depended mainly on the background pressure as well as the size and thickness of each test crystal, so this parameter was of little physical interest in our later analysis; the main focus in this experiment was on measuring the critical supersaturation as a function of temperature.
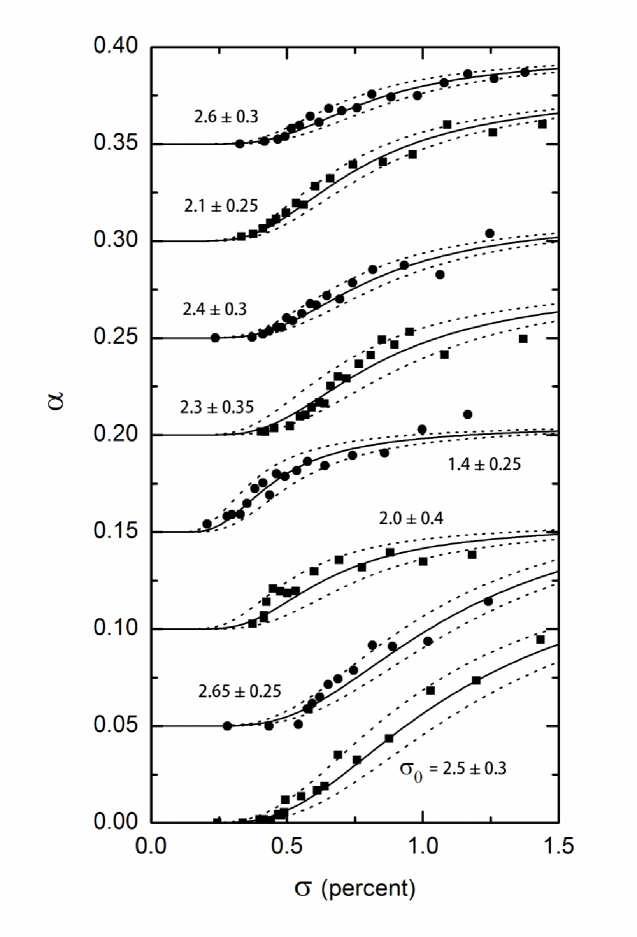
Figure 3 shows data from a typical six-hour run. Although each crystal took only about ten minutes to measure, finding suitable crystals added time, plus there was additional procedural overhead, so the experiment ended up taking about 45 minutes per crystal. For each measurement, like those shown in Figure 3, we generated curves bracketing the fit curves as a visual means of producing an error estimate for each measured . The dotted lines in Figure 3 show the fit curves for each data set except with replaced by in the fitting function Equation 1. In total, 102 crystals were measured and fit in this way to produce our primary reduced data set.
We combined the individual measurements at each temperature by weighting each measurement with our estimated for that measurement, thus producing a weighted mean at each temperature along with an uncertainty estimate for the mean [8]
where is the effective number of points in the sample at each temperature.
We examined our data fitting and analysis practices carefully and reached several conclusions: 1) Nearly all our data were well fit by Equation 1, consistent with a simple 2D-nucleation model distorted by particle diffusion; 2) Roughly ten percent of the crystals sampled grew very rapidly, with essentially no nucleation barrier [11]. These crystals may have had dislocations, and they were discarded from our data. These crystals were obviously different from the norm, however, and we do not believe this practice was detrimental to our analysis; 3) Our fits were quite robust to the critical supersaturation since this term was determined mainly by the growth behavior at low while diffusion predominantly affected the high- growth. Since our data were taken at low pressure, the inclusion of mainly helped fit the higher- part of the each curve, which was useful for producing a better global fit.
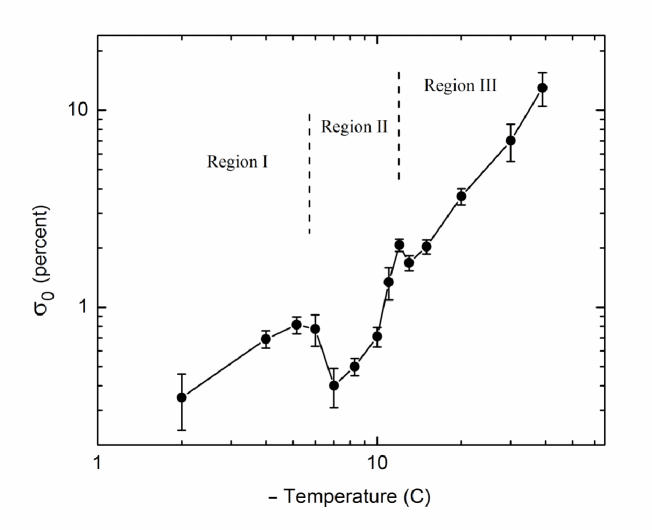
Averaging our data at each temperature yielded the final measurement of the critical supersaturation as a function of temperature shown in Figure 4, which is the principal result from our experiment. Here the current set of measurements includes only data points for C; the last two data points in Figure 4 were taken from [10], which was a previous version of the present experiment.
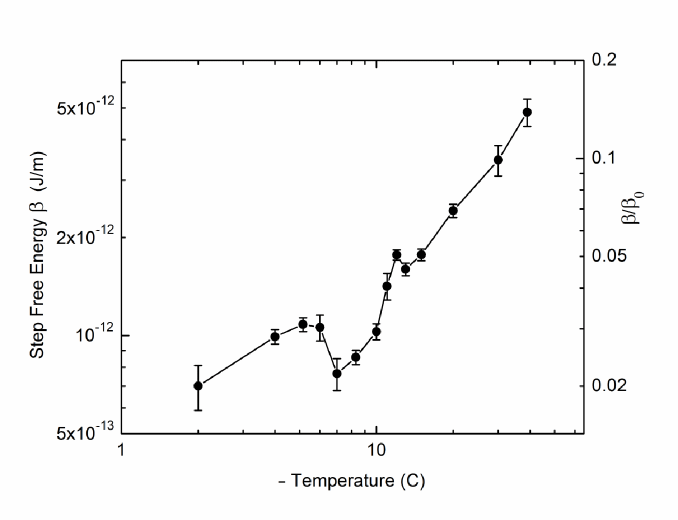
Since the crystal growth we observed was everywhere well described by a 2D nucleation model, the measured critical supersaturation can be used to calculate the step free energy using
where is the area of a molecule on the surface, a relation that comes from classical 2D nucleation theory [9, 10]. A plot of from our data is shown in Figure 5. We note from the scale on the right side of Figure 5 that is much smaller than J/m, the product of the surface energy J/m2 of the ice/vapor interface and the nominal molecular step height nm, which is an upper limit on the step energy [10]. Since the step energy is an equilibrium quantity, its calculation using perturbation techniques or molecular dynamics simulations may be a tractable problem, so this is an area for further research.
2.1 The Prefactor
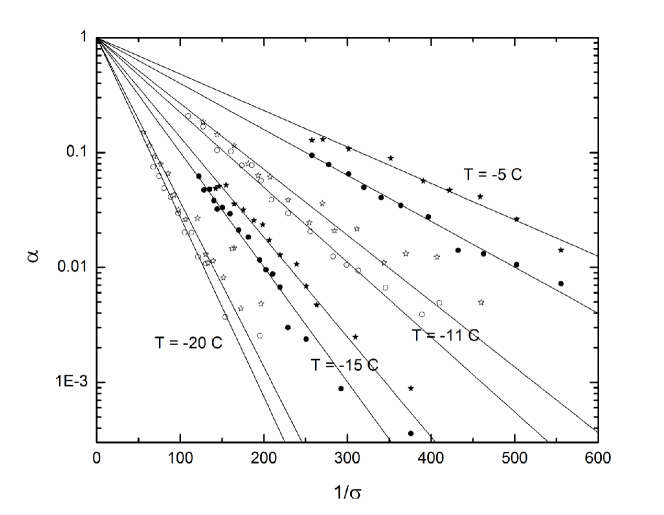
A remaining question concerns our choice to use a constant prefactor in our fitting procedure, and our choice of the numerical value of We explored this question at some length by examining the behavior of our data, and an example is shown in Figure 6. The eight crystals displayed in this plot were chosen because they exhibited well-behaved growth profiles with minimal growth perturbations from diffusion, and the residual diffusion effects were fit and corrected before plotting the data. If the growth satisfies a nucleation model with then by plotting the data as shown in Figure 6, the extrapolated data should intercept the axis at the point where The lines drawn through the points used the individual fit values as described above, which assumed .
By examining our data in this fashion, both with and without diffusion corrections, it became clear that a prefactor of was a good approximation for the full range of temperatures we measured, at least to an accuracy of about a factor of two. It was difficult to make an accurate measurement of however, because this involved extrapolating our data, and such a measurement was somewhat affected by diffusion effects. Including as a free parameter in our fitting procedure for individual crystals gave the fits too many degrees of freedom and produced unstable results. We therefore chose to fix and we chose from what was essentially a global fit to the data at all temperatures. As mentioned above, this value also gives the physically reasonable result that as becomes large.
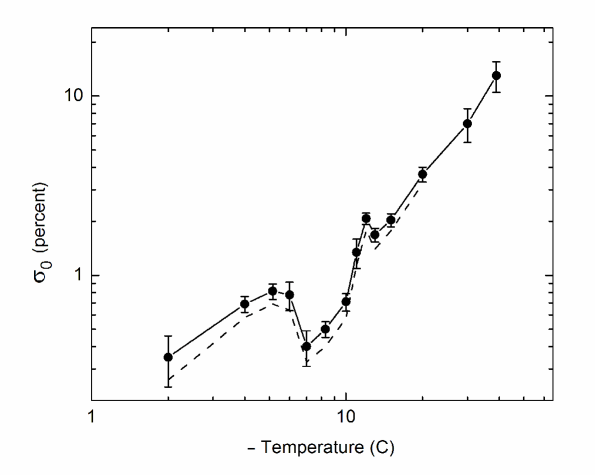
To see whether our choice of had a strong effect on our final results, we performed an exercise of changing from to and reanalyzing our data. For this we refit each crystal to Equation 1 using , generating a new and for each crystal, and from the new data set we recombined the data at each temperature, following the procedure outlined above. The results are shown in Figure 7. The points, error bars, and the solid line in this figure are identical to Figure 4, showing the original analysis with The new analysis with produced a new set of points shifted downward, and these are shown as a dashed line in the figure; the error bars are essentially unchanged from the original analysis.
Although gives a somewhat better global fit to our data, a value of is not outside the range of potential systematic errors in our experiment. From our analysis including plots like that shown in Figure 6, we believe that is probably accurate to within a factor of two or better. However we see from Figure 7 that changing by a factor of two produced only a modest shift in our final measurement of
3 Interpretation and Discussion
In summary, we measured growth velocities of the (0001) surface of ice as a function of water vapor supersaturation over the temperature range From the measured growth velocities we extracted the intrinsic attachment coefficient using where here is the supersaturation immediately above the ice surface. Over the entire temperature range, and for all supersaturations measured, our data were well described by a simple 2D nucleation model using an attachment coefficient A global fit to the data yielded the constant prefactor , accurate to better than a factor of two over our entire temperature range. Fits to the data at each temperature yielded the measured critical supersaturation shown in Figure 4.
Referring to Figure 4, let us now examine several different temperature regions and discuss the behavior of in detail.
Region III: [ C]. In this temperature region we see a simple power-law behavior in which was observed previously in [10]. From the data in Region III we have percent and J/m, where for both these is in degrees
We believe premelting is essentially absent in this temperature region, meaning that whatever premelting effects do exist are too small to affect the ice growth dynamics. We have no theoretical explanation for the observed temperature dependence of . As the temperature increases, however, we might expect that surface restructuring would be more likely to smooth out the edge of a 2D island, thus lowering the step energy. Quantitative calculation of this effect is an area for further research.
The peak at C. We examined the small peak in at this temperature rather carefully, and it does not appear to be a statistical fluctuation, nor could we find any systematic effect in our measurements that would produce a peak at this temperature. The same peak was reproduced at roughly the same height in three separate runs. We concluded that the peak is a real feature that probably coincides with the onset of premelting on the (0001) surface of ice at C. This onset temperature agrees with that measured by [6], which is another premelting measurement using a surface preparation similar to that used in the current experiments. This temperature is also just below the large dip in that we believe indicates a region of partial premelting (see Region II below). It is not obvious why the onset of premelting would result in a peak in however. For this we can only speculate some unknown many-body phenomenon at the surface.
Our measurements suggest somewhat counterintuitively that ice growth at the nearby temperatures of C and C could be qualitatively different under some circumstances, which could be investigated in other experiments. Another interesting note is that this is the first time the onset of premelting has appeared in any measurement as a sharp feature. This suggests that additional exploration of the detailed growth dynamics of the (0001) surface of ice near C could be fruitful.
Region II: [ C]. In this region we believe that premelting is partially developed on the (0001) surface. Our intended meaning here of “partially developed” is that premelting produces a partially nonfaceted surface that enhances nucleation and thereby results in the lower values of measured, as was previously suggested by Kuroda and Lacmann [1]. Here, as in [1], we cannot define a detailed molecular model, since the surface molecular dynamics must be quite complex at these temperatures. One’s normal picture of a static solid surface with a small number of admolecules is certainly too simplistic here. Nevertheless, our data show that the growth is still well fit by a nucleation model with We therefore put forth a simple picture in which a partially developed premelted layer produces a dip in in this temperature region. This picture is supported by our measurements even if we cannot yet specify a molecular model of the ice surface dynamics.
Region I: [ C]. At these temperatures we suggest that the premelted layer has become fully developed, leading to an increase in compared to that in Region II, again following [1]. Here our picture is that of a solid ice surface covered by a thick quasi-liquid layer (QLL), with 2D nucleation occurring at the ice/QLL interface. Because the ice/QLL interface is a smooth, faceted surface, is higher than that found on a partially premelted surface. To our knowledge, this is the first time that 2D nucleation at a solid/quasiliquid interface has been definitively observed.
Concluding, we see that ice crystal growth data such as these can be used both as a probe of the temperature dependence of premelting and as a measure of the effects of premelting on ice crystal growth dynamics. We find it quite remarkable that the growth dynamics can be summed up so concisely by a single function This is true even going through the transition from no premelting to partially developed premelting to a fully developed quasiliquid layer, as described above. Although the equilibrium structure of the ice surface changes dramatically over this temperature range, as does the equilibrium vapor pressure, the functional form remains unchanged as the ice growth is everywhere described by simple 2D nucleation; essentially all that changes is the critical supersaturation parameter
This work was supported in part by the California Institute of Technology and the Caltech-Cambridge Exchange (CamSURF) program.
References
- [1] Kuroda, T., and Lacmann, R., “Growth Kinetics of Ice from the Vapour Phase and its Growth Froms,” J. Cryst. Growth 56, 189-205 (1982).
- [2] Kobayashi, T., and Kuroda, T., “Snow crystals”, in Morphology of Crystals–Part B, edition I, Sunagawa (Tokyo: Terra Scientific) 645-743 (1987).
- [3] Libbrecht, K. G., “The physics of snow crystals,” Rep. Prog. Phys., 68, 855-895 (2005).
- [4] Dash, J. G., Rempel, A. W., and Wettlaufer, J. S., “The physics of premelted ice and its geophysical consequences,” Rev. Mod. Phys. 78, 695-741 (2006)
- [5] Wei, X. et al, “Sum-frequency spectroscopic studies of ice interfaces,” Phys. Rev. B 66 085401 (2002).
- [6] Dosch, H., Lied, A., and Bilgram, J. H., “Glancing-angle X-ray scattering studies of the premelting of ice surfaces,” Surf. Sci. 327, 145-164 (1995).
- [7] Libbrecht, K. G., “An Improved Apparatus For Measuring the Growth of Ice Crystals from Water Vapor between -40C and 0C,” arXiv:1109.1511 (2011).
- [8] Taylor, J. R., “An Introduction to Error Analysis,” 2nd Edition, University Science Books (1997).
- [9] Saito, Y., “Statistical Physics of Crystal Growth,” World Scientific Books (1996).
- [10] Libbrecht, K. G., “Growth Rates of the Principal Facet of Ice Between -10C and -40C,” J. Cryst. Growth 247, 530 (2003).
- [11] Libbrecht, K. G.,“Precision Measurements of Ice Crystal Growth Rates,” arXiv:cond-mat/0608694 (2006).